Download presentation
Presentation is loading. Please wait.

1
Electron Probe Microanalysis

2
A technique to quantitatively analyze samples for their chemical composition on a micro-scale (~1μm) Instrument: Known as probe, microprobe or electron microprobe – all the same Main components Electron Gun Beam Column Sample Holder/Air Lock X-ray Spectrometers – Wavelength or Energy Dispersive Vacuum System Illumination System Brief Description of Main Components Electron Gun – Source of electrons generated by thermionic emission of Tungsten filament Grid cap (Wehnelt cylinder) negatively biased to constrict electron beam (From Reference 1, page 30)
 Instrument: Known as probe, microprobe or electron microprobe – all the same Main components Electron Gun Beam Column Sample Holder/Air Lock X-ray Spectrometers – Wavelength or Energy Dispersive Vacuum System Illumination System Brief Description of Main Components Electron Gun – Source of electrons generated by thermionic emission of Tungsten filament Grid cap (Wehnelt cylinder) negatively biased to constrict electron beam (From Reference 1, page 30)")
3
Beam Column Serves to de-magnify image of filament to achieve ~ 1 m beam size Contains a condenser lens and an objective lens (From reference 2, page 45)
")
4
Sample holder/air lock Provides a means of holding a sample for examination – typically a polished thin section or mineral grain mount Air lock provides a means to exchange samples – be careful here! X-ray spectrometers Two kinds of spectrometer found on probes – wavelength (WDS) and energy dispersive (EDS) – WDS 10X sensitivity of EDS Measure the same thing – characteristic spectra of an element present in the sample E = hc/λ = 12.396/ λ, E = energy in Kev, h = Planck’s constant, c = velocity of light, λ = wavelength in angstroms This relationship shows energy and wavelength are inversely related Method utilizes the characteristic radiation from an excited atom to quantify the amount of an element in a sample – Peak height proportional to amount of element present, after background correction Example: a K shell electron is ejected and an L electron drops to fill vacancy – leads to a Kα line (this radiation is specific to the atom excited) (From reference 3, page 7)
 and energy dispersive (EDS) – WDS 10X sensitivity of EDS Measure the same thing – characteristic spectra of an element present in the sample E = hc/λ = / λ, E = energy in Kev, h = Planck’s constant, c = velocity of light, λ = wavelength in angstroms This relationship shows energy and wavelength are inversely related Method utilizes the characteristic radiation from an excited atom to quantify the amount of an element in a sample – Peak height proportional to amount of element present, after background correction Example: a K shell electron is ejected and an L electron drops to fill vacancy – leads to a Kα line (this radiation is specific to the atom excited) (From reference 3, page 7).")
5
Origin of X-ray Lines for K and L Transitions

6
Quantitative analysis Purpose: to quantify the amount of an element in a sample – must compare signal from sample to that of a known standard To first order, counts from sample and counts from standard are directly related to concentration k ratio = I sample /I std = C sample In practice, k ratio must be corrected for sample effects k ratio = I sample /I std = C sample Z A F Corrections: Commonly referred to as “ZAF” corrections ZAF means we have to make three types of corrections to our sample data Z is the so called atomic number correction – is made up of stopping power and backscatter terms A is the absorption correction – takes into account that some of the X-rays produced in sample volume don’t make it out of the sample F is the fluorescence correction – corrects for X-ray induced excitation in the sample There is an alternate correction process utilized by many of the modern probes – it is the “Phi–rho-z” method, it basically combines the Z and A effects into one method, you still need to do the fluorescence correction as well Software packages included with all modern probes make the corrections for you (Buyer beware!)
")
7
(From reference 1, page 69) Sample - Electron Beam Interaction:
 Sample - Electron Beam Interaction:")
8
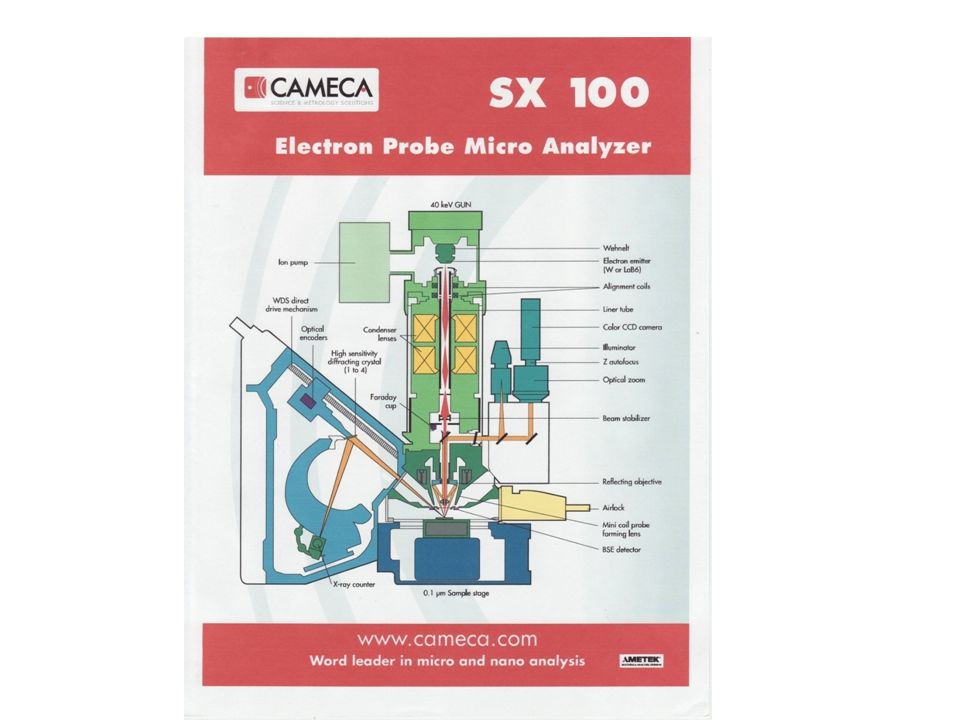
Vacuum System Required to sustain tungsten filament and stop residual gas X-ray absorption Illumination System Two modes usually provided 1. Optical illuminator – reflected light, sometimes transmitted light, for visual identification of sample features 2. SEM mode – the probe can function as an SEM (scanning electron microscope) with both secondary and backscatter images available – extremely useful method for selecting spots to probe Helpful Hints Beam energy must be 1 to 2 times energy required to excite desired X-ray line Beam current should be as low as possible for minimum spot size Spot size can be varied if sample is reactive under the electron beam (be sure to use same spot size for standards) Our Instrument: CAMECA SX-100 (note: only one other manufacturer of probes, JEOL)
 with both secondary and backscatter images available – extremely useful method for selecting spots to probe Helpful Hints Beam energy must be 1 to 2 times energy required to excite desired X-ray line Beam current should be as low as possible for minimum spot size Spot size can be varied if sample is reactive under the electron beam (be sure to use same spot size for standards) Our Instrument: CAMECA SX-100 (note: only one other manufacturer of probes, JEOL).")
10
R100191 Roselite Oxides MgOCaOZnOMnOAs2O5CoONiOTotalDatexyz 1.63854324.061680.0000120.28689649.2631712.803330.10245787.2637510/6/2010 13:16-14599646835 1.5966224.127040.0000120.16033949.0889113.13240.00609286.196210/6/2010 13:20-14600680835 1.07124824.230880.056240.15860749.6143713.217720.13884188.0363710/6/2010 13:23-14606755835 1.07260524.144280.061350.28929750.1229713.498210.14102287.8085910/6/2010 13:27-14619751835 1.35360124.19740.0000120.19713349.8147113.446820.08191687.9153710/6/2010 13:35-14787751835 1.21132324.170740.0000120.16788449.453713.394340.00001388.015210/6/2010 13:38-14787751835 1.19888423.936160.0000120.14776750.0236613.347330.08350886.7525810/6/2010 13:41-14770751835 1.29325524.012540.0434980.19244149.2438513.523510.0337687.5065110/6/2010 13:44-14782783835 1.70926524.219720.1279350.18974249.7936613.015280.02658288.8852810/6/2010 13:47-14782816835 1.70745724.398640.1280950.22220249.0089312.997490.12801385.9676510/6/2010 13:50-14782816835 1.78754723.601330.0000120.90888150.0298410.786780.04153588.8179110/6/2010 13:54-14598667835 2.44657324.234140.0000120.99290950.5544510.817570.06268686.6892610/6/2010 13:58-14602666835 1.92808324.248790.1327620.94276350.8515911.423320.00001387.0611310/6/2010 14:01-14529614835 2.04086224.057730.0000120.8867650.4996711.508330.03546186.6727410/6/2010 14:06-14474416835 1.97873524.203430.0000121.00821750.8383511.155980.00001387.0328410/6/2010 14:09-1447828835 Ave.:1.60230673324.122966670.0366660.45012253349.88012212.5378940.058794133 Std. Dev.:0.3870136670.1764782490.0510260.3552072730.5908852541.0221395840.049448279 OxideWt % OxideOxide MWMol #Atom Prop.Anion Prop.# Ions/formula MnO0.4570.940.0063430.0063433890.0293356090.029 ZnO0.0481.380.0004920.0004915210.0022730870.002 CoO 12.5474.930.1673520.1673517320.7739341090.774 NiO 0.0674.930.0008010.0008007470.0037031330.004 MgO1.640.310.0396910.0396910060.1835548550.184 CaO24.1256.080.43010.4300998571.989037971.989 As 2 O 5 49.88229.840.2170211.085102685.0181612372.007 Total:88.691.729880933 Enter Oxygens in formula:8 Oxygen Factor Calculation: F=4.624596 F is factor for anion proportion calculation Ideal Chemistry:Ca 2 (Co,Mg)(AsO 4 ) 2 ·2H 2 O Measured Chemistry:Ca 1.989 (Co 0.774 Mg 0.184 Mn 0.029 Ni 0.004 Zn 0.002 ) Σ=0.993 (As 1.004 O 4 ) 2 ·2H 2 O
(AsO 4 ) 2 ·2H 2 O Measured Chemistry:Ca (Co Mg Mn Ni Zn ) Σ=0.993 (As O 4 ) 2 ·2H 2 O.")
11
References 1.Scanning Electron Microscopy and X-ray Microanalysis, 3 rd ed., J. Goldstein and others, Springer Verlag, 2003 2.Electron beam X-Ray Microanalysis, K. F. J. Heinrich, Van Nostrand Reinhold Co., 1981 3.Elements of X-Ray Diffraction, B. D. Cullity, 2 nd ed., Addison Wesley Pub. Co., 1978 Other useful references: Principles and Practice of X-ray Spectrometric Analysis, 2nd Ed., E. P. Bertin, Plenum Press, 1975 (a comprehensive treatment of X-ray spectrometry) Principles of Modern Physics, R. B. Leighton, McGraw-Hill, 1959 (extensive treatment of origin of X-ray spectra) Quantum Physics, R. Eisberg and R. Resnick, J. Wiley and Sons, 1974 ( Less rigorous treatment of modern physics than Leighton) Electron Probe Microanalysis, L. S. Birks, Wiley-Interscience, 1971 (classic reference with a worked example of the ZAF correction) Electron Microprobe Analysis and Scanning Electron Microscopy in Geology, S. J. B. Reed, Cambridge, 2005 (current brief reference to both probe and SEM for geologists)
 Principles of Modern Physics, R. B. Leighton, McGraw-Hill, 1959 (extensive treatment of origin of X-ray spectra) Quantum Physics, R. Eisberg and R. Resnick, J. Wiley and Sons, 1974 ( Less rigorous treatment of modern physics than Leighton) Electron Probe Microanalysis, L. S. Birks, Wiley-Interscience, 1971 (classic reference with a worked example of the ZAF correction) Electron Microprobe Analysis and Scanning Electron Microscopy in Geology, S. J. B. Reed, Cambridge, 2005 (current brief reference to both probe and SEM for geologists).")
Similar presentations


>")


>")


 By Austin Avery.>")


 HITESH KUMAR GUPTA(09320) CHANDAN SINGH(09260) SCANNING ELECTRON MICROSCOPE MATERIAL SCIENCE ASSIGNMENT.>")

 But consider now different.>")
>")