Download presentation
Presentation is loading. Please wait.

1
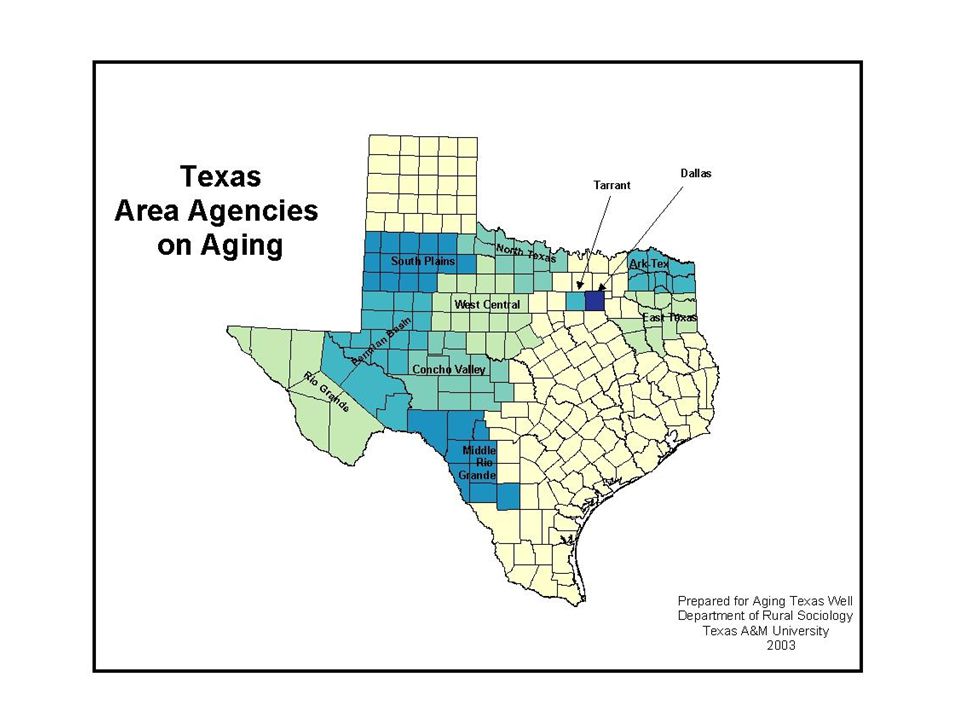
Health and Long-term care Volunteerism Recreation Education Spirituality Social Engagement Transportation Physical Health Mental Health Housing Caregiving Employment Legal Financial Protections Community Supports ARK-TEX AAA

2
ARK-TEX AAA Demographic Profile Cruz C. Torres, RN, Ph.D. Department of Rural Sociology Hispanic Research Program

5
Socioeconomic Profile: Income Per capita income for the Ark-Tex AAA is $16,658 vs. $19,617 the State’s per capita –Franklin Co. has highest per capita, $17,563 –Red River Co. has lowest per capita, $15,058 Median household income in Ark-Tex AAA is $31,593 compared to $39,927 for Texas –Bowie Co. has highest median household income, $33,001 –Red River Co. has lowest median household income, $27,558

6
Socioeconomic Profile: Poverty 17.1% of Ark-Tex AAA residents live below poverty vs. 15.4% of Texas residents –Titus Co. has highest poverty rate, 18.5% –Hopkins Co. has lowest poverty rate, 14.6% 14.4% of Ark-Tex AAA elderly live below poverty vs. 12.8% of Texas elderly –Delta Co. has the highest rate of elderly living below poverty, 20.6% –Franklin Co. has the lowest rate of elderly living below poverty, 12.3%

7
Elderly Household Characteristics 26.3% of Ark-Tex AAA households include a member that is 65+ vs. 17.7% of Texas households –Red River Co. has highest rate of households with someone 65 years old or older, 32.4 % –Titus Co. has the lowest rate of households with someone 65 years old or older, 23.8% 12.3% elderly live alone in Ark-Tex AAA compared to 7.3% of Texas elderly –Delta Co. has the highest rate of elderly living alone, 15.6% –Titus Co. has the lowest rate of elderly living alone, 10.8% The percent of elderly with disabilities in Ark-Tex AAA is 48.6% vs. 44.8% the State rate –Delta Co. elderly report the highest disability rate, 57.5% –Franklin Co. elderly report the lowest disability rate, 41.1%

8
Language & Education Profile 7.8% of Ark-Tex AAA residents speak a language other than English vs. 31.2 % of Texas –Titus Co. has highest rate, 26.9% –Delta Co. has the lowest rate, 2.2% 6.8% of Ark-Tex AAA residents speak Spanish vs. 27.0% of Texas residents –Titus Co. has highest rate of Spanish speakers, 26.5% –Delta Co. has the lowest rate, 1.5% High School completion or equivalency in Ark-Tex AAA is 74.4% vs. 75.7% for Texas –Franklin Co. has highest HS completion rate, 77.4% –Titus Co. has lowest rate, 65.5%

9
Figure 1: State and Ark-Tex AAA Language Diversity in 2000

10
Residency Status of Population In-migration rate for the Ark-Tex AAA residents is 19.2% vs. 19.6% for Texas –Franklin Co. has highest in-migration rate, 27.5% –Cass Co. has lowest in-migration rate, 15.9% Non-citizen rate for Ark-Tex AAA residents is 2.7% vs. 9.5% for Texas –Titus Co. has the highest rate, 12.6% –Delta Co. has the lowest rate, 0.3%

11
Figure 2. State and Ark-Tex AAA Resident Characteristics in 2000

12
Ethnic Diversity Ark-Tex AAA has a higher percent of non-Hispanic White residents than Texas, 74.9% vs. 53.1% –Delta Co. has highest rate of non-Hispanic Whites, 87.6% –Titus Co. has lowest rate of non-Hispanic Whites, 60% 7.1% of Ark-Tex AAA residents are Hispanic vs. 32% of Texas residents –Titus Co. has highest rate of Hispanics, 28.3% –Cass Co. has lowest rate of Hispanics, 1.7% 17.0% of Ark-Tex residents are African American vs. 11.6% of Texas residents –Morris Co. has highest rate of African Americans, 24.3% –Franklin Co. has lowest rate of African Americans, 4.0% Figures 3a, 3b, 3c illustrate the projected decrease in non- Hispanic Whites and the corresponding increase in Hispanics

13
Figure 3a. State and Ark-Tex AAA Ethnic Diversity in 2000

14
Figure 3c. State and Ark-Tex AAA Ethnic Diversity in 2040

15
Current & Projected Elderly Population Figure 4 illustrates current and projected elderly percent of population Figures 5a, 5b, 5c illustrate the ethnic shift that will occur in the elderly population by 2040 Figures 5d, 5e, 5f illustrate the increase of elderly within each ethnic population Figures 6a, 6b, 6c illustrate the current and projected sex ratio among the elderly Figures 7a, 7b, 7c (in your packet) illustrate the current and projected proportion of the population that will be elderly for each ethnic group by 2040
 illustrate the current and projected proportion of the population that will be elderly for each ethnic group by 2040")
16
Figure 4. Current and Projected Percent of Population that will be Elderly

17
Figure 5a. Percent of the Elderly by Ethnic Group and Age Group in 2000 * Example: Of the total elderly (60+) in Ark-Tex AAA in 2000, 86.3% are non-Hispanic White. (white elderly / total elderly)*100 = 86.3% ** Example: Of all residents over 85 years in Ark-Tex AAA in 2000, 84.3% are non-Hispanic White. ( white 85+ / total 85+)*100 = 84.3%
 in Ark-Tex AAA in 2000, 86.3% are non-Hispanic White. (white elderly / total elderly)*100 = 86.3% ** Example: Of all residents over 85 years in Ark-Tex AAA in 2000, 84.3% are non-Hispanic White. ( white 85+ / total 85+)*100 = 84.3%.")
18
Figure 5c. Percent of the Elderly by Ethnic Group and Age Group in 2040 * Example: Of the total elderly (60+) in Ark-Tex AAA in 2040, 70.3% are non-Hispanic White. (white elderly / total elderly)*100 = 70.3% ** Example: Of all residents over 85 years in Ark-Tex AAA in 2040, 81.5% are non-Hispanic White. ( white 85+ / total 85+)*100 = 81.5%
 in Ark-Tex AAA in 2040, 70.3% are non-Hispanic White. (white elderly / total elderly)*100 = 70.3% ** Example: Of all residents over 85 years in Ark-Tex AAA in 2040, 81.5% are non-Hispanic White. ( white 85+ / total 85+)*100 = 81.5%.")
19
Figure 5d. Percent of the Population within each Ethnic Group that are 60+ and Percent of those 60+ that are 85 and Older in 2000 * Example: Of the total non-Hispanic Whites living in Ark-Tex AAA in 2000, 22.8% are over the age of 60 years. ** Example: Of the total non-Hispanic Whites 60+ in Ark-Tex AAA in 2000, 10.6% are 85+. (white 85+ / white 60+)*100 = 10.6%.
*100 = 10.6%..")
20
Figure 5f. Projected Percent of the Population within each Ethnic Group that are 60+ and Percent of those 60+ that are 85 and Older in 2040 * Example: Of the total non-Hispanic Whites living in Ark-Tex AAA in 2040, 30.3% are over the age of 60 years. ** Example: Of the total non-Hispanic Whites 60+ in Ark-Tex AAA in 2040, 14.5% are 85+. (white 85+ / white 60+)*100 = 14.5%.
*100 = 14.5%..")
21
Figure 6a. Differences in Sex Distribution Among the Elderly Population in 2000

22
Figure 6c. Differences in Sex Distribution Among the Elderly Population in 2040

23
Ark-Tex AAA Table 5. Health Care Delivery System Number of doctors in Tex-Ark AAA –Total number of physicians by county –Ratio of doctors to population by county Number of nurses in Tex-Ark AAA –Total number of nurses by county –Ratio of nurses to population by county Number of dentists in Tex-Ark AAA –Total number of dentists by county –Ratio of dentists to population by county Number of hospitals and hospital beds in Tex-Ark AAA and AAA counties Number of nursing homes and number of licensed nursing home beds in Tex-Ark AAA and AAA counties

24
http://ruralsoc.tamu.edu/presentations.php

Similar presentations


 981-4076>")


