Download presentation
Presentation is loading. Please wait.

1
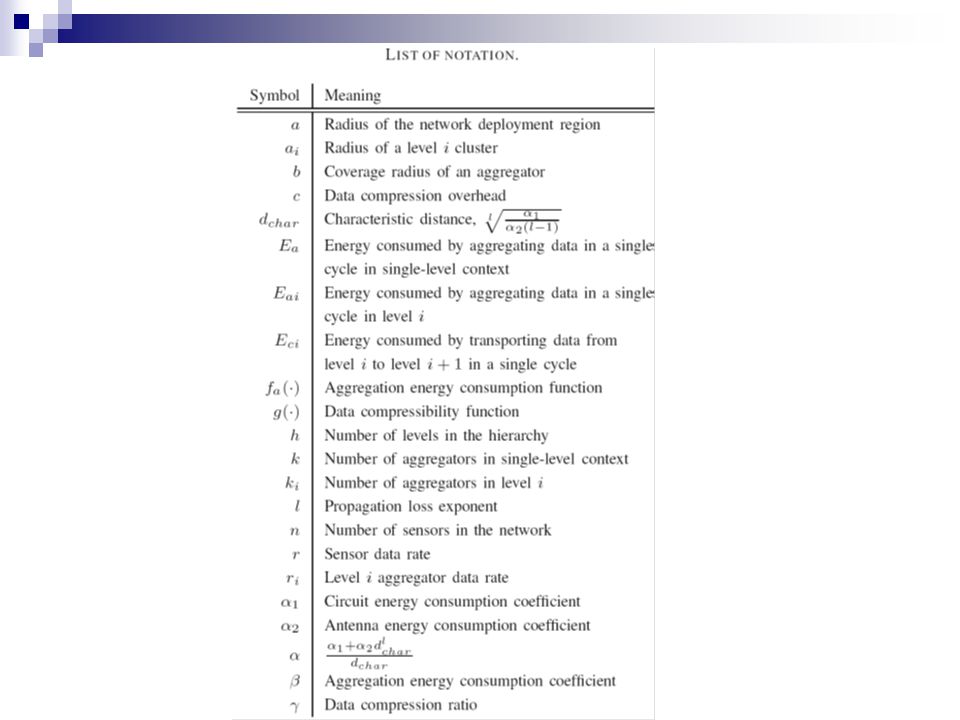
A Hierarchical Energy-Efficient Framework for Data Aggregation in Wireless Sensor Networks IEEE TRANSACTIONS ON VEHICULAR TECHNOLOGY, VOL. 55, NO. 3, MAY 2006 Yuanzhu Peter Chen, Arthur L. Liestman, Member, IEEE, and Jiangchuan Liu, Member, IEEE

2
Outline Introduction Background and related work One-level aggregation Hierarchical aggregation Performance evaluation Conclusion

3
Introduction A wireless sensor network is a collection of sensors interconnected by wireless communication channels. In many of applications, the data to be collected are state-based, that is, they consist of measurements of ambient surroundings. Significant redundancies often exist in such data due to spatial-temporal correlations.

4
Introduction These local redundancies can be removed prior to sending the oversized raw data to the sink and draining the limited sensor energy store, referred to as data aggregation or data fusion. For example, simple statistical values such as sum, mean, or deviation can be easily aggregated into a single scalar. We investigate energy-efficient aggregator selection in wireless sensor networks. The feature is we consider a general compression model.

5
Background and related work There are three types of data collection in sensor networks, Event-based data, such as intrusion detection or object tracking. Focused state-based data, which are collected in response to query. Global state-based data, such as temperature or humidity. Our interest is in global state-based data.

6
Background and related work In the model of Bhardwaj et al.[17], the energy consumed for a node to relay a unit data to another node at distance d is denoted by The distance from one sensor to the next that minimizes the energy consumed is characteristic distance, denoted
![Background and related work In the model of Bhardwaj et al.[17], the energy consumed for a node to relay a unit data to another node at distance d is denoted by The distance from one sensor to the next that minimizes the energy consumed is characteristic distance, denoted](http://images.slideplayer.com/16/5084754/slides/slide_6.jpg "Background and related work In the model of Bhardwaj et al.[17], the energy consumed for a node to relay a unit data to another node at distance d is denoted by The distance from one sensor to the next that minimizes the energy consumed is characteristic distance, denoted")
7
Background and related work For state-based data collection, Heinzelman et al.[2] presented a clustering algorithm (LAECH) to aggregation the data from sensors. In LEACH, each sensor becomes a clusterhead with a fixed probability during startup, and every nonclusterhead sensor join the cluster of the nearest clusterhaed. The clusterheads act as aggregators, as clusterhead consume more energy than nonclusterheads, LEACH allows rotation of clusterhead status.
![Background and related work For state-based data collection, Heinzelman et al.[2] presented a clustering algorithm (LAECH) to aggregation the data from sensors.](http://images.slideplayer.com/16/5084754/slides/slide_7.jpg "In LEACH, each sensor becomes a clusterhead with a fixed probability during startup, and every nonclusterhead sensor join the cluster of the nearest clusterhaed. The clusterheads act as aggregators, as clusterhead consume more energy than nonclusterheads, LEACH allows rotation of clusterhead status..")
8
One level aggregation System model and notation We first construct an ideal model, where the sensors and the aggregators are uniformly distributed over the region. Sensor nodes are partitioned into clusters, each with a clusterhead. The sensors within each cluster periodically send their data to the clusterhead, The clusterhead compresses the data collected form all members and sends the aggregated data to the sink.

9
System model and notation Assume that data collection is synchronized by cycles, there each cycle consists of a round of data collection, transmission, and aggregation. The data generated are sent to the aggregator as a packet of r bits. Assume that, by relaying packets via hops of the characteristic distance, transporting one unit of data a distance d consumes α × d units of energy, where

10
System model and notation Using a general function g(x) to represent the data compressibility at aggregators. Basically, g(x) gives the data volume after compression as a function of the input data volume x. Using f a (x) to denote the energy consumed by compressing x data units. This is generally proportional to x but need to be.
 gives the data volume after compression as a function of the input data volume x. Using f a (x) to denote the energy consumed by compressing x data units. This is generally proportional to x but need to be..")
12
Optimal number of aggregators Assume that the sensors are deployed in a circular region A of radius a meters with the sink located at the center of the circle. Let E c0 denote the total energy consumed by all of the sensors sending data to their respective aggregators in a single cycle.

13
Optimal number of aggregators Consider the area covered by cluster C centered at (x c,y c ). The total distance that the data packets travel from all members of C to (x c,y c ) is where is sensor density For large k, the number of aggregators, a typical cluster can be approximated as a circle of radius [26] with the aggregator at the center. The above expression evaluated to
 is where is sensor density For large k, the number of aggregators, a typical cluster can be approximated as a circle of radius [26] with the aggregator at the center. The above expression evaluated to.")
14
Optimal number of aggregators After factoring in the α coefficient to obtain the energy consumption, the sensor data rate r, and summing over the k aggregators, we have Let E a denote the total energy consumed by data aggregation in a single cycle, inasmuch as the aggregator receives data at an average rate of bits per cycle, we have

15
Optimal number of aggregators Let E c1 denote the total energy consumed by all of the aggregators sending these data to the sink in a single cycle. Inasmuch as the data are sent by an aggregator at a rate of bits per cycle and the aggregator density is, we have which evaluates to

16
Optimal number of aggregators Summing up (1)(2)(3), we have Consider a typical circuit power consumption model, where the aggregation energy consumption is proportional to the volume of the data to be compressed, that is,, for some constant β. Consider a typical linear compression model,,where γ is the compression ratio and c is compression overhead. The number of aggregators that minimizes the energy consumption is

17
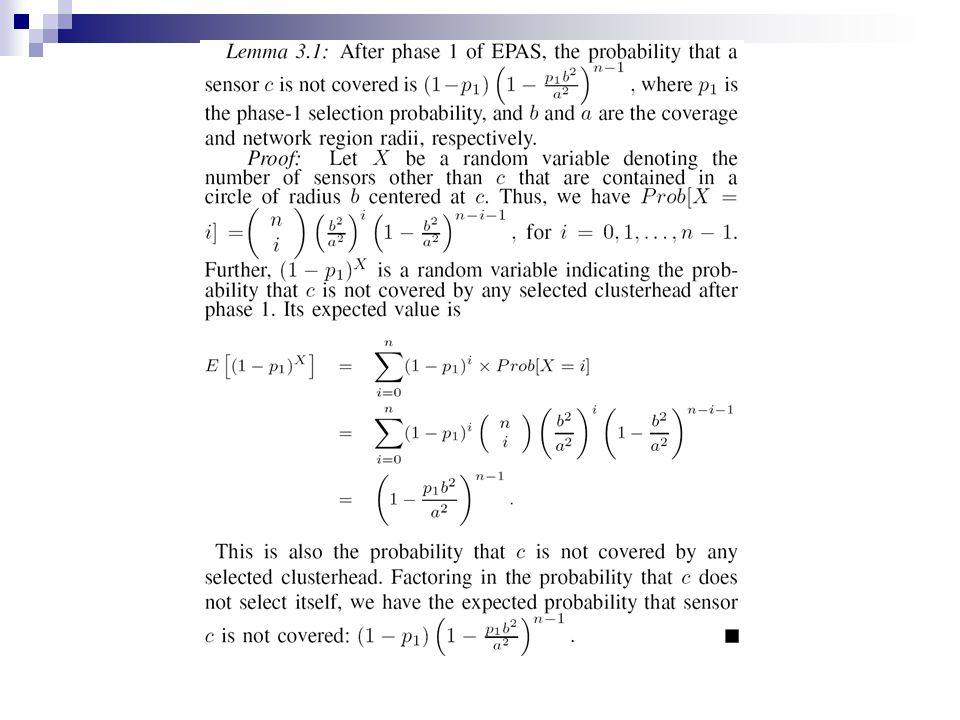
Distributed aggregator selection-EPAS Energy-efficient protocol for aggregator selection (EPAS) is a randomized and fully distributed algorithm that consists of two phases. First phase, each sensor chooses to be a clusterhead with probability p 1 independently for some Suppose that each clusterhead has a fixed coverage radius of b meters. Second phase, each sensor that is not within the coverage radius of some clusterhead declares itself to be a clusterhead with probability p 2.

18
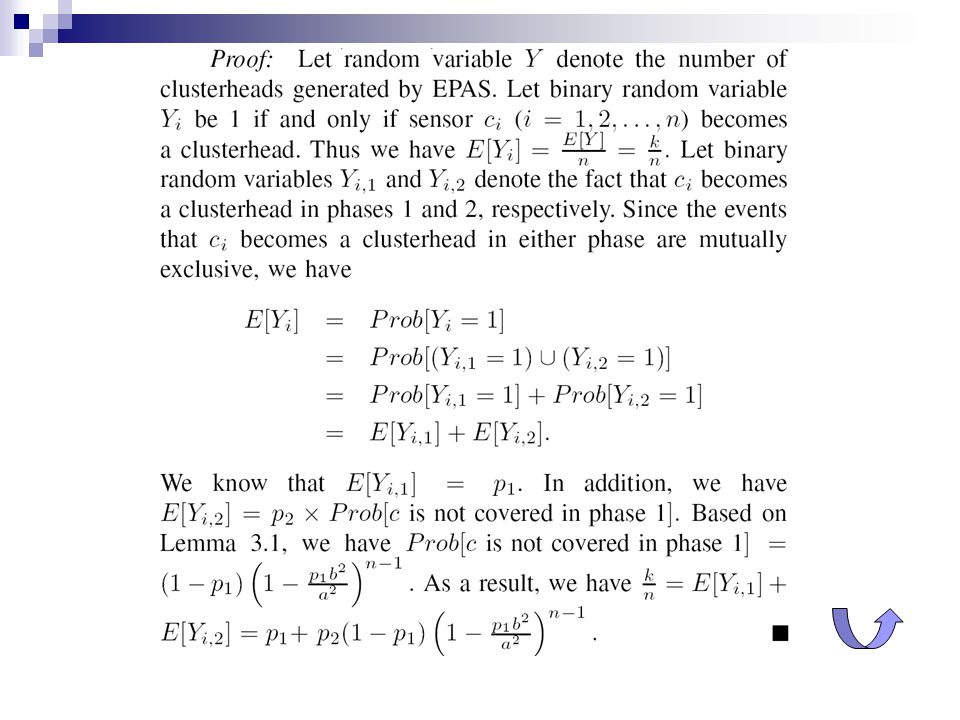
Distributed aggregator selection-EPAS By careful choice of p 1 and p 2, we can ensure that the expected number of aggregators is k. Theorem3.2 : the expect number of clusterheads generated by EPAS is k if and only if p 1 and p 2 are chosen such that (proof) For large k, k circles of radius can cover the entire region of area [26]. Using a larger coverage radius to ensure that the most of the sensors are within the coverage radius of at least one aggregator.
 For large k, k circles of radius can cover the entire region of area [26]. Using a larger coverage radius to ensure that the most of the sensors are within the coverage radius of at least one aggregator..")
19
Hierarchical aggregation We begin with all sensors in level 0 of hierarchy. From those sensors, the select a subset as aggregators for level 1. … Finally, the sink is the only aggregator of level h+1. Once the aggregation hierarchy is established, sensors of level i collect data and send them to the nearest level i+1 aggregator. This process continues until the level h aggregators forward the data to the sink.

20
Hierarchical aggregation optimal numbers of aggregators in the hierarchy k i denote the number of aggregators in level i The data are sent out of a level i aggregator to its clusterhead at a rate of r i bits/cycle and r 0 =r A level i aggregator receives data from level (i-1) aggregators. The data rate r i can be expressed as

21
optimal numbers of aggregators in the hierarchy Let E ai be the total energy consumed by the compression done by all of aggregators of each level i in a single cycle. E ci, the total energy consumed by transporting data form level i aggregators to level (i+1) aggregators in a single cycle. A typical level (i+1) cluster C can be approximated with a circle of radius, centered at (x c,y c ), and the density of the level i aggregators is
 aggregators in a single cycle. A typical level (i+1) cluster C can be approximated with a circle of radius, centered at (x c,y c ), and the density of the level i aggregators is.")
22
optimal numbers of aggregators in the hierarchy The portion of E ci within this cluster is Therefore, summing over the k i+1 level (i+1) clusters we have The total energy consumed in a single cycle is
 clusters we have The total energy consumed in a single cycle is")
23
hEPAS Hierarchical EPAS(hEPAS) selects an expected k i as sensors as level i aggregators. hEPAS executes for h iterations. Each iteration is similar to EPAS. During iteration i, a level (i-1) aggregator chooses to become a level i aggregator with probability in the first phase. Each chosen aggregator has a coverage radius of
 aggregator chooses to become a level i aggregator with probability in the first phase. Each chosen aggregator has a coverage radius of.")
24
Performance evaluation Evaluate the performance of EPAS and hEAPS through simulations The system specifications we use similar to those used by Heinzelman et al. [2].

25
Performance evaluation

26
Choose a suitable value of p 1, and thus that of the corresponding p 2, that leaves few sensors uncovered after EPAS. Choose the expected numbers of aggregators k to be 25, 100, 400,1600. The coverage radius,this gives b=400, 200, 100, 50 m. We consider each value of p 1 such that p 1 /(k/n)=0.05i,where i=0,1,2,…,20
=0.05i,where i=0,1,2,…,20.")
27
Performance evaluation

28
Now measure the energy consumed in a single cycle of the data collection assuming a single level of aggregation. We compute the maximum energy consumed by an individual sensor and the total of these costs over all sensors. Choose the number of aggregators to be a value 100j,where j=1,2,…,30

29
Performance evaluation

30
Now consider whether additional energy savings can be achieved by instituting a hierarchical structure.

31
Performance evaluation

32
We use the hEPAS protocol to select ki aggregators at each level i and then measured the energy consumed by each sensor, recording both the maximum for any sensor and the total consumed by all sensors.

33
Performance evaluation

34
Conclusion We calculated the number of aggregators needed to minimize the amount of total energy consumed in the network. EPAS and hEPAS were presented to achieve the target number of aggregators. The simulations show that both total energy consumption and the maximum energy consumption are significantly reduced by the protocols. We can better balance the energy consumption among nodes by the use of mobile aggregators.

Similar presentations


>")


 Assignment.>")


