Download presentation
Presentation is loading. Please wait.

1
Part III Stability indicating colorimetric method for the determination of meclophenoxate hydrochloride.

2
-This part includes a general introduction about the chemistry and mode of action of meclophenoxate hydrochloride. -A review on the reported methods for its quantitative determination. Stability indicating colorimetric method for the determination of meclophenoxate hydrochloride using ferric hydroxamate complex formation.

3
-Structure of meclophenoxate
-The proposed mechanism for preparing the degradation product: 2 N NaOH Reflux 25 min.

4
The proposed reaction mechanism:

5
Figure ( 26 ): Absorption spectra of
Meclophenoxate.HCL 100 µg. ml ( ) and colored product 300 µg. ml-1 (———).
 and colored product 300 µg. ml-1 (———).")
6
Figure (30): Effect of volume (ml) of hydroxyl amine hydrochloride
solution on the absorbance of the ferric hydroxamate complex with meclophenoxate hydrochloride.

7
Figure (31): Effect of volume (ml) of ferric chloride solution on the
absorbance of the ferric hydroxamate complex with meclophenoxate hydrochloride.

8
Figure (32): Effect of volume (ml)of 1 N sodium hydroxide on the
absorbance of the ferric hydroxamate complex with meclophenoxate hydrochloride.

9
Figure (28): Absorption spectra of ferric hydroxamate complex of meclophenoxate μg. ml-1
: Absorption spectra of ferric hydroxamate complex of meclophenoxate μg. ml-1")
10
Figure (29): Linearity of the absorbance of ferric hydroxamate
complex of meclophenoxate hydrochloride to the corresponding concentration of meclophenoxate hydrochloride.

11
Concentration (µg/ml)
Table (XXI): Determination of meclophenoxatehydrochloride in laboratory prepared mixtures by the proposed procedures. Concentration (µg/ml) Percentage % Ferric hydroxamate Method Meclophenoxate.HCl Degradation product Recovery % 350 50 87.5% 12.5% 99.85% 300 100 75% 25% 102.50% 250 150 62.5% 37.5% 98.82% 200 50% 99.99% 98.45% 100.40% Mean 100.00 S.D. 1.431
: Determination of meclophenoxatehydrochloride in laboratory prepared mixtures by the proposed procedures. Concentration (µg/ml) Percentage % Ferric hydroxamate. Method. Meclophenoxate.HCl. Degradation product. Recovery % % 12.5% 99.85% % 25% % % 37.5% 98.82% % 99.99% 98.45% % Mean S.D")
12
Table (XXII): Determination of meclophenoxatehydrochloride in lucidril tablets by the proposed procedures. Lucidril tablets claimed to contain 250 mg Batch number Ferric hydroxamate method Compendial method** % Found Recovery % ± S.D.* 010132 100.87 99.54 ± 0.632 010156 99.39 99.65 ± 0.951 020512 99.01 ± 0.547 * Average of six determinations. **Spectrophotometric method

13
Ferric hydroxamate method
Table (XXIII): Statistical comparison for the results obtained by the proposed method and the compendial method for the analysis of meclophenoxate hydrochloride in pure powder form. Ferric hydroxamate method Compendial method* Meclophenoxate. HCl Mean S.D. 0.755 0.547 Variance 0.570 0.299 N 7 6 F test 1.906 (4.95) Student’s t test 0.658 (2.201) The figures in parenthesis are the corresponding tabulated values at P=0.05. *Spectrophotometric method
: Statistical comparison for the results obtained by the proposed method and the compendial method for the analysis of meclophenoxate hydrochloride in pure powder form. Ferric hydroxamate method. Compendial method* Meclophenoxate. HCl. Mean S.D Variance N F test (4.95) Student’s t test (2.201) The figures in parenthesis are the corresponding tabulated values at P=0.05. *Spectrophotometric method.")
14
Ferric hydroxamate method
Table (XXIV): Results of application of standard addition to the determination of meclophenoxate hydrochloride by the proposed method. Batch number Standard added (mg.ml-1) Ferric hydroxamate method Meclophenoxate. HCl Recovery % of added 010132 1.00 1.50 2.00 99.06 100.20 101.06 Mean ± S.D. ± 1.003 010156 98.33 99.07 99.50 Mean ± S.D. 98.96± 0.591 020512 98.50 99.75 99.18 99.14 ± 0.625
: Results of application of standard addition to the determination of meclophenoxate hydrochloride by the proposed method. Batch number. Standard added. (mg.ml-1) Ferric hydroxamate method. Meclophenoxate. HCl. Recovery % of added Mean ± S.D ± Mean ± S.D ± ±")
15
Table (XXV) : Assay parameters and method validation
Ferric hydroxamate method Meclophenoxate. HCl. Range (μg.ml-1) Slope 0.0022 Intercept 0.0061 Mean S.D. 0.755 Variance 0.57 Coff. of variation 0.744 Correl. Coef.(r) 0.9996 * RSD%a *RSD %b * RSD%a , RSD%b the intraday, interday respectively (n=5) relative standard deviation of concentrations ( µg/ml) for meclophenoxate HCl.
 Slope Intercept Mean S.D Variance Coff. of variation Correl. Coef.(r) * RSD%a *RSD %b * RSD%a , RSD%b the intraday, interday respectively (n=5) relative standard deviation of concentrations ( µg/ml) for meclophenoxate HCl.")
16
Part IV Different stability indicating methods for the determination of vincamine in presence of its degradation product.

17
-This part includes a general introduction about the chemistry of vincamine, mode of action.
-A review on the reported methods used for vincamine quantitative determination.

18
Section [A] Determination of vincamine in presence of its acid degradation product by the derivative ratio spectrophotometry.
![Section [A] Determination of vincamine in presence of its acid degradation product by the derivative ratio spectrophotometry.](http://slideplayer.com/slide/5080979/16/images/18/Section+%5BA%5D+Determination+of+vincamine+in+presence+of+its+acid+degradation+product+by+the+derivative+ratio+spectrophotometry..jpg "Section [A] Determination of vincamine in presence of its acid degradation product by the derivative ratio spectrophotometry.")
19
-Structure of vincamine.
-Structure of vincamine. -The proposed mechanism for degradation of vincamine

20
Figure ( 37 ): Absorption spectra of
vincamine 20 µg. ml (———) and its degradation product 20 µg. ml-1 ( ) Using 0.1N hydrochloric acid as a solvent.
 and. its degradation product 20 µg. ml-1 ( ) Using 0.1N hydrochloric acid as a solvent.")
21
dA/dλ Figure (38): First order spectra of
Figure (38): First order spectra of Vincamine 20 μg.ml-1 (______) Degradation product 20 μg.ml-1 (_ _ _ _ _ _) Using 0.1N hydrochloric acid as a solvent.
: First order spectra of. Vincamine 20 μg.ml-1 (______) Degradation product 20 μg.ml-1 (_ _ _ _ _ _) Using 0.1N hydrochloric acid as a solvent.")
22
A(vincamine/deg.prod.)
Figure (39) : Zero order of the ratio spectra of vincamine μg.ml-1 using 20 µg.ml-1 of deg. product as a divisor.
 : Zero order of the ratio spectra of vincamine μg.ml-1. using 20 µg.ml-1 of deg. product as a divisor.")
23
First order of the ratio spectra of vincamine 12-48 μg.ml-1
dA(vincamine/deg.product)/dλ Figure (40): First order of the ratio spectra of vincamine μg.ml-1 using 20 µg.ml-1 of deg. product as a divisor.
/dλ. Figure (40): First order of the ratio spectra of vincamine μg.ml-1. using 20 µg.ml-1 of deg. product as a divisor.")
24
Figure (41): Linearity of the peak amplitude of the first derivative of the
ratio spectra at nm to the corresponding concentration of vincamine.

25
Table (XXVI) : Determination of vincamine in laboratory prepared mixtures by the proposed procedures. Concentration (µg/ml) Percentage % Derivative ratio method Vincamine Degradation product Recovery % 42 6 87.5 % 12.5 % 99.96 36 12 75 % 25 % 99.19 30 18 62.5 % 37.5 % 101.40 24 50 % 100.75 101.30 Mean 100.52 S.D. 0.937
 Percentage % Derivative ratio method. Vincamine. Degradation product. Recovery % % 12.5 % % 25 % % 37.5 % % Mean S.D")
26
Table (XXVII): Determination of vincamine in oxybral capsules by the proposed procedures.
Oxybral capsules claimed to contain 30 mg Batch number Derivative ratio method Compendial method** % Found Recovery % ± S.D.* A 99.02 99.32 ± 0.956 A 98.98 98.56 ± 0.857 A 99.52 99.21 ± 0.659 * Average of four determinations. **Spectrophotometric method

27
Derivative ratio method
Table (XXVIII): Statistical comparison for the results obtained by the proposed method and the compendial method for the analysis of vincamine in pure powder form. Derivative ratio method Compendial method* Vincamine Mean 99.90 99.58 S.D. 1.041 1.011 Variance 1.084 1.022 N 10 6 F test 1.060 (4.77) Student’s t test 0.601 (2.145) The figures in parenthesis are the corresponding tabulated values at P=0.05. *Spectrophotometric method
: Statistical comparison for the results obtained by the proposed method and the compendial method for the analysis of vincamine in pure powder form. Derivative ratio method. Compendial method* Vincamine. Mean S.D Variance N F test (4.77) Student’s t test (2.145) The figures in parenthesis are the corresponding tabulated values at P=0.05. *Spectrophotometric method.")
28
Derivative ratio method
Table (XXIX): Results of application of standard addition to the determination of vincamine by the proposed method. Batch number Standard added (mg.ml-1) Derivative ratio method Vincamine Recovery % of added A 0.250 0.375 0.500 99.73 101.50 102.80 Mean ± S.D. ± 1.541 A 99.64 100.09 99.19 Mean ± S.D. 99.64 ± 0.450 021554A 98.15 98.98 99.23 98.78 ± 0.565
: Results of application of standard addition to the determination of vincamine by the proposed method. Batch number. Standard added. (mg.ml-1) Derivative ratio method. Vincamine. Recovery % of added A Mean ± S.D ± A Mean ± S.D ± A ±")
29
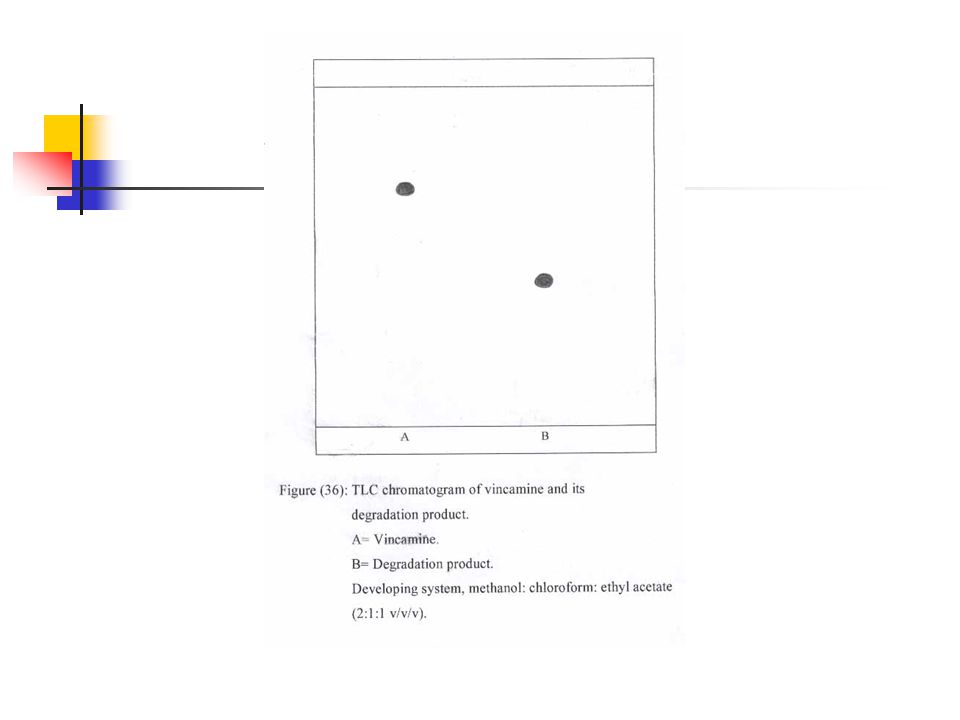
Section (B) Densitometric determination of vincamine in presence of its acid degradation product
 Densitometric determination of vincamine in presence of its acid degradation product")
31
Figure ( 44 ): Scanning profile of the TLC chromatogram of vincamine at 281 nm.
: Scanning profile of the TLC chromatogram of vincamine at 281 nm.")
32
Figure (45): Linearity of the area under the peak to the
corresponding concentration of vincamine.

33
Concentration (µg/spot)
Table (XXX): Determination of vincamine in laboratory prepared mixtures by the proposed procedures. Concentration (µg/spot) Percentage % Densitometric method Vincamine Degradation product Recovery % 9 1 90% 10% 98.18 8 2 80% 20% 99.40 7 3 70% 30% 100.04 6 4 60% 40% 99.13 5 50% 100.01 101.36 99.00 Mean 99.70 S.D. 1.032
: Determination of vincamine in laboratory prepared mixtures by the proposed procedures. Concentration (µg/spot) Percentage % Densitometric. method. Vincamine. Degradation product. Recovery % % 10% % 20% % 30% % 40% % Mean S.D")
34
Oxybral capsules claimed to contain 30 mg
Table (XXXI): Determination of vincamine in oxybral capsules by the proposed procedures. Oxybral capsules claimed to contain 30 mg Batch number Densitometric method Compendial method** % Found Recovery % ± S.D.* A 99.96 99.32 ± 0.956 A 100.31 98.56 ± 0.857 A 99.57 99.21 ± 0.659 * Average of four determinations. **Spectrophotometric method
: Determination of vincamine in oxybral capsules by the proposed procedures. Oxybral capsules claimed to contain 30 mg. Batch number. Densitometric method. Compendial method** % Found. Recovery % ± S.D.* A ± A ± A ± * Average of four determinations. **Spectrophotometric method.")
35
Table (XXXII): Statistical comparison for the results obtained by the proposed method and the compendial method for the analysis of vincamine in pure powder form. Densitometric method Compendial method* Vincamine Mean 100.09 99.58 S.D. 0.761 1.011 Variance 0.579 1.022 N 8 6 F test 1.765 (4.362) Student’s t test 1.08 (2.179) The figures in parenthesis are the corresponding tabulated values at P=0.05. *Spectrophotometric method
 Student’s t test (2.179) The figures in parenthesis are the corresponding tabulated values at P=0.05. *Spectrophotometric method.")
36
Table (XXXIII): Results of application of standard addition to the determination of vincamine by the proposed method. Batch number Standard added (µg.ml-1) Densitometric method Vincamine Recovery % of added A 1.00 1.50 2.00 97.90 97.40 99.80 Mean ± S.D. 98.36 ± 1.266 A 99.60 99.10 99.59 Mean ± S.D. 99.43 ± 0.285 021554A 100.09 100.68 100.30 ± 0.299
 Densitometric method. Vincamine. Recovery % of added A Mean ± S.D ± A Mean ± S.D ± A ±")
37
Section ( C ) Colorimetric determination of vincamine by using p-chloranilic acid reagent ( ion pair complexation ).
 Colorimetric determination of vincamine by using p-chloranilic acid reagent ( ion pair complexation ).")
38
- The reaction between vincamine and p-chloraanilic acid can be presented as follows:-

39
p-Chloranilic acid ( _ _ _ _ _)
Figure (46): Absorption spectra of Vincamine 20 µg. ml (…….) p-Chloranilic acid ( _ _ _ _ _) Colored product 200 µg. ml (_______).
: Absorption spectra of. Vincamine 20 µg. ml-1 (…….) p-Chloranilic acid ( _ _ _ _ _) Colored product 200 µg. ml-1 (_______).")
40
Figure (49): Effect of volume (ml)of p- chloranilic acid solution on the absorbance of the colored product with vincamine.

41
Figure (50): Determination of the stoichiometry of the reaction of
vincamine with p- chloranilic acid by the continuous variation method.

42
p-chloranilic acid) 75 – 250 μg. ml-1
Figure (47): Absorption spectra of colored product ( vincamine with p-chloranilic acid) 75 – 250 μg. ml-1
: Absorption spectra of colored product ( vincamine with. p-chloranilic acid) 75 – 250 μg. ml-1.")
43
Figure (48): Linearity of the absorbance of the colored product of
vincamine with p-chloranilic acid to the corresponding concentration of vincamine.

44
Oxybral capsules claimed to contain 30 mg
Table (XXXIV): Determination of vincamine in oxybral capsule by the proposed procedures. Oxybral capsules claimed to contain 30 mg Batch number Colorimetric method Compendial method** % Found Recovery % ± S.D.* 012261A 97.00 99.32 ± 0.956 021554A 98.49 98.56 ± 0.857 011345A 100.45 99.21 ± 0.659 * Average of six determinations. **Spectrophotometric method
: Determination of vincamine in oxybral capsule by the proposed procedures. Oxybral capsules claimed to contain 30 mg. Batch number. Colorimetric method. Compendial method** % Found. Recovery % ± S.D.* A ± A ± A ± * Average of six determinations. **Spectrophotometric method.")
45
Table (XXXV): Statistical comparison for the results obtained by the proposed method and the compendial method for the analysis of vincamine in pure powder form. Colorimetric method. Compendial method* vincamine Mean 100.13 99.58 S.D. 1.096 1.011 Variance 1.201 1.022 N 8 6 F test (4.88) Student’s t test (2.179) The figures in parenthesis are the corresponding tabulated values at P=0.05. *Spectrophotometric method
 Student’s t test (2.179) The figures in parenthesis are the corresponding tabulated values at P=0.05. *Spectrophotometric method.")
46
Table (XXXVI): Results of application of standard addition to the determination of vincamine by the proposed method. Batch number Standard added (mg.ml -1) Colorimetric method Vincamine Recovery % of added 012261A 0.50 0.75 1.00 94.60 97.20 97.80 Mean ± S.D. ± 1.700 021554A 96.51 95.44 98.02 Mean ± S.D. 96.65 ± 1.296 011345A 99.52 98.88 99.25 99.22 ± 0.321
 Colorimetric method. Vincamine. Recovery % of added A Mean ± S.D ± A Mean ± S.D ± A ±")
47
Section (D) High performance liquid chromatographic determination of vincamine in presence of its acid degradation product.
 High performance liquid chromatographic determination of vincamine in presence of its acid degradation product.")
48
Rt degradation product: 3.67 min
Final assay conditions of Liquid chromatographic separation of vincamine and its degradation product: Column: RP18 Mobile phase: acetonitrile: 0.01 M ammonium carbonate (70:30 v/v). Flow rate: 1.6 ml. min-1. Detection:U.V.at 280 nm. Rt vincamine: 6.61 min. Rt degradation product: 3.67 min
. Flow rate: 1.6 ml. min-1. Detection:U.V.at 280 nm. Rt vincamine: 6.61 min. Rt degradation product: 3.67 min.")
49
Figure (53): Linearity of the area under the peak to the corresponding
concentration of vincamine.

50
Concentration (µg.ml-1)
Table (XXXVII): Determination of vincamine in laboratory prepared mixtures by the proposed procedures. Concentration (µg.ml-1) Percentage % HPLCmethod Vincamine Degradation product Recovery % 18 2 90% 10% 99.13 16 4 80% 20% 98.45 14 6 70% 30% 100.89 12 8 60% 40% 98.85 10 50% 101.33 100.24 99.76 98.63 99.75 Mean 99.67 S.D. 1.007
: Determination of vincamine in laboratory prepared mixtures by the proposed procedures. Concentration (µg.ml-1) Percentage % HPLCmethod. Vincamine. Degradation product. Recovery % % 10% % 20% % 30% % 40% % Mean S.D")
51
Oxybral capsules claimed to contain 30 mg
Table (XXXVIII): Determination of vincamine in oxybral capsules by the proposed procedures. Oxybral capsules claimed to contain 30 mg Batch number HPLC method Compendial method** % Found Recovery % ± S.D.* A 98.38 99.32 ± 0.956 A 99.36 98.56 ± 0.857 A 100.95 99.21 ± 0.659 * Average of four determinations. **Spectrophotometric method
: Determination of vincamine in oxybral capsules by the proposed procedures. Oxybral capsules claimed to contain 30 mg. Batch number. HPLC method. Compendial method** % Found. Recovery % ± S.D.* A ± A ± A ± * Average of four determinations. **Spectrophotometric method.")
52
Table (XXXIX): Statistical comparison for the results obtained by the proposed method and the compendial method for the analysis of vincamine in pure powder form. HPLC method Compendial method* Vincamine Mean 100.16 99.58 S.D. 1.026 1.011 Variance 1.054 1.022 N 10 6 F test 1.031 (4.77) Student’s t test (2.145) The figures in parenthesis are the corresponding tabulated values at P=0.05. *Spectrophotometric method
 Student’s t test (2.145) The figures in parenthesis are the corresponding tabulated values at P=0.05. *Spectrophotometric method.")
53
Table (XXXX): Results of application of standard addition to the determination of vincamine by the proposed method. Batch number Standard added (mg.ml-1) HPLC method Vincamine Recovery % of added A 0.10 0.15 0.20 99.90 98.40 101.36 Mean ± S.D. 99.89 ± 1.480 A 98.54 101.56 99.79 Mean ± S.D. 99.96 ± 1.517 021554A 97.96 102.32 100.87 100.38± 2.220
 HPLC method. Vincamine. Recovery % of added A Mean ± S.D ± A Mean ± S.D ± A ±")
54
Table (XXXXI ) : Assay parameters and method validation
Derivative ratio spectrophotometric method Densitometric method Colorimetric method HPLC method Vincamine Range (µg/ml) 12-48 3-17(µg/spot) 75 –250 2-20 Slope -0.04 0.324 0.0032 0.3643 Intercept -0.021 0.0958 Mean 99.90 100.09 100.13 100.16 S.D. 1.0413 0.761 1.096 1.026 Variance 1.084 0.579 1.201 1.054 Coff. of variation 1.042 0.760 1.094 1.024 Correl. Coef.(r) 0.9992 0.9998 0.9991 0.9994 * RSD%a 0.183 – 0.233 *RSD %b 0.357 – 0.316 * RSD%a , RSD%b the intraday, interday respectively (n=5) relative standard deviation of concentrations (20-32 µg/ml) for derivative ratio, (9-11µg/spot) for densitometric method, ( 150 – 175 µg/ml) for colourimetric method and (10-14 µg/ml) for HPLC method .
 (µg/spot) 75 – Slope Intercept Mean S.D Variance Coff. of variation Correl. Coef.(r) * RSD%a – *RSD %b – * RSD%a , RSD%b the intraday, interday respectively (n=5) relative standard deviation of concentrations (20-32 µg/ml) for derivative ratio, (9-11µg/spot) for densitometric method, ( 150 – 175 µg/ml) for colourimetric method and (10-14 µg/ml) for HPLC method .")
55
THANK YOU

Similar presentations


 (B) Fig. S1 Characterization of RLs E CM Figure S1. Characterization of RLs. (A) isolated RLs were subjected for hydrolysis.>")
![Conclusions Optimum conditions for derivatization were: methanol as solvent for reagent I, K 3 [Fe(CN) 6 ] 0.02M, DPE 0.05M, methanol: HCl: water 14:1:15.](/14/4366456/big_thumb.jpg "Conclusions Optimum conditions for derivatization were: methanol as solvent for reagent I, K 3 [Fe(CN) 6 ] 0.02M, DPE 0.05M, methanol: HCl: water 14:1:15.>")

 ion. The intensity of the.>")


 is equal to the moles of solute (n) per liter of solution M = n / V = mol / L 2.>")


 476-5454 FAX:>")