Download presentation
Presentation is loading. Please wait.

1
Astronomical images How they are made, what we can learn from them? Modern telescopes all have instruments attached, starting with cameras. Let’s look at some astronomical camera images:

4
How are these images made? Pixels and your camera (we will get to color later…) Pixels: “picture elements”, cen be seen when we zoom in on a digital image. Each pixel represents the light that fell on it. Computers handle this as a number.
 Pixels: picture elements , cen be seen when we zoom in on a digital image. Each pixel represents the light that fell on it. Computers handle this as a number..")
5
A digital, or CCD, camera can be used to measure the light in each pixel If you can’t measure it, it’s not science! The M&M model CCD: Count the M&Ms to measure how much light struck the pixel

6
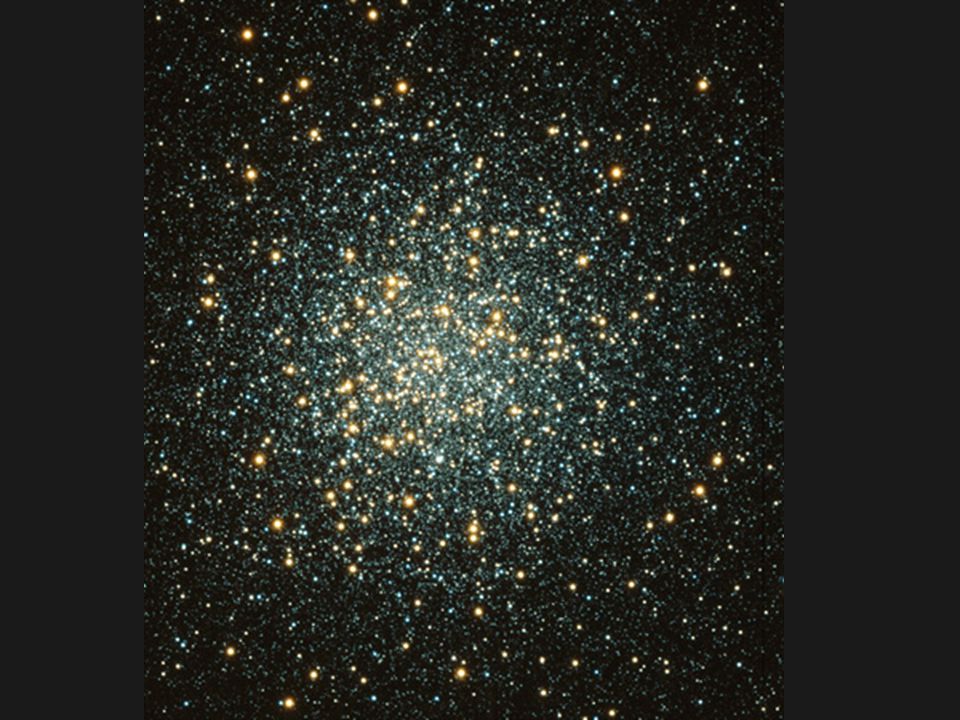
What can we learn from measuring the light in each pixel? Suppose we want to learn about the stars in this “nest” Let’s see how some physics can help understand them

7
Conclusion: If we can measure the brightness of a star in just 2 different colors, we can measure its temperature The sun’s energy, plotted the same way: what’s its temperature? (Can we do this with just a few points?) Two very hot objects, one at 6000 degrees, one at 4000 degrees
 Two very hot objects, one at 6000 degrees, one at 4000 degrees.")
8
Filters: only transmit a narrow range of color So we image stars through different filters to measure their temperature. And we also combine images taken with different filters, and assign colors to each filter to get color pictures:

9
Results for Stars within this cluster: We plot temperature (from different color filters) against brightness *, ( luminosity) for stars within a cluster * Count those M&Ms! From plots like this we can deduce a great deal about these stars.

10
Through this plot of stellar brightness vrs temperature, we have a snapshot of a star’s life cycle Temperature (from color) brightnessbrightness
 brightnessbrightness")
11
A Star’s Life Cycle Our plot of temperature against brightness is called an HR diagram. If we could watch over millions of years, we would see their life cycles as stars change: Stars form in clouds of gas, settle onto the Main Sequence Massive, hottest stars live short lives, explode as supernova Intermediate mass stars like our sun live for billions of years Low mass, coolest stars last even longer than our sun

12
But imaging only tells us part of the story: What’s the wispy material ? What are stars composed of? How fast are bodies moving? How big are they?…

13
There is only so much physics that images taken with filters can tell you about your objects, Which brings us to “spectroscopy” We could say that imaging with filters is a version of spectroscopy, which is a means of studying objects as a function of the details of way the light from it varies with color.

14
Spectroscopy Have you seen the same thing from light off of a music CD or out of a prism

15
But when we look at a star we see Alpha Bootes

16
Looking at something familiar Lights in a parking lot in Tucson: “Neon”, car lights, HP sodium, metal halide

17
Spectral Analysis So the spectra reveal details about the light source. We can use that same approach to study planets, stars, and galaxies. We can deduce the temperature and abundances of various chemical elements in the outer atmosphere of a star. Theorists predicted that when the universe was forming there was little more than H, He, Li, Be, … - the smallest, lightest elements. Observers are confirming that the oldest stars were much like that - more recently formed ones have more “heavy” elements.

18
We can also measure how fast objects are moving towards or away from us, like the VERY distant Quasars shown above; for some stars, we can use the same technique to estimate how fast they are rotating

19
Conclusion: different instruments on telescopes reveal different pieces of the puzzle! (And we haven’t even mentioned how astronomer often use observations taken by satellites in orbit that cover wavelengths of light that cannot be observed from the ground!)
.")
Similar presentations


 sizes of stars.>")

 Temperature (at the surface) Radius Mass.>")


. Basic Properties of Stars.>")

