Download presentation
Presentation is loading. Please wait.

1
Chapter 8 The Sun

2
Guidepost In this chapter, you can use the interaction of light and matter to reveal the secrets of the sun. Because the sun is a typical star, what you are about to learn are the secrets of the stars. This chapter will help you answer three essential questions: What do you see when you look at the sun? How does the sun make its energy? What causes sunspots and other forms of solar activity? The sun will give you a close-up look at a star.

3
Guidepost (continued)
This is the first chapter that applies the methods of science to understand a celestial body. Here you will begin to see how science works in modern astronomy, and you will answer two questions about science: Why do scientists defend some theories so stubbornly? How do scientists confirm and consolidate hypotheses? As you learn about the sun, you are also learning about stars and about science.

4
Outline I. The Solar Atmosphere A. The Photosphere (光球層)
I. The Solar Atmosphere A. The Photosphere (光球層) B. The Chromosphere (色球層) C. The Solar Corona (日冕) D. Helioseismology (日震學) II. Nuclear Fusion in the Sun A. Nuclear Binding Energy B. Hydrogen Fusion C. Energy Transport in the Sun D. The Solar Neutrino (微中子) Problem
 B. The Chromosphere (色球層) C. The Solar Corona (日冕) D. Helioseismology (日震學) II. Nuclear Fusion in the Sun. A. Nuclear Binding Energy. B. Hydrogen Fusion. C. Energy Transport in the Sun. D. The Solar Neutrino (微中子) Problem.")
5
Outline (continued) III. Solar Activity A. Observing the Sun
III. Solar Activity A. Observing the Sun B. Sunspots (太陽黑子) C. The Sun's Magnetic Cycle D. Spots and Magnetic Cycles on Other Stars E. Chromospheric and Coronal Activity F. The Solar Constant
 C. The Sun s Magnetic Cycle. D. Spots and Magnetic Cycles on Other Stars. E. Chromospheric and Coronal Activity. F. The Solar Constant.")
6
General Properties Average star Spectral type G2
Average star Spectral type G2 Only appears so bright because it is so close. Absolute visual magnitude = 4.83 (magnitude if it were at a distance of 32.6 light years) 109 times Earth’s diameter 333,000 times Earth’s mass Consists entirely of gas (av. density = 1.4 g/cm3) Central temperature = 15 million K Surface temperature = 5800 K
 109 times Earth’s diameter. 333,000 times Earth’s mass. Consists entirely of gas (av. density = 1.4 g/cm3) Central temperature = 15 million K. Surface temperature = 5800 K.")
7
Very Important Warning:
Never look directly at the sun through a telescope or binoculars(雙筒望遠鏡)!!! This can cause permanent eye damage – even blindness. Use a projection technique or a special sun viewing filter.
!!! This can cause permanent eye damage – even blindness. Use a projection technique or a special sun viewing filter.")
8
The Solar Atmosphere Only visible during solar eclipses
Only visible during solar eclipses Apparent surface of the sun Heat Flow Temp. incr. inward Solar interior

9
The Photosphere Apparent surface layer of the sun Depth ≈ 500 km
Apparent surface layer of the sun Depth ≈ 500 km Temperature ≈ 5800 oK Highly opaque (H- ions) Absorbs and re-emits radiation produced in the sun The solar corona
 Absorbs and re-emits radiation produced in the sun. The solar corona.")
10
Energy Transport in the Photosphere
Energy generated in the sun’s center must be transported outward. Near the photosphere, this happens through Convection: Cool gas sinking down Bubbles of hot gas rising up ≈ 1000 km Bubbles last for ≈ 10 – 20 min

11
Granulation (米粒組織) … is the visible consequence of convection.
 … is the visible consequence of convection.")
12
Chromospheric structures visible in Ha emission (filtergram)
The Chromosphere Region of sun’s atmosphere just above the photosphere Visible, UV, and X-ray lines from highly ionized gases Temperature increases gradually from ≈ 4500 oK to ≈ 10,000 oK, then jumps to ≈ 1 million oK Filaments Transition region Chromospheric structures visible in Ha emission (filtergram)
")
13
Each one lasting about 5 – 15 min
The Chromosphere (2) Spicules: Filaments of cooler gas from the photosphere, rising up into the chromosphere Visible in Ha emission Each one lasting about 5 – 15 min Spicules: (Latin) a slender pointed usually hard body
 Spicules: Filaments of cooler gas from the photosphere, rising up into the chromosphere. Visible in Ha emission. Each one lasting about 5 – 15 min. Spicules: (Latin) a slender pointed usually hard body.")
14
The Layers of the Solar Atmosphere
Ultraviolet Visible Sun Spot Regions Photosphere Corona Chromosphere Coronal activity, seen in visible light

15
The Magnetic Carpet of the Corona
Corona contains very low-density, very hot (1 million K) gas Coronal gas is heated through motions of magnetic fields anchored in the photosphere below (“magnetic carpet”) Computer model of the magnetic carpet
 gas. Coronal gas is heated through motions of magnetic fields anchored in the photosphere below ( magnetic carpet ) Computer model of the magnetic carpet.")
16
The Solar Wind Constant flow of particles from the sun
Constant flow of particles from the sun Velocity ≈ 300 – 800 km/s Sun is constantly losing mass: 107 tons/year (≈ of its mass per year) Age of the sun ~ 4.5 x 10⁹ year Assume constant mass lost rate Mass lost since born ~ 4.5 x M⊙
 Age of the sun ~ 4.5 x 10⁹ year. Assume constant mass lost rate. Mass lost since born ~ 4.5 x 10⁻⁵ M⊙")
17
Approx. 10 million wave patterns!
Helioseismology The solar interior is opaque (i.e. it absorbs light) out to the photosphere. Only way to investigate solar interior is through Helioseismology = analysis of vibration patterns visible on the solar surface: Approx. 10 million wave patterns! 本系周定一教授是這方面的專家
 out to the photosphere. Only way to investigate solar interior is through Helioseismology. = analysis of vibration patterns visible on the solar surface: Approx. 10 million wave patterns! 本系周定一教授是這方面的專家.")
18
Energy generation in the sun (and all other stars):
Energy Production Energy generation in the sun (and all other stars): Binding energy due to strong force = on short range, strongest of the 4 known forces: electromagnetic, weak, strong, gravitational Nuclear Fusion = fusing together 2 or more lighter nuclei to produce heavier ones. Nuclear fusion (核融合)can produce energy up to the production of iron; For elements heavier than iron, energy is gained by nuclear fission (核分裂).
: Binding energy due to strong force = on short range, strongest of the 4 known forces: electromagnetic, weak, strong, gravitational. Nuclear Fusion. = fusing together 2 or more lighter nuclei to produce heavier ones. Nuclear fusion (核融合)can produce energy up to the production of iron; For elements heavier than iron, energy is gained by nuclear fission (核分裂).")
19
Energy Generation in the Sun: The Proton-Proton Chain (p-p chain)
Basic reaction: 4 1H 4He + energy Need large proton speed ( high temperature) to overcome Coulomb barrier (electrostatic repulsion between protons) 4 protons have 0.048*10-27 kg (= 0.7 %) more mass than 4He. T ≥ 107 K = 10 million K Energy gain = Dm*c2 = 0.43*10-11 J per reaction Sun needs 1038 reactions, transforming 5 million tons of mass into energy every second, to resist its own gravity.
 to overcome Coulomb barrier (electrostatic repulsion between protons) 4 protons have 0.048*10-27 kg (= 0.7 %) more mass than 4He. T ≥ 107 K = 10 million K. Energy gain = Dm*c2. = 0.43*10-11 J. per reaction. Sun needs 1038 reactions, transforming 5 million tons of mass into energy every second, to resist its own gravity.")
20
Energy Transport in the Sun
g-rays Radiative energy transport

21
The Solar Neutrino Problem
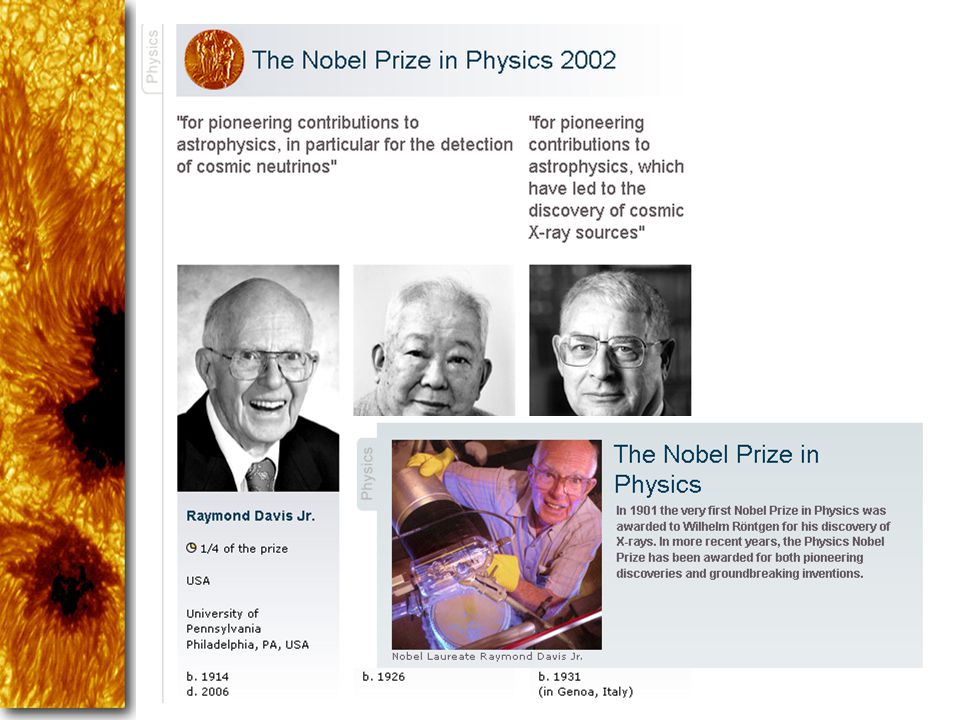
The solar interior can not be observed directly because it is highly opaque to radiation. But, neutrinos can penetrate huge amounts of material without being absorbed. Early solar neutrino experiments detected a much lower flux of neutrinos than expected ( the “solar neutrino problem”). Recent results have proven that neutrinos change (“oscillate”) between different types (“flavors”), thus solving the solar neutrino problem. Davis solar neutrino experiment
. Recent results have proven that neutrinos change ( oscillate ) between different types ( flavors ), thus solving the solar neutrino problem. Davis solar neutrino experiment.")
23
Cooler regions of the photosphere (T ≈ 4240 K)
Sun Spots Cooler regions of the photosphere (T ≈ 4240 K) Only appear dark against the bright sun; would still be brighter than the full moon when placed on the night sky!
 Only appear dark against the bright sun; would still be brighter than the full moon when placed on the night sky!")
24
Sun Spots (2) Active Regions Visible Ultraviolet
 Active Regions Visible Ultraviolet")
25
The Active Sun Solar Activity, seen in soft X-rays

26
Magnetic Fields in Sun Spots
Magnetic fields on the photosphere can be measured through the Zeeman effect Sun Spots are related to magnetic activity on the photosphere

27
Sun Spots (3) Magnetic field in sun spots is about 1000 times stronger than average. Magnetic North Poles Magnetic South Poles In sun spots, magnetic field lines emerge out of the photosphere.

28
Magnetic Field Lines Magnetic North Pole Magnetic South Pole
Magnetic North Pole Magnetic South Pole Magnetic Field Lines

29
Magnetic Field Lines Hot gas ejected from the sun often follows magnetic field lines and traces out the loop structure of the magnetic field.

30
The Solar Cycle => Total solar cycle = 22 years
After 11 years, North/South order of leading/trailing sun spots is reversed 11-year cycle Reversal of magnetic polarity => Total solar cycle = 22 years

31
Maunder Butterfly Diagram
The Solar Cycle (2) Maunder Butterfly Diagram Sun spot cycle starts out with spots at higher latitudes on the sun. Evolve to lower latitudes (towards the equator) throughout the cycle
 Maunder Butterfly Diagram. Sun spot cycle starts out with spots at higher latitudes on the sun. Evolve to lower latitudes (towards the equator) throughout the cycle.")
32
The sun spot number also fluctuates on much longer time scales:
The Maunder Minimum The sun spot number also fluctuates on much longer time scales: Historical data indicate a very quiet phase of the sun, ~ 1650 – 1700: The Maunder Minimum

33
The Sun’s Magnetic Dynamo
The sun rotates faster at the equator than near the poles. This differential rotation might be responsible for magnetic activity of the sun.

34
Magnetic Loops Magnetic field lines

35
The Sun’s Magnetic Cycle
After 11 years, the magnetic field pattern becomes so complex that the field structure is re-arranged. New magnetic field structure is similar to the original one, but reversed! New 11-year cycle starts with reversed magnetic-field orientation

36
Image constructed from changing Doppler shift measurements
Star Spots? Other stars might also have sun spot activity: Image constructed from changing Doppler shift measurements

37
Magnetic Cycles on Other Stars
line emission of ionized Calcium indicate magnetic activity also on other stars. Calcium flux Calcium flux

38
Relatively cool gas (60,000 – 80,000 K)
Prominences Relatively cool gas (60,000 – 80,000 K) May be seen as dark filaments against the bright background of the photosphere Looped Prominences: gas ejected from the sun’s photosphere, flowing along magnetic loops
 May be seen as dark filaments against the bright background of the photosphere. Looped Prominences: gas ejected from the sun’s photosphere, flowing along magnetic loops.")
39
Eruptive Prominences (Ultraviolet images)
(Ultraviolet images) Extreme events (solar flares) can significantly influence Earth’s magnetic field structure and cause northern lights (aurora borealis).
 Extreme events (solar flares) can significantly influence Earth’s magnetic field structure and cause northern lights (aurora borealis).")
40
Coronal mass ejections
Space Weather ~ 5 minutes Aurora Borealis (= Aurora) Sound waves produced by a solar flare Coronal mass ejections
 Sound waves produced by a solar flare. Coronal mass ejections.")
41
Coronal Holes X-ray images of the sun reveal coronal holes.
X-ray images of the sun reveal coronal holes. These arise at the foot points of open field lines and are the origin of the solar wind.

42
The energy we receive from the sun is essential for all life on Earth.
The Solar Constant The energy we receive from the sun is essential for all life on Earth. The amount of energy we receive from the sun can be expressed as the Solar Constant: Energy Flux F = 1360 J/m2/s F = Energy Flux = = Energy received in the form of radiation, per unit time and per unit surface area [J/s/m2]

Similar presentations

>")


>")

>")
: 8 Learning Outcomes:>")


 Central.>")


