Download presentation
Presentation is loading. Please wait.

2
2 THE ECONOMIC PROBLEM Notes and teaching tips: 5, 6, 21, 37, 41, and 58. To view a full-screen figure during a class, click the red “expand” button. To return to the previous slide, click the red “shrink” button. To advance to the next slide, click anywhere on the full screen figure.

4
Production Possibilities and Opportunity Cost
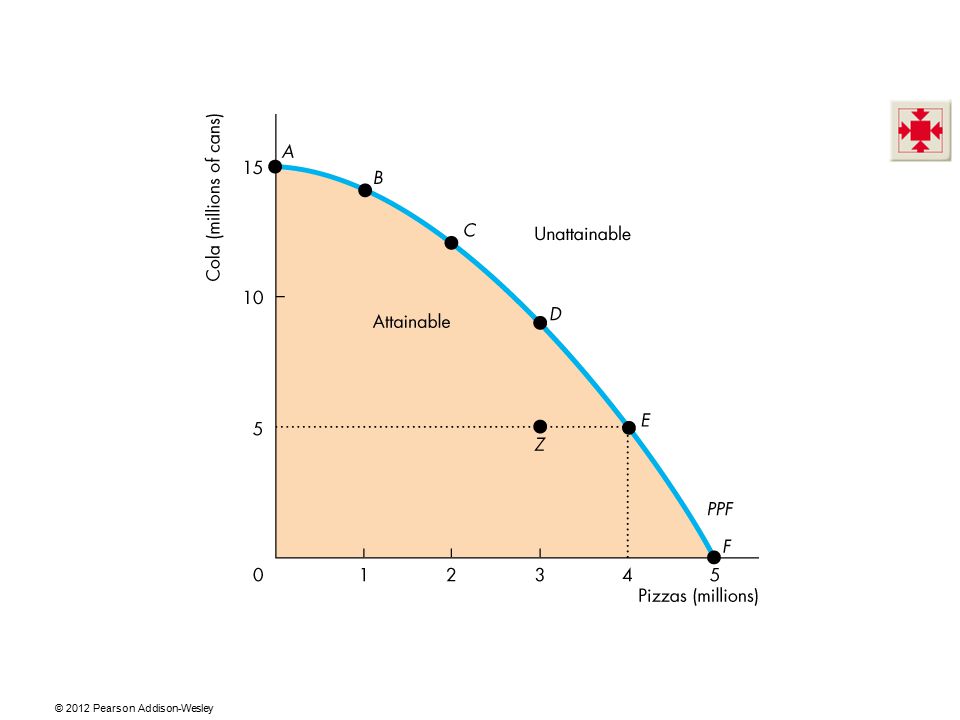
The production possibilities frontier (PPF) is the boundary between those combinations of goods and services that can be produced and those that cannot. To illustrate the PPF, we focus on two goods at a time and hold the quantities of all other goods and services constant. That is, we look at a model economy in which everything remains the same (ceteris paribus) except the two goods we’re considering. The production possibility frontier (PPF) is the first economic model the students see. Your first challenge it to ensure that the students understand the mechanics of the model. You can provide some help in the classroom but you main goal must be to get the student working—to develop good work habits. Encourage them to work the end-of-chapter problems, study guide questions, and to work the Practice Problems in MyEconLab so that they are comfortable with the mechanics of this chapter.
 is the boundary between those combinations of goods and services that can be produced and those that cannot. To illustrate the PPF, we focus on two goods at a time and hold the quantities of all other goods and services constant. That is, we look at a model economy in which everything remains the same (ceteris paribus) except the two goods we’re considering. The production possibility frontier (PPF) is the first economic model the students see. Your first challenge it to ensure that the students understand the mechanics of the model. You can provide some help in the classroom but you main goal must be to get the student working—to develop good work habits. Encourage them to work the end-of-chapter problems, study guide questions, and to work the Practice Problems in MyEconLab so that they are comfortable with the mechanics of this chapter.")
5
Production Possibilities and Opportunity Cost
Production Possibilities Frontier Figure 2.1 shows the PPF for two goods: cola and pizzas. Your second challenge is to help the students begin to use the PPF model and to start thinking like economists. Thinking about everyday events in terms of graphs and tables of numbers is hard for most students. You can help them to appreciate economic modes in general and the PPF model in particular by using the model to describe the tradeoff between studying and a social life faced every day by each student. Why do some of the brightest students not get a 4.0 GPA? After sleeping, attending classes, and performing the mundane tasks of life, a student has 8 hours a day available for study and recreation. If the student spends all 8 hours studying, he/she will get a 4.0 GPA. But each hour of recreation lowers the GPA. The Economics of Campus Life 101. First, assume a constant opportunity cost of recreation equal to a drop in the GPA for each hour spent not studying. The highest GPA possible is 4.0, the lowest is 1.333, and the negatively sloped PPF curve is a straight line. Ask the students to draw the graph based on your description. Help them to interpret the PPF graph: the intercept points reveal the maximum GPA and the maximum recreation hours possible, and the negative slope quantifies the tradeoff the student faces. Points on the curve represent production efficiency and points inside the curve represent a misallocation of the student’s time where opportunities for increases in recreation and/or GPA points are wasted. Then show that the opportunity cost of each additional hour of recreation (lost GPA points) is constant. Ask the students why.
 is constant. Ask the students why.")
7
Production Possibilities and Opportunity Cost
Any point on the frontier such as E and any point inside the PPF such as Z are attainable. Points outside the PPF are unattainable.

8
Production Possibilities and Opportunity Cost
Production Efficiency We achieve production efficiency if we cannot produce more of one good without producing less of some other good. Points on the frontier are efficient.

10
Production Possibilities and Opportunity Cost
Any point inside the frontier, such as Z, is inefficient. At such a point, it is possible to produce more of one good without producing less of the other good. At Z, resources are either unemployed or misallocated.

11
Production Possibilities and Opportunity Cost
Tradeoff Along the PPF Every choice along the PPF involves a tradeoff. On this PPF, we must give up some cola to get more pizzas or give up some pizzas to get more cola.

12
Production Possibilities and Opportunity Cost
As we move down along the PPF, we produce more pizzas, but the quantity of cola we can produce decreases. The opportunity cost of a pizza is the cola forgone.

13
Production Possibilities and Opportunity Cost
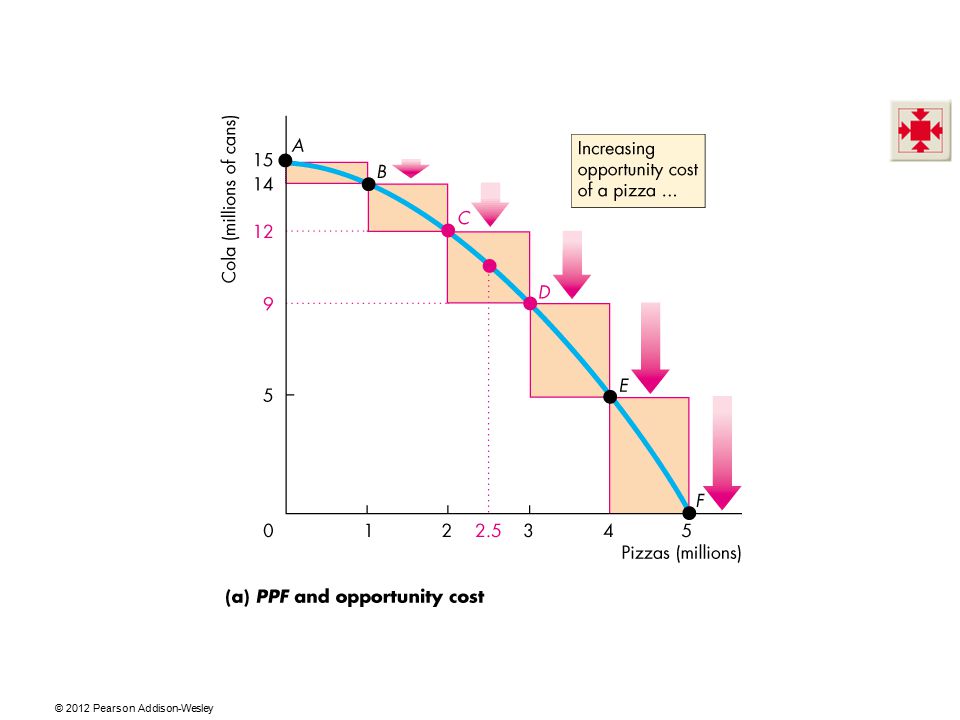
In moving from E to F: The quantity of pizzas increases by 1 million. The quantity of cola decreases by 5 million cans. The opportunity cost of the fifth 1 million pizzas is 5 million cans of cola. One of these pizzas costs 5 cans of cola.

14
Production Possibilities and Opportunity Cost
In moving from F to E: The quantity of cola increases by 5 million cans. The quantity of pizzas decreases by 1 million. The opportunity cost of the first 5 million cans of cola is 1 million pizzas. One of these cans of cola costs 1/5 of a pizza.

15
Production Possibilities and Opportunity Cost
Opportunity Cost Is a Ratio Note that the opportunity cost of a can of cola is the inverse of the opportunity cost of a pizza. One pizza costs 5 cans of cola. One can of cola costs 1/5 of a pizza.

16
Production Possibilities and Opportunity Cost
Increasing Opportunity Cost Because resources are not equally productive in all activities, the PPF bows outward. The outward bow of the PPF means that as the quantity produced of each good increases, so does its opportunity cost.

17
Using Resources Efficiently
All the points along the PPF are efficient. To determine which of the alternative efficient quantities to produce, we compare costs and benefits. The PPF and Marginal Cost The PPF determines opportunity cost. The marginal cost of a good or service is the opportunity cost of producing one more unit of it.

18
Using Resources Efficiently
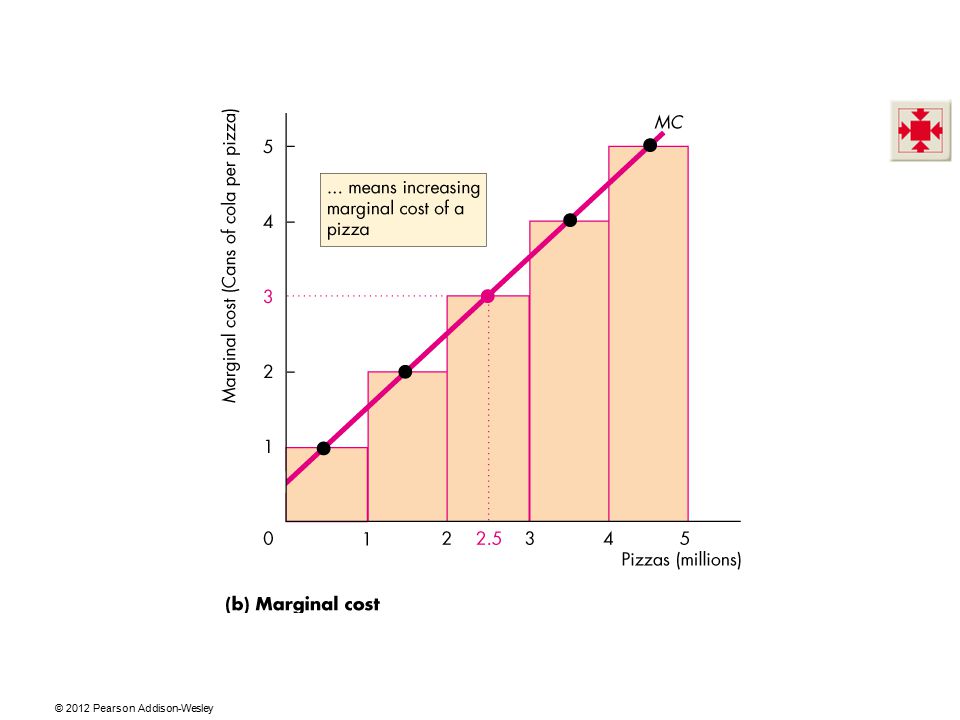
Figure 2.2 illustrates the marginal cost of a pizza. As we move along the PPF, the opportunity cost of a pizza increases. The opportunity cost of producing one more pizza is the marginal cost of a pizza.

20
Using Resources Efficiently
In part (b) of Fig. 2.2, the bars illustrate the increasing opportunity cost of a pizza. The black dots and the line MC show the marginal cost of producing a pizza. Students always wonder why MC passes through the middle point of the bars. The height of each bar shows the cost of an average pizza in each of the 1 million pizza blocks. Focus on the 3rd 1 million pizzas. The opportunity cost of producing that 1 million pizzas is 3 million CDs. So in this range, the cost of an average pizza is 3 CDs. The dot indicates that 3CDs is the cost of the average pizza, which over this range is the 2.5 millionth pizza. The MC curve passes through the center of each bar.
 of Fig. 2.2, the bars illustrate the increasing opportunity cost of a pizza. The black dots and the line MC show the marginal cost of producing a pizza. Students always wonder why MC passes through the middle point of the bars. The height of each bar shows the cost of an average pizza in each of the 1 million pizza blocks. Focus on the 3rd 1 million pizzas. The opportunity cost of producing that 1 million pizzas is 3 million CDs. So in this range, the cost of an average pizza is 3 CDs. The dot indicates that 3CDs is the cost of the average pizza, which over this range is the 2.5 millionth pizza. The MC curve passes through the center of each bar.")
22
Using Resources Efficiently
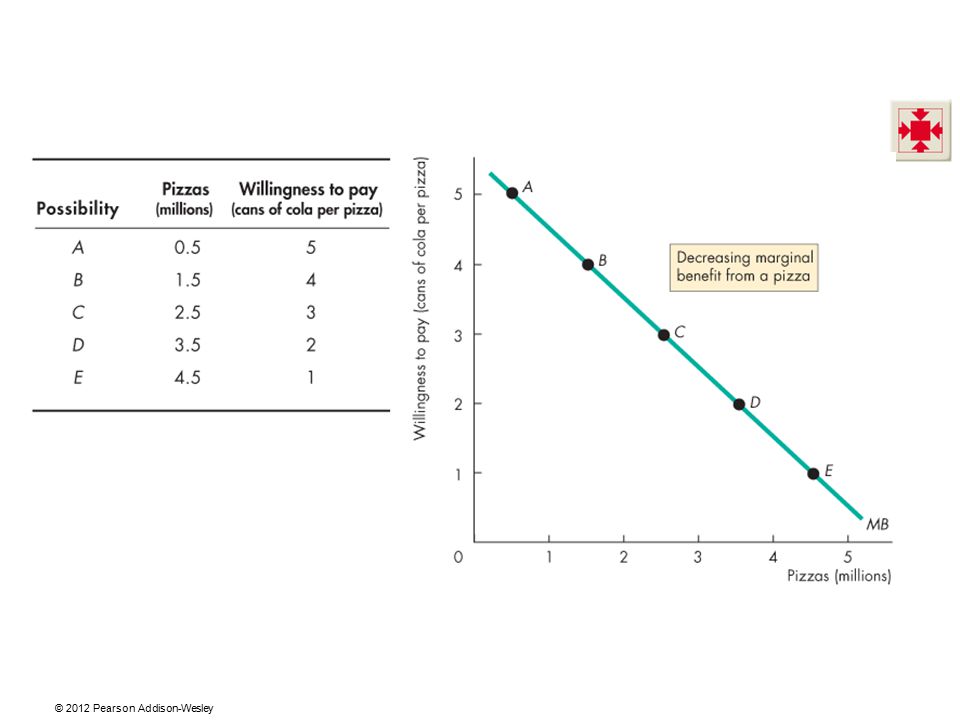
Preferences and Marginal Benefit Preferences are a description of a person’s likes and dislikes. To describe preferences, economists use the concepts of marginal benefit and the marginal benefit curve. The marginal benefit of a good or service is the benefit received from consuming one more unit of it. We measure marginal benefit by the amount that a person is willing to pay for an additional unit of a good or service.

23
Using Resources Efficiently
It is a general principle that: The more we have of any good, the smaller is its marginal benefit and … the less we are willing to pay for an additional unit of it. We call this general principle the principle of decreasing marginal benefit. The marginal benefit curve shows the relationship between the marginal benefit of a good and the quantity of that good consumed.

24
Using Resources Efficiently
At point A, with 0.5 million pizzas available, people are willing to pay 5 cans of cola for a pizza. .

26
Using Resources Efficiently
At point B, with pizza 1.5 million pizzas available, people are willing to pay 4 cans of cola for a pizza

27
Using Resources Efficiently
At point E, with pizza 4.5 million pizzas available, people are willing to pay 1 can of cola for a pizza.

28
Using Resources Efficiently
The line through the points shows the marginal benefit from a pizza.

29
Using Resources Efficiently
Allocative Efficiency When we cannot produce more of any one good without giving up some other good, we have achieved production efficiency. We are producing at a point on the PPF. When we cannot produce more of any one good without giving up some other good that we value more highly, we have achieved allocative efficiency. We are producing at the point on the PPF that we prefer above all other points.

30
Using Resources Efficiently
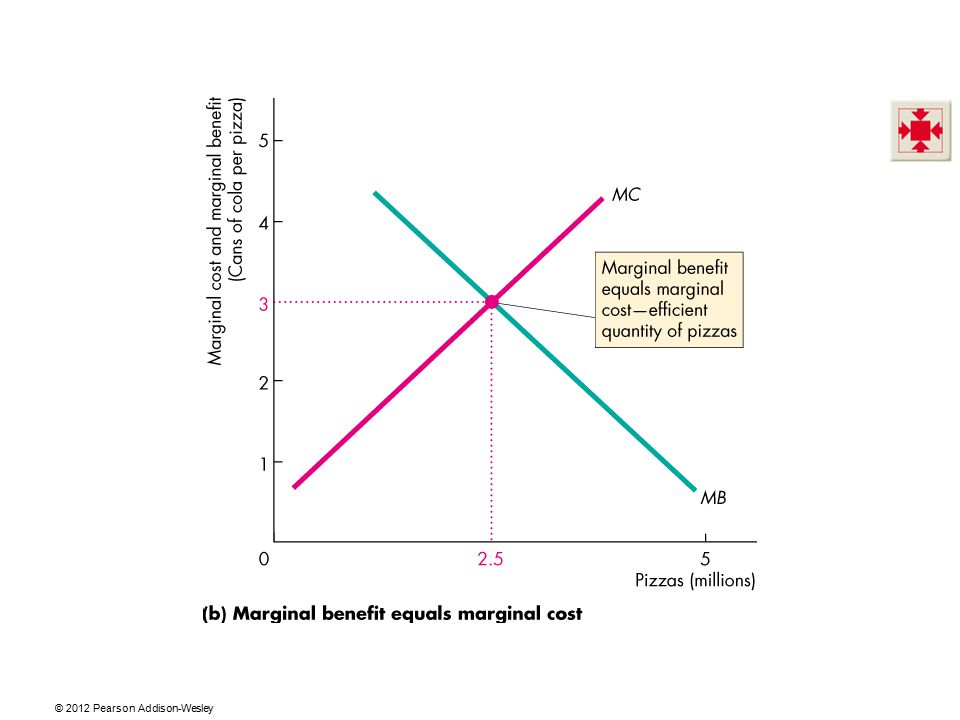
Figure 2.4 illustrates allocative efficiency. The point of allocative efficiency is the point on the PPF at which marginal benefit equals marginal cost. This point is determined by the quantity at which the marginal benefit curve intersects the marginal cost curve.

32
Using Resources Efficiently
If we produce fewer than 2.5 million pizzas, marginal benefit exceeds marginal cost. We get more value from our resources by producing more pizzas. On the PPF at point A, we are producing too few pizzas. We are better off moving along the PPF to produce more pizzas.

33
Using Resources Efficiently
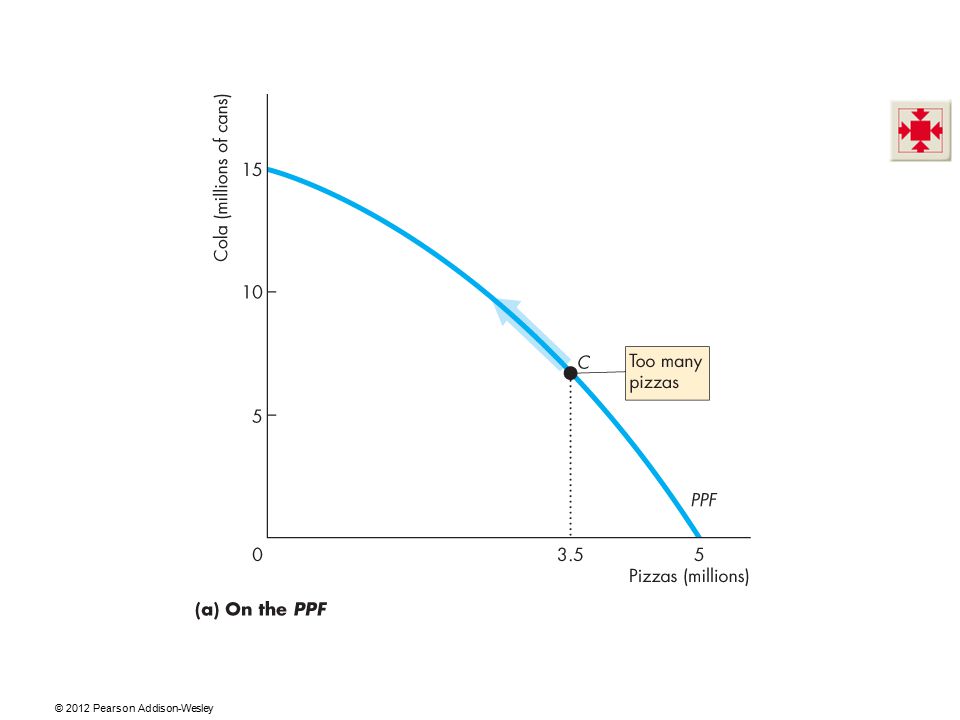
If we produce more than 2.5 million pizzas, marginal cost exceeds marginal benefit. We get more value from our resources by producing fewer pizzas. On the PPF at point C, we are producing too many pizzas. We are better off moving along the PPF to produce fewer pizzas.

34
Using Resources Efficiently
On the PPF at point B, we are producing the efficient quantities of pizzas and cola. If we produce exactly 2.5 million pizzas, marginal cost equals marginal benefit. We cannot get more value from our resources.

36
Economic Growth The expansion of production possibilities—and increase in the standard of living—is called economic growth. Two key factors influence economic growth: Technological change Capital accumulation Technological change is the development of new goods and of better ways of producing goods and services. Capital accumulation is the growth of capital resources, which includes human capital. You can have some fun and generate some discussion by getting the students to think about what life might be like after another 200 years of economic growth. Provide some numbers: In 2006, income per person in the United States was about $100 a day. In 1806 it was about 70¢ a day, and if the past growth rate prevails for another 200 years, in 2206 it will be $14,000 a day. Emphasize the magic of compound growth. If they think that $14,000 a day is a big income, get them to do a ballpark estimate of the daily income of Bill Gates (about $20 million!) Encourage a discussion of why scarcity is still present even at these large incomes. Be sure to cover the “Standard of Living Tradeoff” idea that the students met in Chapter 1 and that they can now think about with the more powerful tool of the PPF. If you wish, connect the discussion of efficiency with that of growth. Ask the students to explain what determines the efficient growth rate (not in text).
 Encourage a discussion of why scarcity is still present even at these large incomes. Be sure to cover the Standard of Living Tradeoff idea that the students met in Chapter 1 and that they can now think about with the more powerful tool of the PPF. If you wish, connect the discussion of efficiency with that of growth. Ask the students to explain what determines the efficient growth rate (not in text).")
37
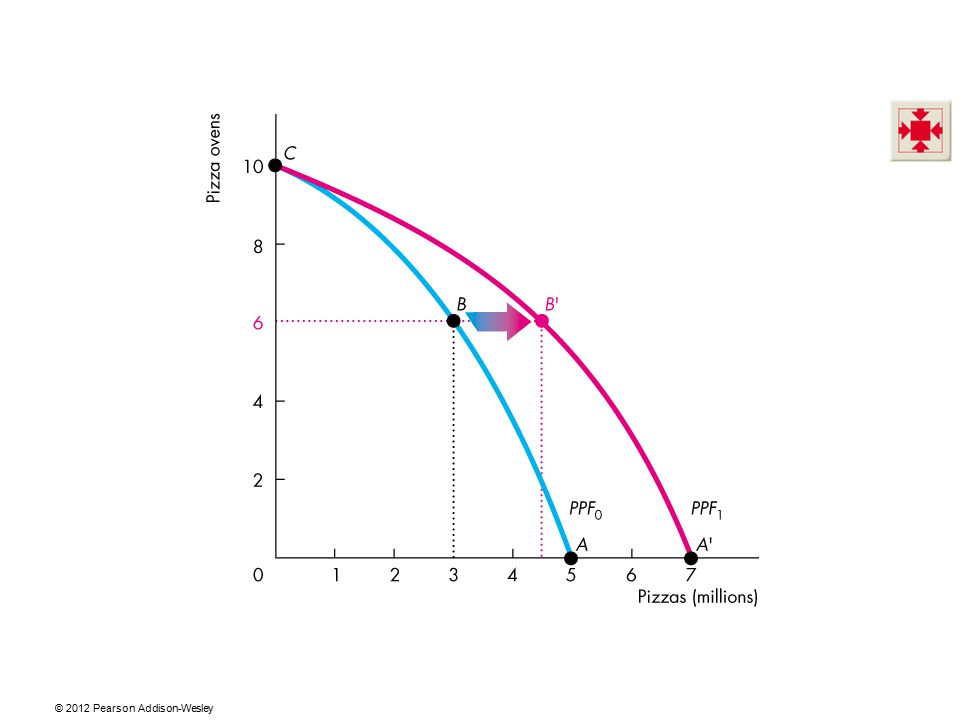
Economic Growth The Cost of Economic Growth To use resources in research and development and to produce new capital, we must decrease our production of consumption goods and services. So economic growth is not free. The opportunity cost of economic growth is less current consumption.

38
Economic Growth Figure 2.5 illustrates the tradeoff we face. We can produce pizzas or pizza ovens along PPF0. By using some resources to produce pizza ovens today, the PPF shifts outward in the future.

40
Gains from Trade Comparative Advantage and Absolute Advantage
A person has a comparative advantage in an activity if that person can perform the activity at a lower opportunity cost than anyone else. A person has an absolute advantage if that person is more productive than others. Let’s look at Liz and Joe who operate smoothie bars. The gain from trade is a real eye-opener for students. Their first reaction is one of skepticism. Convincing students of the power of trade to raise living standards and the costs of trade restriction is one of the most productive things we will ever do. Here are some ideas to drive home the idea of comparative advantage: Why didn’t Billy Sunday do his own typing? Billy Sunday, an evangelist in the 1930s, was reputed to be the world’s fastest typist. Nonetheless, he employed a secretary who was a slower typist than he. Why? Because in one hour of preaching, Billy could raise several times the revenue that he could raise by typing for an hour. So Billy plays to his comparative advantage. Why doesn’t Martha Stewart bake her own bread? Martha Stewart is probably a better cook than most people, but she is an even better writer and TV performer on the subject of food. So Martha plays to her comparative advantage and writes about baking bread but buys her bread. Why doesn’t Vinnie Jones play soccer? Vinnie Jones is one of the world’s best soccer players (although now getting a bit old). But he stopped playing soccer and started making movies some years ago. Why? Because, as he once said, “You go to the bank more often when you’re in movies.” Vinnie’s comparative advantage turned out to be in acting. The costs of trade restrictions need to be driven home. The 2002 steel tariff increase and the EU response is a good story to use.
. But he stopped playing soccer and started making movies some years ago. Why Because, as he once said, You go to the bank more often when you’re in movies. Vinnie’s comparative advantage turned out to be in acting. The costs of trade restrictions need to be driven home. The 2002 steel tariff increase and the EU response is a good story to use.")
41
Gains from Trade Liz's Smoothie Bar
In an hour, Liz can produce 30 smoothies or 30 salads. Liz's opportunity cost of producing 1 smoothie is 1 salad. Liz's opportunity cost of producing 1 salad is 1 smoothie. Liz’s customers buy salads and smoothies in equal number, so she produces 15 smoothies and 15 salads an hour.

42
Gains from Trade Joe's Smoothie Bar
In an hour, Joe can produce 6 smoothies or 30 salads. Joe's opportunity cost of producing 1 smoothie is 5 salads. Joe's opportunity cost of producing 1 salad is 1/5 smoothie. Joe’s spend 10 minutes making salads and 50 minutes making smoothies, so he produces 5 smoothies and 5 salads an hour.

43
Gains from Trade Liz’s Comparative Advantage
Liz’s opportunity cost of a smoothie is 1 salad. Joe’s opportunity cost of a smoothie is 5 salads. Liz’s opportunity cost of a smoothie is less than Joe’s. So Liz has a comparative advantage in producing smoothies.

44
Gains from Trade Joe’s Comparative Advantage
Joe’s opportunity cost of a salad is 1/5 smoothie. Liz’s opportunity cost of a salad is 1 smoothie. Joe’s opportunity cost of a salad is less than Liz’s. So Joe has a comparative advantage in producing salads.

45
Gains from Trade Achieving the Gains from Trade
Liz and Joe produce the good in which they have a comparative advantage: Liz produces 30 smoothies and 0 salads. Joe produces 30 salads and 0 smoothies.

47
Gains from Trade Liz and Joe trade:
Liz sells Joe 10 smoothies and buys 20 salads. Joe sells Liz 20 salads and buys 10 smoothies. After trade: Liz has 20 smoothies and 10 salads. Joe has 20 smoothies and 10 salads.

48
Gains from Trade Gains from trade:
Liz gains 5 smoothies and 5 salads an hour Joe gains 5 smoothies and 5 salads an hour

49
Gains from Trade Figure 2.6 shows the gains from trade.
Joe initially produces at point A on his PPF. Liz initially produces at point A on her PPF.

51
Gains from Trade Joe’s opportunity cost of producing a salad is less than Liz’s. So Joe has a comparative advantage in producing salad.

52
Gains from Trade Liz’s opportunity cost of producing a smoothie is less than Joe’s. So Liz has a comparative advantage in producing smoothies.

53
Gains from Trade Joe specializes in producing salad and he produces 30 salads an hour at point B on his PPF.

54
Gains from Trade Liz specializes in producing smoothies and produces 30 smoothies an hour at point B on her PPF.

55
Gains from Trade They trade salads for smoothies along the red “Trade line.” The price of a salad is 2 smoothies or the price of a smoothie is ½ of a salad.

56
Gains from Trade Joe buys smoothies from Liz and moves to point C—a point outside his PPF. Liz buys salads from Joe and moves to point C—a point outside her PPF.

57
Economic Coordination
To reap the gains from trade, the choices of individuals must be coordinated. To make coordination work, four complimentary social institutions have evolved over the centuries: Firms Markets Property rights Money The point of this short section is to lay the groundwork for the next chapter on demand and supply. You can cover it fast or you can use it as a peg on which to hang a discussion of some of the big-picture of the underpinnings of our subject. Some examples follow: The “Invisible Hand”: How self-interested individuals promote prosperity for all. Explain that in economics, we take human nature as given (in contrast to political science, philosophy and some other fields) and assume that people are self-interested. Note if you wish that self-interest does not mean selfish. If everyone is self-interested, how are people encouraged to specialize and exchange to promote prosperity for all? Building on the Tom and Nancy example in the chapter, you can explain how specialization and exchange achieves a higher standard of living that does self sufficiency. So self interest promotes specialization and exchange. But for specialization and exchange to work, people must be able to trade. That is why property rights and markets are so crucial. Property Rights and Markets: The key to promoting socially beneficial activity. To reap the gains from specialization, people need access to markets in which voluntary exchange can take place. Markets work only if property rights are established and enforced.
 and assume that people are self-interested. Note if you wish that self-interest does not mean selfish. If everyone is self-interested, how are people encouraged to specialize and exchange to promote prosperity for all Building on the Tom and Nancy example in the chapter, you can explain how specialization and exchange achieves a higher standard of living that does self sufficiency. So self interest promotes specialization and exchange. But for specialization and exchange to work, people must be able to trade. That is why property rights and markets are so crucial. Property Rights and Markets: The key to promoting socially beneficial activity. To reap the gains from specialization, people need access to markets in which voluntary exchange can take place. Markets work only if property rights are established and enforced.")
58
Economic Coordination
A firm is an economic unit that hires factors of production and organizes those factors to produce and sell goods and services. A market is any arrangement that enables buyers and sellers to get information and do business with each other. Property rights are the social arrangements that govern ownership, use, and disposal of resources, goods or services. Money is any commodity or token that is generally acceptable as a means of payment.

59
Economic Coordination
Circular Flows Through Markets Figure 2.7 illustrates how households and firms interact in the market economy. Factors of production, goods and services flow in one direction. Money flows in the opposite direction.

61
Economic Coordination
Coordinating Decisions Markets coordinate individual decisions through price adjustments.

Similar presentations