Download presentation
Presentation is loading. Please wait.

1
ISSUES TO ADDRESS... How do flaws in a material initiate failure? How is fracture resistance quantified; how do different material classes compare? How do we estimate the stress to fracture? How do loading rate, loading history, and temperature affect the failure stress? Ship-cyclic loading from waves. Computer chip-cyclic thermal loading. Hip implant-cyclic loading from walking. Adapted from Fig. 22.30(b), Callister 7e. (Fig. 22.30(b) is courtesy of National Semiconductor Corporation.) Adapted from Fig. 22.26(b), Callister 7e. Chapter 8: Mechanical Failure & Failure Analysis Adapted from chapter-opening photograph, Chapter 8, Callister 7e. (by Neil Boenzi, The New York Times.)
, Callister 7e. (Fig (b) is courtesy of National Semiconductor Corporation.) Adapted from Fig (b), Callister 7e. Chapter 8: Mechanical Failure & Failure Analysis Adapted from chapter-opening photograph, Chapter 8, Callister 7e. (by Neil Boenzi, The New York Times.).")
2
Fracture mechanisms Ductile fracture –Occurs with plastic deformation Brittle fracture –Occurs with Little or no plastic deformation –Thus they are Catastrophic meaning they occur without warning!

3
Ductile vs Brittle Failure Very Ductile Moderately Ductile Brittle Fracture behavior: LargeModerate%Ra or %El Small Ductile fracture is nearly always desirable! Ductile: warning before fracture Brittle: No warning

4
Ductile failure: --one piece --large deformation Figures from V.J. Colangelo and F.A. Heiser, Analysis of Metallurgical Failures (2nd ed.), Fig. 4.1(a) and (b), p. 66 John Wiley and Sons, Inc., 1987. Used with permission. Example: Failure of a Pipe Brittle failure: --many pieces --small deformation
, Fig. 4.1(a) and (b), p. 66 John Wiley and Sons, Inc., Used with permission. Example: Failure of a Pipe Brittle failure: --many pieces --small deformation.")
5
Evolution to failure: Resulting fracture surfaces (steel) 50 mm Inclusion particles serve as void nucleation sites. 50 mm From V.J. Colangelo and F.A. Heiser, Analysis of Metallurgical Failures (2nd ed.), Fig. 11.28, p. 294, John Wiley and Sons, Inc., 1987. (Orig. source: P. Thornton, J. Mater. Sci., Vol. 6, 1971, pp. 347-56.) 100 mm Fracture surface of tire cord wire loaded in tension. Courtesy of F. Roehrig, CC Technologies, Dublin, OH. Used with permission. Moderately Ductile Failure necking void nucleation void growth and linkage shearing at surface fracture
, Fig , p. 294, John Wiley and Sons, Inc., (Orig. source: P. Thornton, J. Mater. Sci., Vol. 6, 1971, pp ) 100 mm Fracture surface of tire cord wire loaded in tension. Courtesy of F. Roehrig, CC Technologies, Dublin, OH. Used with permission. Moderately Ductile Failure necking void nucleation void growth and linkage shearing at surface fracture.")
6
Ductile vs. Brittle Failure Adapted from Fig. 8.3, Callister 7e. cup-and-cone fracturebrittle fracture

7
Brittle Failure Arrows indicate point at which failure originated Adapted from Fig. 8.5(a), Callister 7e.
, Callister 7e..")
8
Intergranular (between grains) Intragranular (within grains) Al Oxide (ceramic) Reprinted w/ permission from "Failure Analysis of Brittle Materials", p. 78. Copyright 1990, The American Ceramic Society, Westerville, OH. (Micrograph by R.M. Gruver and H. Kirchner.) 316 S. Steel (metal) Reprinted w/ permission from "Metals Handbook", 9th ed, Fig. 650, p. 357. Copyright 1985, ASM International, Materials Park, OH. (Micrograph by D.R. Diercks, Argonne National Lab.) 304 S. Steel (metal) Reprinted w/permission from "Metals Handbook", 9th ed, Fig. 633, p. 650. Copyright 1985, ASM International, Materials Park, OH. (Micrograph by J.R. Keiser and A.R. Olsen, Oak Ridge National Lab.) Polypropylene (polymer) Reprinted w/ permission from R.W. Hertzberg, "Deformation and Fracture Mechanics of Engineering Materials", (4th ed.) Fig. 7.35(d), p. 303, John Wiley and Sons, Inc., 1996. 3 mm 4 mm 160 mm 1 mm (Orig. source: K. Friedrick, Fracture 1977, Vol. 3, ICF4, Waterloo, CA, 1977, p. 1119.) Brittle Fracture Surfaces: Useful to examine to determine causes of failure
 316 S. Steel (metal) Reprinted w/ permission from Metals Handbook , 9th ed, Fig. 650, p Copyright 1985, ASM International, Materials Park, OH. (Micrograph by D.R. Diercks, Argonne National Lab.) 304 S. Steel (metal) Reprinted w/permission from Metals Handbook , 9th ed, Fig. 633, p Copyright 1985, ASM International, Materials Park, OH. (Micrograph by J.R. Keiser and A.R. Olsen, Oak Ridge National Lab.) Polypropylene (polymer) Reprinted w/ permission from R.W. Hertzberg, Deformation and Fracture Mechanics of Engineering Materials , (4th ed.) Fig. 7.35(d), p. 303, John Wiley and Sons, Inc., mm 4 mm 160 mm 1 mm (Orig. source: K. Friedrick, Fracture 1977, Vol. 3, ICF4, Waterloo, CA, 1977, p ) Brittle Fracture Surfaces: Useful to examine to determine causes of failure.")
10
Failure Analysis – Failure Avoidance Most failure occur due to the presence of defects in materials –Cracks or Flaws (stress concentrators) – Voids or inclusions Presence of defects is best found before hand and they should be determined non-destructively –X-Ray analysis –Ultra-Sonic Inspection –Surface inspection Magna-flux Dye Penetrant
 – Voids or inclusions Presence of defects is best found before hand and they should be determined non-destructively –X-Ray analysis –Ultra-Sonic Inspection –Surface inspection Magna-flux Dye Penetrant")
11
Stress-strain behavior (Room Temp): Ideal vs Real Materials TS << TS engineering materials perfect materials E/10 E/100 0.1 perfect mat’l-no flaws carefully produced glass fiber typical ceramic typical strengthened metal typical polymer DaVinci (500 yrs ago!) observed... -- the longer the wire, the smaller the load for failure. Reasons: -- flaws cause premature failure. -- Larger samples contain more flaws! Reprinted w/ permission from R.W. Hertzberg, "Deformation and Fracture Mechanics of Engineering Materials", (4th ed.) Fig. 7.4. John Wiley and Sons, Inc., 1996.
 Fig John Wiley and Sons, Inc.,")
12
Considering Loading Rate Effect Increased loading rate... -- increases y and TS -- decreases %EL Why? An increased rate allows less time for dislocations to move past obstacles. yy yy TS larger smaller

13
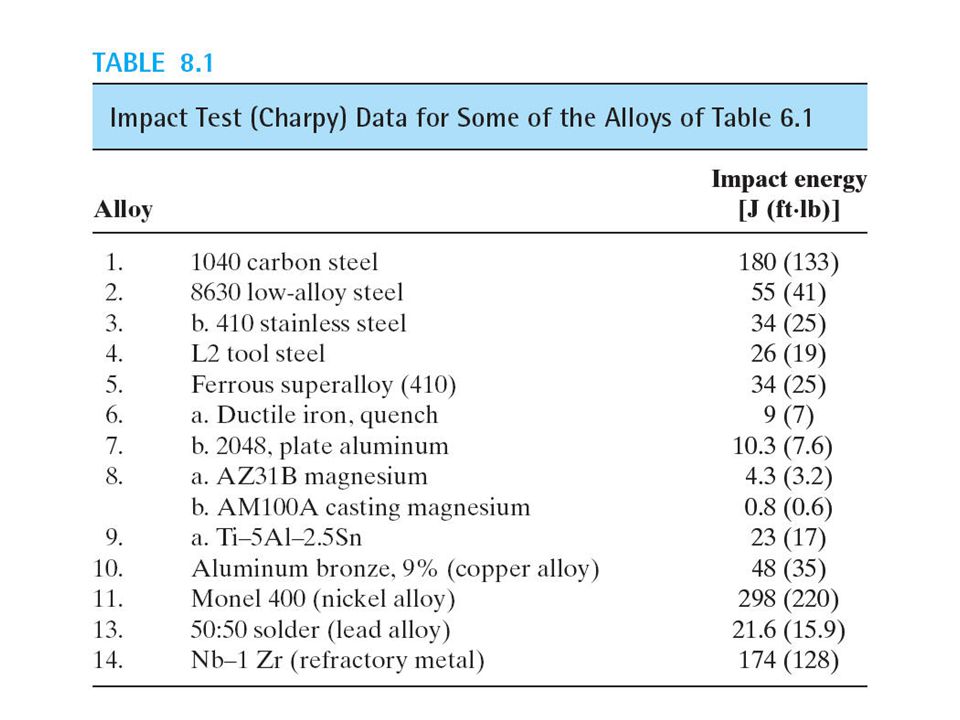
Impact (high strain rate) Testing final heightinitial height Impact loading (see ASTM E23 std.): -- severe testing case -- makes material act more brittle -- decreases toughness Useful to compare alternative materials for severe applications Adapted from Fig. 8.12(b), Callister 7e. (Fig. 8.12(b) is adapted from H.W. Hayden, W.G. Moffatt, and J. Wulff, The Structure and Properties of Materials, Vol. III, Mechanical Behavior, John Wiley and Sons, Inc. (1965) p. 13.) (Charpy Specimen)
, Callister 7e. (Fig. 8.12(b) is adapted from H.W. Hayden, W.G. Moffatt, and J. Wulff, The Structure and Properties of Materials, Vol. III, Mechanical Behavior, John Wiley and Sons, Inc. (1965) p. 13.) (Charpy Specimen).")
14
Increasing temperature... --increases %EL and K c Ductile-to-Brittle Transition Temperature (DBTT)... Considering Temperature Effects BCC metals (e.g., iron at T < 914°C) Impact Energy Temperature High strength materials ( y > E/150) polymers More Ductile Brittle Ductile-to-brittle transition temperature FCC metals (e.g., Cu, Ni) Adapted from Fig. 8.15, Callister 7e.
... Considering Temperature Effects BCC metals (e.g., iron at T < 914°C) Impact Energy Temperature High strength materials ( y > E/150) polymers More Ductile Brittle Ductile-to-brittle transition temperature FCC metals (e.g., Cu, Ni) Adapted from Fig. 8.15, Callister 7e..")
16
Figure 8.3 Variation in ductile-to-brittle transition temperature with alloy composition. (a) Charpy V-notch impact energy with temperature for plain-carbon steels with various carbon levels (in weight percent). (b) Charpy V-notch impact energy with temperature for Fe–Mn–0.05C alloys with various manganese levels (in weight percent). (From Metals Handbook, 9th ed., Vol. 1, American Society for Metals, Metals Park, OH, 1978.)
 Charpy V-notch impact energy with temperature for plain-carbon steels with various carbon levels (in weight percent). (b) Charpy V-notch impact energy with temperature for Fe–Mn–0.05C alloys with various manganese levels (in weight percent). (From Metals Handbook, 9th ed., Vol. 1, American Society for Metals, Metals Park, OH, 1978.).")
18
Pre-WWI: The Titanic WWII: Liberty ships Problem: Used a type of steel with a DBTT ~ Room temp. Reprinted w/ permission from R.W. Hertzberg, "Deformation and Fracture Mechanics of Engineering Materials", (4th ed.) Fig. 7.1(a), p. 262, John Wiley and Sons, Inc., 1996. (Orig. source: Dr. Robert D. Ballard, The Discovery of the Titanic.) Reprinted w/ permission from R.W. Hertzberg, "Deformation and Fracture Mechanics of Engineering Materials", (4th ed.) Fig. 7.1(b), p. 262, John Wiley and Sons, Inc., 1996. (Orig. source: Earl R. Parker, "Behavior of Engineering Structures", Nat. Acad. Sci., Nat. Res. Council, John Wiley and Sons, Inc., NY, 1957.) Design Strategy: Build Steel Ships Quickly! As a Designer: Stay Above The DBTT!
 Fig. 7.1(a), p. 262, John Wiley and Sons, Inc., (Orig. source: Dr. Robert D. Ballard, The Discovery of the Titanic.) Reprinted w/ permission from R.W. Hertzberg, Deformation and Fracture Mechanics of Engineering Materials , (4th ed.) Fig. 7.1(b), p. 262, John Wiley and Sons, Inc., (Orig. source: Earl R. Parker, Behavior of Engineering Structures , Nat. Acad. Sci., Nat. Res. Council, John Wiley and Sons, Inc., NY, 1957.) Design Strategy: Build Steel Ships Quickly. As a Designer: Stay Above The DBTT!.")
19
Flaws are Stress Concentrators! Results from crack propagation Griffith Crack Model: where t = radius of curvature of crack tip o = applied stress m = stress at crack tip tt Adapted from Fig. 8.8(a), Callister 7e.
, Callister 7e..")
20
Concentration of Stress at Crack Tip Adapted from Fig. 8.8(b), Callister 7e.
, Callister 7e.")
21
Engineering Fracture Design r/hr/h sharper fillet radius increasingw/hw/h 00.51.0 1.5 2.0 2.5 Stress Conc. Factor, K t max o = Avoid sharp corners! Adapted from G.H. Neugebauer, Prod. Eng. (NY), Vol. 14, pp. 82-87 1943.) r, fillet radius w h o max max is the concentrated stress in the narrowed region
, Vol. 14, pp ) r, fillet radius w h o max max is the concentrated stress in the narrowed region.")
22
Crack Propagation Cracks propagate due to sharpness of crack tip A plastic material deforms at the tip, “blunting” the crack. deformed region brittle Energy balance on the crack Elastic strain energy- energy is stored in material as it is elastically deformed this energy is released when the crack propagates creation of new surfaces requires (this) energy plastic
 energy plastic.")
23
When Does a Crack Propagate? Crack propagates if applied stress is above critical stress where –E = modulus of elasticity – s = specific surface energy –a = one half length of internal crack –K c = c / 0 For ductile materials replace s by s + p where p is plastic deformation energy i.e., m > c or K t > K c

24
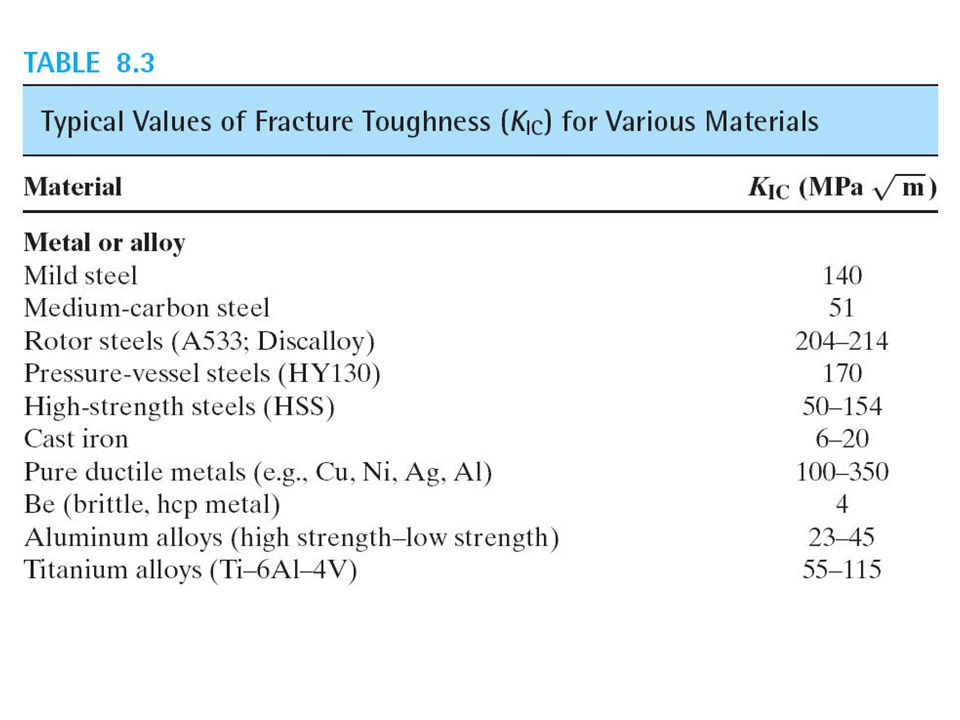
Fracture Toughness Composite reinforcement geometry is: f = fibers; sf = short fibers; w = whiskers; p = particles. Addition data as noted (vol. fraction of reinforcement): 1. (55vol%) ASM Handbook, Vol. 21, ASM Int., Materials Park, OH (2001) p. 606. 2. (55 vol%) Courtesy J. Cornie, MMC, Inc., Waltham, MA. 3. (30 vol%) P.F. Becher et al., Fracture Mechanics of Ceramics, Vol. 7, Plenum Press (1986). pp. 61-73. 4. Courtesy CoorsTek, Golden, CO. 5. (30 vol%) S.T. Buljan et al., "Development of Ceramic Matrix Composites for Application in Technology for Advanced Engines Program", ORNL/Sub/85-22011/2, ORNL, 1992. 6. (20vol%) F.D. Gace et al., Ceram. Eng. Sci. Proc., Vol. 7 (1986) pp. 978-82. K 1c – plane strain stress concentration factor – with edge crack; A Material Property we use for design, developed using ASTM Std: ASTM E399 - 09 Standard Test Method for Linear- Elastic Plane-Strain Fracture Toughness K Ic of Metallic Materials
: 1. (55vol%) ASM Handbook, Vol. 21, ASM Int., Materials Park, OH (2001) p (55 vol%) Courtesy J. Cornie, MMC, Inc., Waltham, MA. 3. (30 vol%) P.F. Becher et al., Fracture Mechanics of Ceramics, Vol. 7, Plenum Press (1986). pp Courtesy CoorsTek, Golden, CO. 5. (30 vol%) S.T. Buljan et al., Development of Ceramic Matrix Composites for Application in Technology for Advanced Engines Program , ORNL/Sub/ /2, ORNL, (20vol%) F.D. Gace et al., Ceram. Eng. Sci. Proc., Vol. 7 (1986) pp K 1c – plane strain stress concentration factor – with edge crack; A Material Property we use for design, developed using ASTM Std: ASTM E Standard Test Method for Linear- Elastic Plane-Strain Fracture Toughness K Ic of Metallic Materials.")
27
Crack growth condition: Largest, most stressed cracks grow first! As Engineers we must Design Against Crack Growth K ≥ K c = --Result 1: Max. flaw size dictates design stress! a max no fracture --Result 2: Design stress dictates max. flaw size! a max no fracture Y is a material behavior shape factor

28
Two designs to consider... Design A --largest flaw is 9 mm --failure occurs at stress = 112 MPa Design B --use same material --largest flaw is 4 mm --failure stress = ? Key point: Y and K c are the same in both designs! Answer: Reducing flaw size pays off! Material has K c = 26 MPa-m 0.5 Design Example: Aircraft Wing Use... 9 mm112 MPa 4 mm --Result:

29
Let’s look at Another Situation Steel subject to tensile stress of 1030 MPa, it has K 1c of 54.8 MPa (m) – a handbook value If it has a ‘largest surface crack’.5 mm (.0005 m) long will it grow and fracture? What crack size will result in failure?

30
Figure 8.7 Two mechanisms for improving fracture toughness of ceramics by crack arrest. (a) Transformation toughening of partially stabilized zirconia involves the stress- induced transformation of tetragonal grains to the monoclinic structure, which has a larger specific volume. The result is a local volume expansion at the crack tip, squeezing the crack shut and producing a residual compressive stress. (b) Microcracks produced during fabrication of the ceramic can blunt the advancing crack tip
 Transformation toughening of partially stabilized zirconia involves the stress- induced transformation of tetragonal grains to the monoclinic structure, which has a larger specific volume. The result is a local volume expansion at the crack tip, squeezing the crack shut and producing a residual compressive stress. (b) Microcracks produced during fabrication of the ceramic can blunt the advancing crack tip.")
31
Fatigue behavior: Fatigue = failure under cyclic stress Stress varies with time. -- key parameters are S (stress amplitude), m, and frequency max min time m S Key points when designing in Fatigue inducing situations: -- fatigue can cause part failure, even though max < c. -- fatigue causes ~ 90% of mechanical engineering failures. Because of its importance, ASTM and ISO have developed many special standards to assess Fatigue Strength of materials (Fig. 8.18 is from Materials Science in Engineering, 4/E by Carl. A. Keyser, Pearson Education, Inc., Upper Saddle River, NJ.) tension on bottom compression on top counter motor flex coupling specimen bearing
, m, and frequency max min time m S Key points when designing in Fatigue inducing situations: -- fatigue can cause part failure, even though max < c. -- fatigue causes ~ 90% of mechanical engineering failures. Because of its importance, ASTM and ISO have developed many special standards to assess Fatigue Strength of materials (Fig is from Materials Science in Engineering, 4/E by Carl. A. Keyser, Pearson Education, Inc., Upper Saddle River, NJ.) tension on bottom compression on top counter motor flex coupling specimen bearing.")
32
Some important Calculations in Fatigue Testing

33
Figure 8.8 Fatigue corresponds to the brittle fracture of an alloy after a total of N cycles to a stress below the tensile strength.

34
Fatigue limit, S fat : --no fatigue failure if S < S fat Fatigue Limit is defined in: ASTM D671 Adapted from Fig. 8.19(a), Callister 7e. Fatigue Design Parameters S fat case for steel (typ.) N = Cycles to failure 10 3 5 7 9 unsafe safe S = stress amplitude However, Sometimes, the fatigue limit is zero! Adapted from Fig. 8.19(b), Callister 7e. case for Al (typ.) N = Cycles to failure 10 3 5 7 9 unsafe safe S = stress amplitude
, Callister 7e. Fatigue Design Parameters S fat case for steel (typ.) N = Cycles to failure unsafe safe S = stress amplitude However, Sometimes, the fatigue limit is zero. Adapted from Fig. 8.19(b), Callister 7e. case for Al (typ.) N = Cycles to failure unsafe safe S = stress amplitude.")
35
Let’s look at an Example

36
For metals other than Ferrous alloys, F.S. is taken as the stress that will cause failure after 10 8 cycles

37
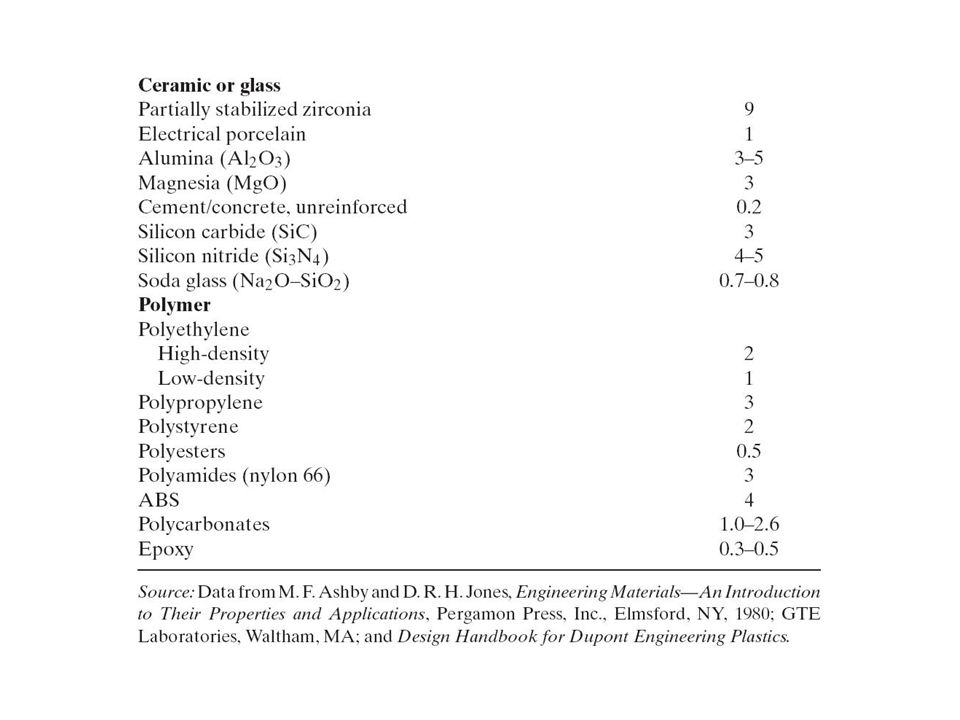
Figure 8.21 Fatigue behavior for an acetal polymer at various temperatures. (From Design Handbook for Du Pont Engineering Plastics, used by permission.) For polymers, we consider fatigue life to be (only) 10 6 cycles to failure thus fatigue strength is the stress that will lead to failure after 10 6 cycles
 For polymers, we consider fatigue life to be (only) 10 6 cycles to failure thus fatigue strength is the stress that will lead to failure after 10 6 cycles.")
38
Cracks in Material grows incrementally typ. 1 to 6 increase in crack length per loading cycle Failed rotating shaft --crack grew even though K max < K c --crack grows faster as increases crack gets longer loading freq. increases. crack origin Adapted from from D.J. Wulpi, Understanding How Components Fail, American Society for Metals, Materials Park, OH, 1985. Fatigue Mechanism

39
Figure 8.11 An illustration of how repeated stress applications can generate localized plastic deformation at the alloy surface leading eventually to sharp discontinuities.

40
Figure 8.12 Illustration of crack growth with number of stress cycles, N, at two different stress levels. Note that, at a given stress level, the crack growth rate, da/dN, increases with increasing crack length, and, for a given crack length such as a 1, the rate of crack growth is significantly increased with increasing magnitude of stress.

41
Improving Fatigue Life 1. Impose a compressive surface stresses (to suppress surface crack growth) N = Cycles to failure moderate tensile m Larger tensile m S = stress amplitude near zero or compressive m Increasing m --Method 1: shot peening put surface into compression shot --Method 2: carburizing C-rich gas 2. Remove stress concentrators. Adapted from Fig. 8.25, Callister 7e. bad better Adapted from Fig. 8.24, Callister 7e.
 N = Cycles to failure moderate tensile m Larger tensile m S = stress amplitude near zero or compressive m Increasing m --Method 1: shot peening put surface into compression shot --Method 2: carburizing C-rich gas 2. Remove stress concentrators. Adapted from Fig. 8.25, Callister 7e. bad better Adapted from Fig. 8.24, Callister 7e..")
42
Figure 8.17 Fatigue strength is increased by prior mechanical deformation or reduction of structural discontinuities.

43
Other Issues in Failure – Stress Corrosion Cracking Water can greatly accelerate crack growth and shorten life performance – in metals, ceramics and glasses Other chemicals – that can generate (or provide H + or O 2- ) ions – also effectively reduce fatigue life as these ions react with the metal or oxide in the material
 ions – also effectively reduce fatigue life as these ions react with the metal or oxide in the material")
44
Figure 8.18 The drop in strength of glasses with duration of load (and without cyclic-load applications) is termed static fatigue. (From W. D. Kingery, Introduction to Ceramics, John Wiley & Sons, Inc., New York, 1960.)
.")
45
Figure 8.19 The role of H 2 O in static fatigue depends on its reaction with the silicate network. One H 2 O molecule and one –Si– O–Si– segment generate two Si–OH units, which is equivalent to a break in the network.

46
Figure 8.20 Comparison of (a) cyclic fatigue in metals and (b) static fatigue in ceramics.
 cyclic fatigue in metals and (b) static fatigue in ceramics.")
47
Engineering materials don't reach theoretical strength. Flaws produce stress concentrations that cause premature failure. Sharp corners produce large stress concentrations and premature failure. Failure type depends on T and stress: - for noncyclic and T < 0.4T m, failure stress decreases with: - increased maximum flaw size, - decreased T, - increased rate of loading. - for cyclic : - cycles to fail decreases as increases. - for higher T (T > 0.4T m ): - time to fail decreases as or T increases. SUMMARY
: - time to fail decreases as or T increases. SUMMARY.")
Similar presentations