Download presentation
Presentation is loading. Please wait.

1
Examine the data Hsien-Ming Lien Dept of Public Finance, NCCU

2
1.1 Read the data Read the ASCII file infile must provide the variable name, width, and format Read the excel file insheet variable names need to be specified Read the Stata file use c:\regstata\elemapi from the internet

3
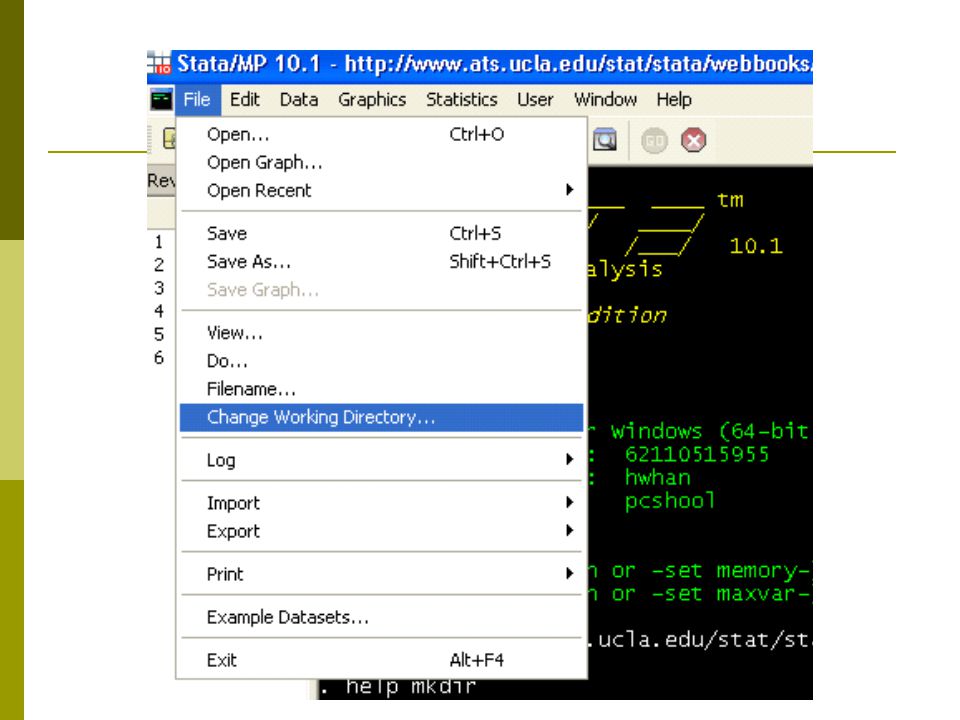
cd dir use save

8
1.2 Describe the data Describe the data Data size Observations Variable name Variable type (string, byte, float, etc)
")
10
直接按 ok

12
Variables api00/academic performance of the school acs_k3/the average class size in kindergarten through 3rd grade meals/the percentage of students receiving free meals full/the percentage of teachers who have full teaching credentials

13
List All observations Some observations Some variables

18
選取變數

21
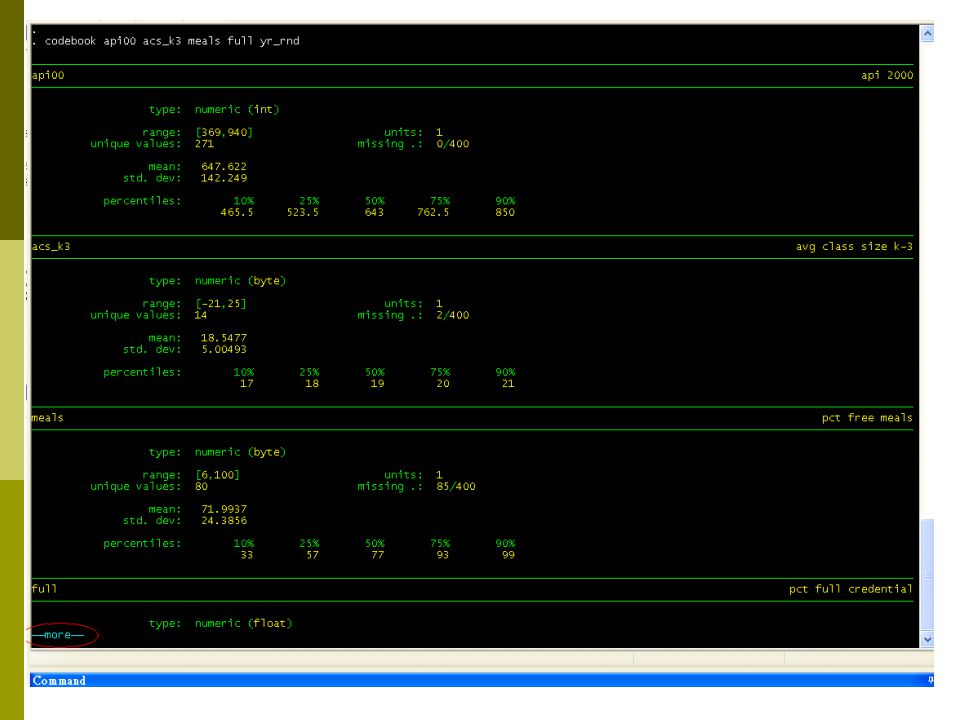
Notice the missing values of meals.

22
Codebook Number of values Missing values Distribution of values

24
選取變數後按 ok

26
summarize Provide concise information about variables Observations Basic statistics (mean, s.d., min, max) Option: details
 Option: details")
28
選取變數後按 ok

33
1.3 Tab the data Tabulate Tabulate the size of class size

37
Look at the school and district number to check if they are from the same district

46
1.4 Graph the data Use graphs to examine the data Histogram Stem and leaf plot

54
A stem-and-leaf plot would also have helped to identify these observations. This plot shows the exact values of the observations, indicating that there were three -21s, two -20s, and one -19.

55
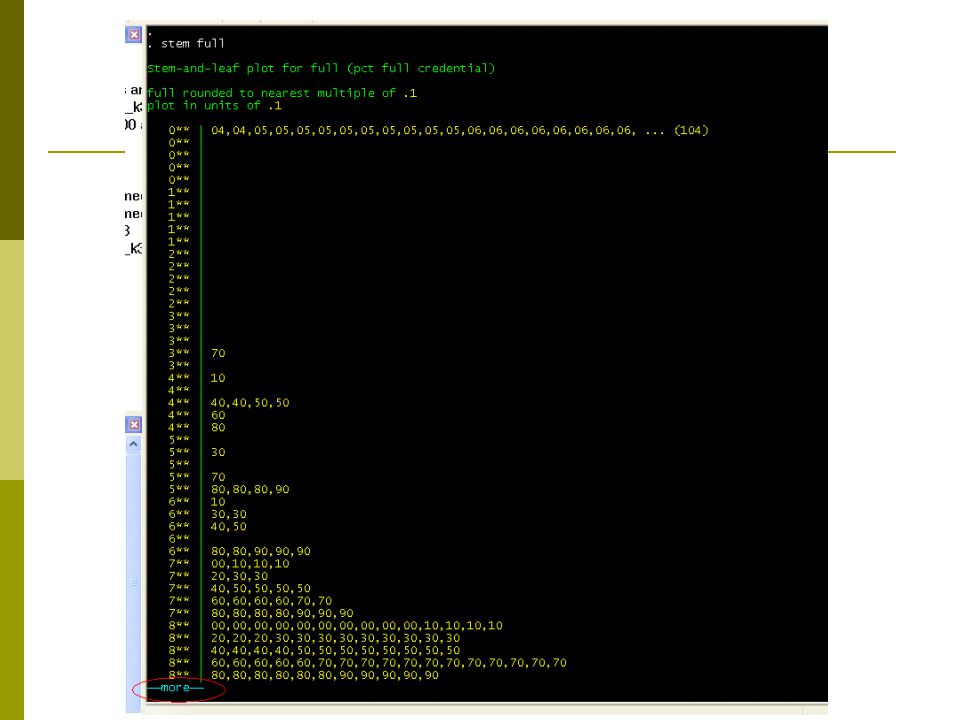
Quiz 1: do a histogram on full Quiz 2: do a stem-and-leaf plot on full

58
Let's look at the frequency distribution of full to see if we can understand this better. The values go from 0.42 to 1.0, then jump to 37 and go up from there. It appears as though some of the percentages are actually entered as proportions, e.g., 0.42 was entered instead of 42 or 0.96 which really should have been 96.

62
Again, let's see which districts these data came from.

66
We note that all 104 observations in which full was less than or equal to one came from district 401. Let's count how many observations there are in district 104 using the count command.

70
Two ways graphs Scatterplot: show the joint distribution of two variables Let's look at the scatterplot matrix for the variables:

75
Correct the variable mistakes acs_k3 Replace the negative values into the positive ones replace acs_k3=-acs_k3 if acs_k3<0 Full Change from the percentage to the proportion replace full=full*100 if full<=1

82
save elemapi, replace

Similar presentations


, and type in a title for your data.>")


 Getting Started Guide.>")


 Purpose Allows the analyst to analyze quantitative data by summarizing it in sorted format, scattergram by observation,>")
 Frequency distributions Histograms Stem and leaf displays Scatterplots.>")


>")
 Purpose Allows the analyst to analyze quantitative data by summarizing it in sorted format, scattergram.>")