Download presentation
Presentation is loading. Please wait.

1
Inventory Management

2
Overview To hold or not to hold To hold or not to hold Types of inventory Types of inventory Pareto principal Pareto principal ABC analysis ABC analysis Cycle counting Cycle counting

3
To hold or not to hold – that is the question. To hold: To hold: Customer service Customer service Ordering or setup costs Ordering or setup costs Labor and equipment utilization Labor and equipment utilization Transportation cost Transportation cost Not to hold: Inventory holding cost Interest or opportunity cost Storage and handling cost Taxes, insurance, shrinkage Hide production problems

4
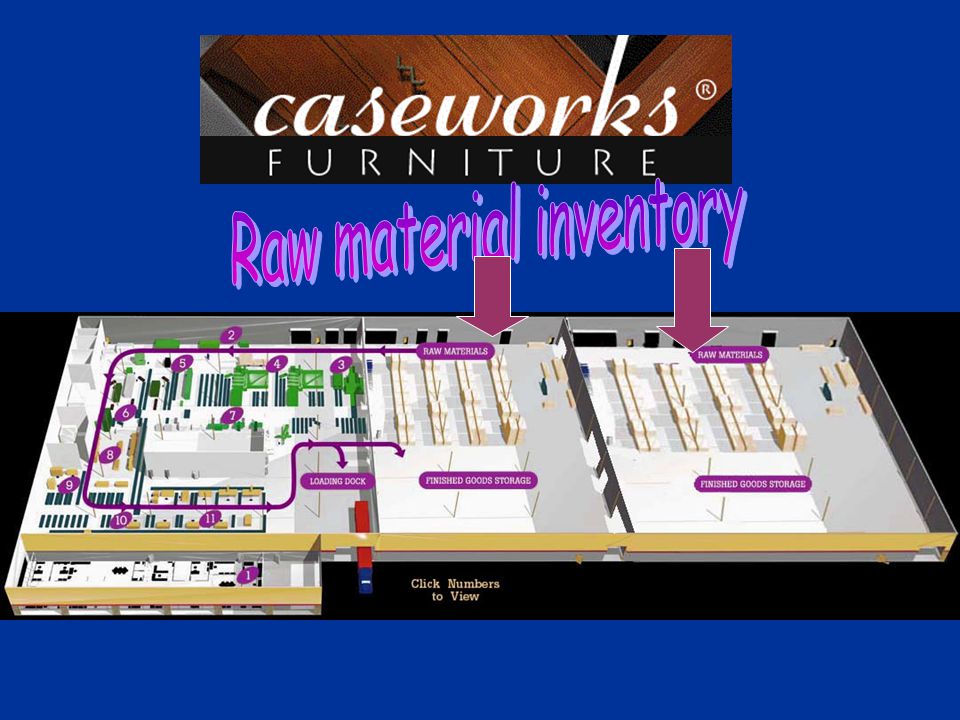
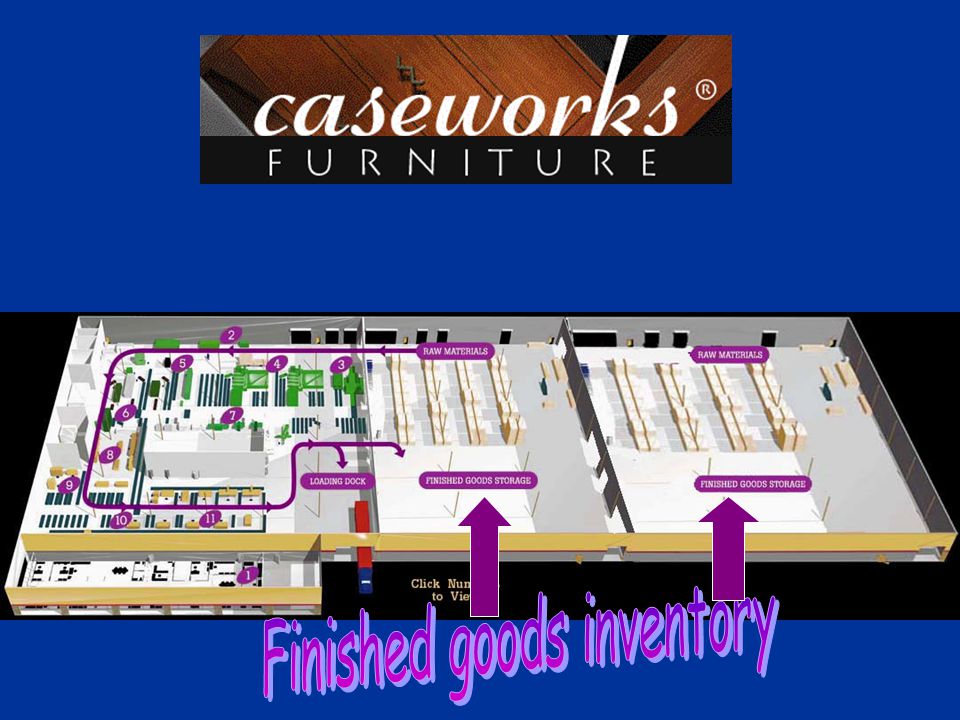
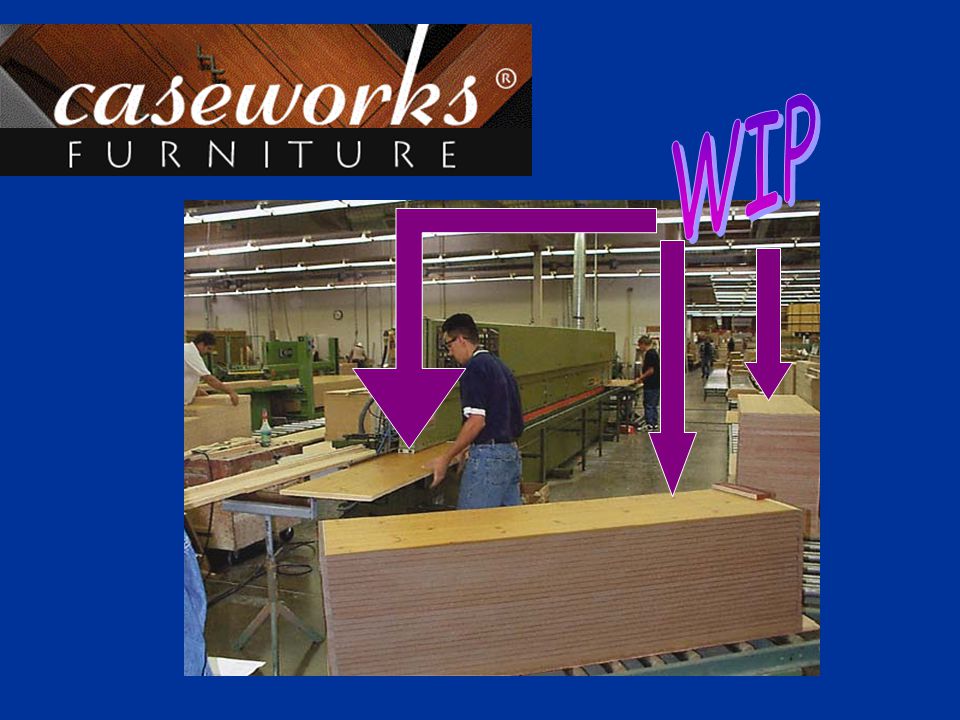
Types of inventory Raw material Raw material WIP inventory – Work In Process WIP inventory – Work In Process MRO inventory – Maintenance, Repair, Operating supplies MRO inventory – Maintenance, Repair, Operating supplies Finished goods inventory Finished goods inventory

5
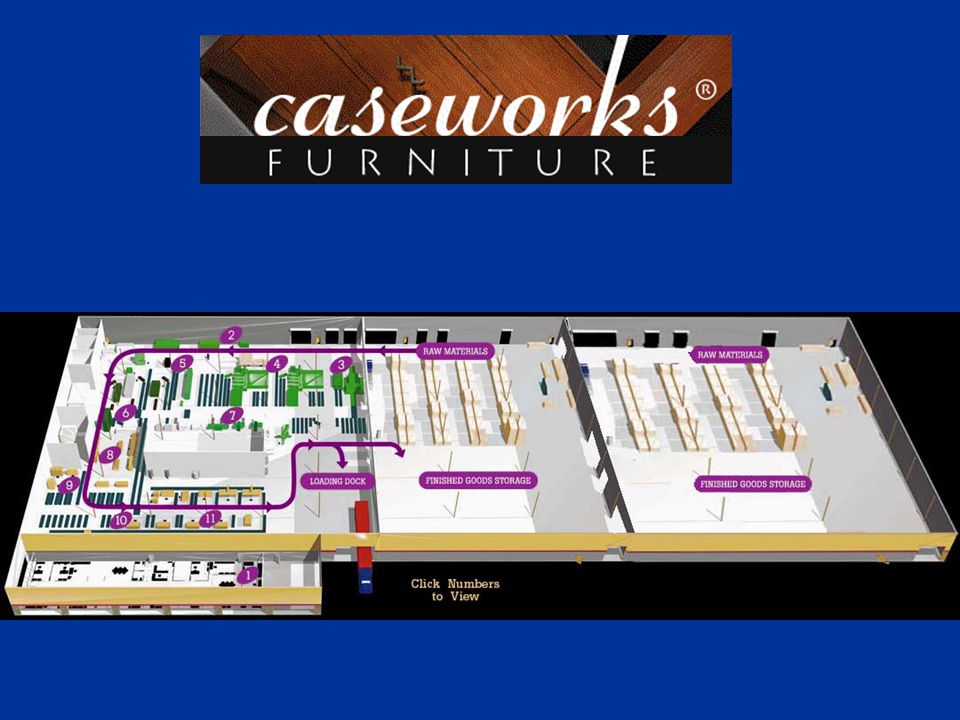
http://www.caseworksfurniture.com/healthcare/hcfactory.htm Located in Tucson, Arizona Produce furniture for: Healthcare industry Hospitals Government

10
Pareto Principle 80/20 rule 80/20 rule Based on the work of an economist & avid horticulturalist, V. Pareto in late 19 th century Italy. Based on the work of an economist & avid horticulturalist, V. Pareto in late 19 th century Italy. 80% of the land was owned by 20% of the people. 80% of the land was owned by 20% of the people. 80% of the peas were produced by 20% of the pods 80% of the peas were produced by 20% of the pods Applied to business by quality guru Dr. Juran Applied to business by quality guru Dr. Juran

11
Pareto principle applied: Applied to Meetings: 80% of decisions come from 20% of meeting time. Applied to Meetings: 80% of decisions come from 20% of meeting time. Applied to product defects: 20% of the quality problems cause 80% of the defects. Applied to product defects: 20% of the quality problems cause 80% of the defects. Applied to Salespeople: Roughly 20% of a sales force will develop 80% of the annual results Applied to Salespeople: Roughly 20% of a sales force will develop 80% of the annual results Applied to Business Units: Roughly 20% of a company's business units will produce 80% of the annual revenue. Applied to Business Units: Roughly 20% of a company's business units will produce 80% of the annual revenue. Applied to time-management… Applied to time-management…

12
Moral of the Pareto principle Find the significant 20% Find the significant 20% Manage that 20% Manage that 20%

13
Pareto principal + Inventory = ABC Analysis “critical few and the trivial many” “critical few and the trivial many” Create a Pareto chart for the inventory dollars per year of each item – dollar-volume Create a Pareto chart for the inventory dollars per year of each item – dollar-volume Generally the top 80% of dollars are from approximately 20% of the items. Generally the top 80% of dollars are from approximately 20% of the items. Categorize all items into Categorize all items into Class A items – top ~20% items by dollar-volume Class A items – top ~20% items by dollar-volume Class B items Class B items Class C items Class C items

14
ABC Analysis 102030405060708090100 Percentage of items Percentage of dollar value 100 — 90 — 80 — 70 — 60 — 50 — 40 — 30 — 20 — 10 — 0 —

15
ABC Analysis 102030405060708090100 Percentage of items Percentage of dollar value 100 — 90 — 80 — 70 — 60 — 50 — 40 — 30 — 20 — 10 — 0 —

16
ABC Analysis 102030405060708090100 Percentage of items Percentage of dollar value 100 — 90 — 80 — 70 — 60 — 50 — 40 — 30 — 20 — 10 — 0 —

17
ABC Analysis 102030405060708090100 Percentage of items Percentage of dollar value 100 — 90 — 80 — 70 — 60 — 50 — 40 — 30 — 20 — 10 — 0 —

18
ABC Analysis 102030405060708090100 Percentage of items Percentage of dollar value 100 — 90 — 80 — 70 — 60 — 50 — 40 — 30 — 20 — 10 — 0 — Class C Class A Class B

19
ABC Analysis Policies based on ABC analysis Policies based on ABC analysis Develop Class A suppliers more Develop Class A suppliers more Implement tighter physical control of Class A items Implement tighter physical control of Class A items Forecast Class A items more carefully Forecast Class A items more carefully Model inventory for Class A items Model inventory for Class A items

20
Cycle counting Physically counting a sample of total inventory on a regular basis Physically counting a sample of total inventory on a regular basis Used often with ABC classification Used often with ABC classification Class A items counted most often (e.g., daily) Class A items counted most often (e.g., daily) Class B items counted less frequently (e.g. weekly) Class B items counted less frequently (e.g. weekly) Class C items counted least often (e.g. monthly) Class C items counted least often (e.g. monthly)
 Class B items counted less frequently (e.g. weekly) Class C items counted least often (e.g. monthly) Class C items counted least often (e.g. monthly).")
21
Advantages of Cycle Counting Eliminates shutdown and interruption of production necessary for annual physical inventories Eliminates shutdown and interruption of production necessary for annual physical inventories Eliminates annual inventory adjustments Eliminates annual inventory adjustments Provides trained personnel to audit the accuracy of inventory Provides trained personnel to audit the accuracy of inventory Allows the cause of errors to be identified and remedial action to be taken Allows the cause of errors to be identified and remedial action to be taken Maintains accurate inventory records Maintains accurate inventory records

22
Inventory Costs Holding costs - associated with holding or “carrying” inventory over time Holding costs - associated with holding or “carrying” inventory over time Ordering costs - associated with costs of placing order and receiving goods; retail & distribution Ordering costs - associated with costs of placing order and receiving goods; retail & distribution Setup costs - cost to prepare a machine or process for manufacturing an order; production Setup costs - cost to prepare a machine or process for manufacturing an order; production

23
Holding Costs Storage Storage Obsolescence Obsolescence Insurance Insurance Extra staffing Extra staffing Interest Interest Pilferage Pilferage Damage Damage Warehousing Warehousing Etc. Etc.

24
Ordering Costs Supplies Supplies Forms Forms Order processing Order processing Clerical support Clerical support Transportation/shipping Transportation/shipping Etc. Etc.

25
Setup Costs Machine setup costs Machine setup costs Clean-up costs Clean-up costs Re-tooling costs Re-tooling costs Adjustment costs Adjustment costs Etc. Etc.

Similar presentations


 Definition, objectives, historical evolution, EOQ, ABC, Inventory counting systems.>")


