Download presentation
Presentation is loading. Please wait.

1
Dr Chan Yan Chong 曾淵滄博士 City University of Hong Kong
Investment and Decision Making: Everything is Mathematics? 投資與決策 ── 一切皆數? Dr Chan Yan Chong 曾淵滄博士 City University of Hong Kong

2
The Art of Investment is a Combination of Psychology & Statistics

3
Psychology Human Weaknesses Self-analysis Patience Adventurous
Pressure

4
Emotion of Investors Greedy NASDAQ Index Afraid
Source: Bloomberg,Jan 1, 1996 to Apr 30, 2001

5
An investor wants to make a week basis investment on Stock A with the information below.
Price change of Stock A after one week ($) 2 Probability From the principle of expected value, the expected price change in Stock A (in one week) = $[2 × (1) × × (+ 1) × (+ 2) × 0.1] = $ 0.5 A negative expected price change indicates that the price of Stock A is likely to decrease after one week. In other words, the investor is likely to lose money if he makes the investment on Stock A.
 2 Probability From the principle of expected value, the expected price change in. Stock A (in one week) = $[2 × (1) × × (+ 1) × (+ 2) × 0.1] = $ 0.5. A negative expected price change indicates that the price of Stock A is. likely to decrease after one week. In other words, the investor is likely to. lose money if he makes the investment on Stock A.")
6
Difference between Investment and Gambling

7
3 Dice Game Probability of BIG or SMALL = 1/2 - 1/36 = 17/36
Expected Value for $300 game = $300 X 17/36 - $300 X 19/36 = -$16.67 Expected Value for 500 $300 games =-$16.67 X 500 = -$

8
3 Dice Game Pay Win/Loss Cash 1. $300 L -$300 2. $600 L -$900
Expected Value for 500 games = $300 X 17/36 X 500 = $

9
Risk of 3 Dice Game Pay Gain/Loss Cash 1. $300 L -$300 2. $600 L -$900

10
Assessing Risk Risk has many connotations. In the field of
investment, the concept of risk has slowly changed over many years. Early 1900: Risk is debt and variability of net asset value Markowitz(1952): Risk is the beta value of CPAM Sharp(1981): Risk is the variability of rate of return which can be measured by standard deviation
: Risk is the beta value of CPAM. Sharp(1981): Risk is the variability of rate of return which can be measured by standard deviation.")
11
Beta Value: CAPM CAPM: Capital Asset Pricing Model Y = A + B X
A: Alpha value B: Beta value Y: portfolio`s return X: market`s return

12
Standard Deviation = standard deviation of single asset
p : standard deviation of a portfolio Wi : weight of stock i in the portfolio

13
Avoiding Bankruptcy Companies
Z = 1.2X X X3 + X X5 X1: working capital / assets X2: retained earnings / assets X3: pretax earnings / assets X4: sales / assets X5: market value of equities / liabilities If Z < 1.81 is classified as troubled.

14
How to use logarithm (log) application for analyzing stock market tendency?
Y = logb X equal to by = X b = base Y = exponent

15
What is log? X Log2 X 1 20=1 2 21=2 4 22=4 8 3 23=8 16 24=16 32 5 25=32

18
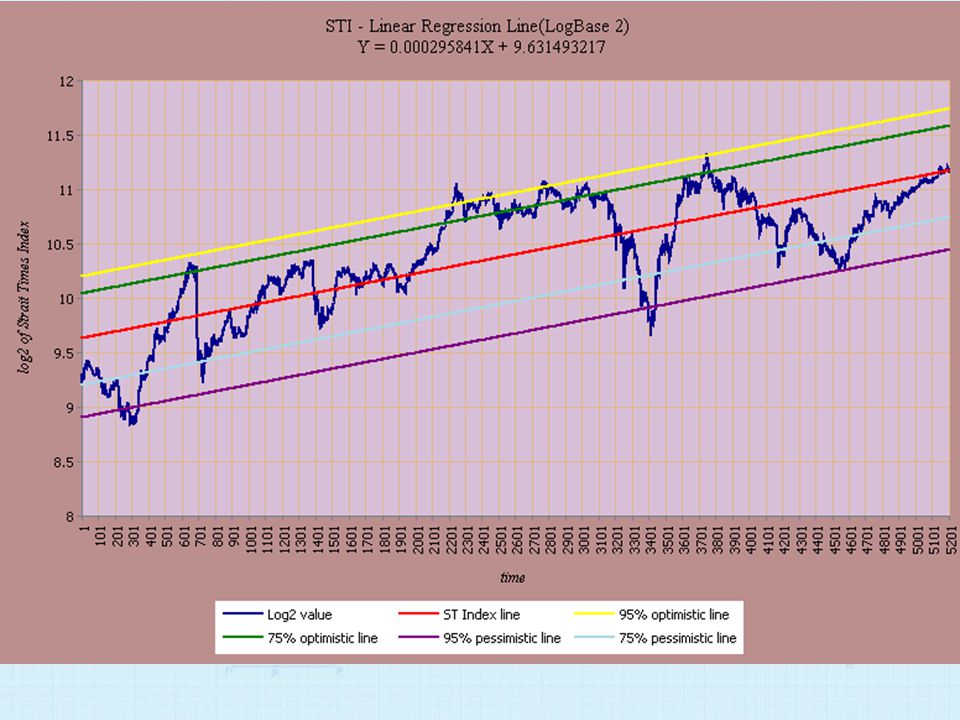
Linear Regression Line
How this method is used to analyze the stock market tendency and the cycle? y = a+bx b = nΣxy – ΣxΣy nΣx2 - (Σx)2 a = Σx2Σy - ΣxΣxy
2. a = Σx2Σy - ΣxΣxy.")
19
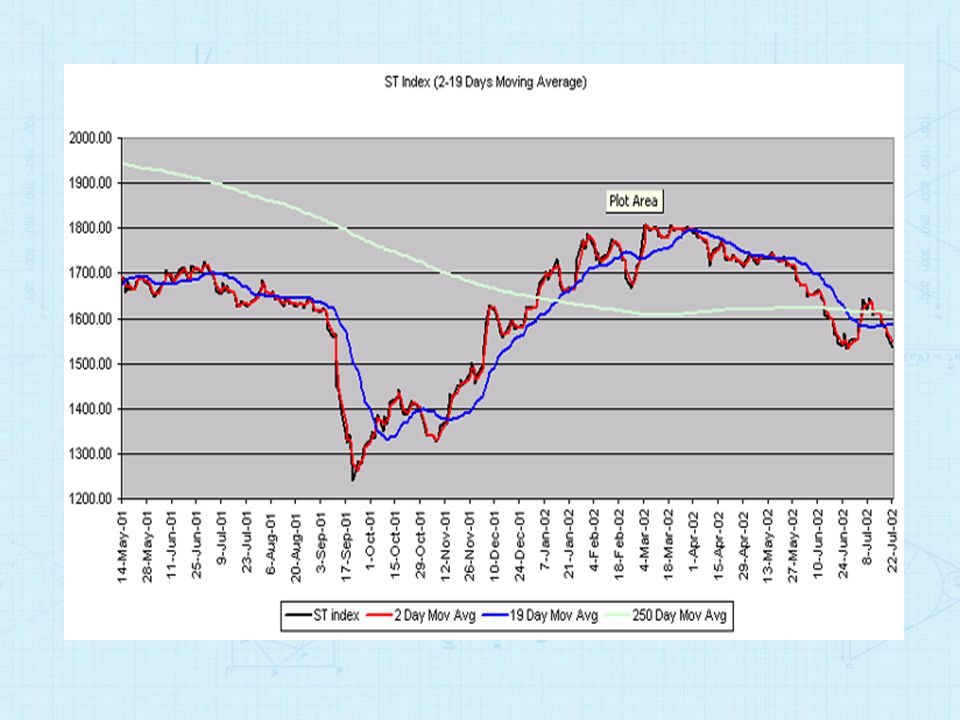
Moving Average MA(t,n) = P(t-k+1) /n
MA(t,n): n day moving average on period t P(t): price on period t
: n day moving average on period t. P(t): price on period t.")
21
Derived Securities Future Option: Call and Put

Similar presentations


 Security Market.>")
 Chapter.>")


>")
 There are two risky assets, Stock A and Stock B. Now suppose there exists a risk- free asset — an asset which gives.>")

 Purpose of the Course Evolution of Modern Portfolio Theory Efficient Frontier Single Index Model Capital.>")


