Download presentation
Presentation is loading. Please wait.

1
Chapter 13 Equity Valuation
Describes the financial instruments traded in primary and secondary markets. Discusses Market indexes. Discusses options and futures. 1

2
13.1 Valuation by Comparables
13-2

3
Fundamental Stock Analysis: Models of Equity Valuation
Basic Types of Models Balance Sheet Models Dividend Discount Models Price/Earnings Ratios Free Cash Flow Models All are covered in the PPT 13-3

4
Models of Equity Valuation
Valuation models using comparables Look at the relationship between price and various determinants of value for similar firms The internet provides a convenient way to access firm data. Some examples are: EDGAR Finance.yahoo.com 13-4

5
Table 13.1 Microsoft Corporation Financial Highlights 2009
13-5

6
Valuation Methods Book value
Value of common equity on the balance sheet Based on historical values of assets and liabilities, which may not reflect current values Some assets such as brand name or specialized skills are not on a balance sheet Is book value a floor value for market value of equity? 13-6

7
Valuation Methods Market value
Current market value of assets minus current market value of liabilities Market value of assets may be difficult to ascertain Market value based on stock price Better measure than book value of the worth of the stock to the investor. 13-7

8
Valuation Methods (Other Measures)
Liquidation value Net amount realized from sale of assets and paying off all debt Firm becomes a takeover target if market value stock falls below this amount, so liquidation value may serve as floor to value 13-8

9
Valuation Methods (Other Measures)
Replacement cost Replacement cost of the assets less the liabilities May put a ceiling on market value in the long run because values above replacement cost will attract new entrants into the market. Tobin’s Q = Market Value / Replacement Cost; should tend toward 1 over time. Tobin’s Q varies between 1 and 1.5 13-9

10
13.2 Intrinsic Value Versus Market Price
These are methods of estimating cash flows rather than balance sheet quantities. 13-10

11
Expected Holding Period Return
The return on a stock investment comprises cash dividends and capital gains or losses Assuming a one-year holding period 13-11

12
Required Return CAPM gave us required return, call it k:
k = market capitalization rate If the stock is priced correctly Required return should equal expected return = A lot of corporate work uses k for return on equity 13-12

13
Intrinsic Value Intrinsic Value
The present value of a firm’s expected future net cash flows discounted by a risk adjusted required rate of return. The cash flows on a stock are? Dividends (Dt) Sale price (Pt) Intrinsic Value today (time 0) is denoted V0 and for a one year holding period may be found as: 13-13
 Sale price (Pt) Intrinsic Value today (time 0) is denoted V0 and for a one year holding period may be found as:")
14
Intrinsic Value and Market Price
Consensus value of all traders In equilibrium the current market price will equal intrinsic value Trading Signals If V0 > P0 If V0 < P0 If V0 = P0 Buy Sell or Short Sell Hold as it is Fairly Priced 13-14

15
13.3 Dividend Discount Models
For now assume price = intrinsic value 13-15

16
Basic Dividend Discount Model
Intrinsic value of a stock can be found from the following: What happened to the expected sale price in this formula? Why is this an infinite sum? Is stock price independent of the investor’s holding period? V0 = Intrinsic Value of Stock Dt = Dividend in time t k = required return What happened to the expected sale price in this formula? The expected sale price is simply the present value at that point in time of all future dividends. Why is this an infinite sum? Because stocks are infinitely lived. Is stock price independent of the investor’s holding period? Yes, and this is a crucial point. Many uninitiated believe that because of the growth of day traders, and rapid stock trading that stock prices are determined based on short term prospects of the firm. If this model is correct, then this conclusion is untrue. We have had large scale failures in corporate governance and reward systems that promoted short term thinking by managers. 13-16

17
Basic Dividend Discount Model
Intrinsic value of a stock can be found from the following: This equation is not useable because it is an infinite sum of variable cash flows. Therefore we have to make assumptions about the dividends to make the model tractable. V0 = Intrinsic Value of Stock Dt = Dividend in time t k = required return 13-17

18
No Growth Model Use: Stocks that have earnings and dividends that are expected to remain constant over time (zero growth) Preferred Stock A preferred stock pays a $2.00 per share dividend and the stock has a required return of 10%. What is the most you should be willing to pay for the stock? 13-18

19
Constant Growth Model Use: Stocks that have earnings and dividends that are expected to grow at a constant rate forever A common stock share just paid a $2.00 per share dividend and the stock has a required return of 10%. Dividends are expected to grow at 6% per year forever. What is the most you should be willing to pay for the stock? 13-19

20
Comparing Value and Returns
Why do you have to pay more for the constant growth stock? Must pay for expected growth What is the one year rate of return for each stock? No Growth Stock V0 = $20.00 D = $2.00 V1 = Constant Growth Stock V0 = $53.00; D0 = $2.00 Point is that both stocks give an investor a 10% (pre-tax) return. Note that V1 can be found more easily as V0 x (1+g) = $53 x 1.06 = $56.18, also k = D1/P0 + g, as long as there is only one constant growth rate $2.00 / 0.10 = $20.00 13-20
 return. Note that V1 can be found more easily as V0 x (1+g) = $53 x 1.06 = $56.18, also k = D1/P0 + g, as long as there is only one constant growth rate. $2.00 / 0.10 = $")
21
Comparing Value and Returns
Both stocks given an investor a pre-tax return of 10%. Is one stock a better buy than the other? Not if both are actually priced at their intrinsic value (ignoring taxes). 13-21
")
22
Stock Prices and Investment Opportunities
g = growth rate in dividends is a function of two variables: ROE = Return on Equity for the firm b = plowback or retention percentage rate (1- dividend payout percentage rate) g increases if a firm increases its retention ratio and/or its ROE 13-22
 g increases if a firm increases its retention ratio and/or its ROE")
23
Value of Growth Opportunities
Value with 100% dividend payout Cash Cow, Inc. (CC) E1 = $5 D1 = $5 b = ; therefore g = k = 12.5% ; Find VCC ROE = 12.5% Growth Prospects (GP) E1 = $5 D1 = $5 b = 0; therefore g = 0 k = 12.5%, Find VGP ROE = 15% You can relate these two to the prior chapter. The cash cow is a mature firm without high ROI investments. The growth firm may be in the growth phase of the industry life cycle. Should either or both firms retain some earnings? 13-23
 E1 = $5. D1 = $5. b = ; therefore g = k = 12.5% ; Find VCC. ROE = 12.5% Growth Prospects (GP) E1 = $5. D1 = $5. b = 0; therefore g = 0. k = 12.5%, Find VGP. ROE = 15% You can relate these two to the prior chapter. The cash cow is a mature firm without high ROI investments. The growth firm may be in the growth phase of the industry life cycle. Should either or both firms retain some earnings")
24
Value of Growth Opportunities
Value with 40% dividend payout Cash Cow, Inc. (CC) E1 = $5 b = 60%; therefore g D1 = 0.40 x $5 = $2.00 k = 12.5%; Find VCC ROE = 12.5% CC value is the same, why? Growth Prospects (GP) E1 = $5 b = 60%; therefore g = 9% D1 = 0.40 x $5 = $2.00 k = 12.5%; Find VGP ROE = 15% GP Value has increased, why? 7.5% g = ROE x b, For CC g = 12.5 x 0.60 = 7.5%; For GP g = 15% x 0.60 = 9% CC value stays the same because the retained earnings is invested at the same rate as ROE, there is no economic value added. GP grows in value by retaining earnings because the funds are invested at a 15% return. CC should pay out all earnings as dividends and let investors choose where to put their money (in the absence of taxes) and GP should retain a sufficient amount of their earnings to fund all projects where the ROE > k. 13-24
 E1 = $5. b = 60%; therefore g. D1 = 0.40 x $5 = $2.00. k = 12.5%; Find VCC. ROE = 12.5% CC value is the same, why Growth Prospects (GP) E1 = $5 b = 60%; therefore g = 9% D1 = 0.40 x $5 = $2.00 k = 12.5%; Find VGP ROE = 15% GP Value has increased, why 7.5% g = ROE x b, For CC g = 12.5 x 0.60 = 7.5%; For GP g = 15% x 0.60 = 9% CC value stays the same because the retained earnings is invested at the same rate as ROE, there is no economic value added. GP grows in value by retaining earnings because the funds are invested at a 15% return. CC should pay out all earnings as dividends and let investors choose where to put their money (in the absence of taxes) and GP should retain a sufficient amount of their earnings to fund all projects where the ROE > k")
25
Value of Growth Opportunities
Value of assets in place for GP = $40.00 (value with all dividends paid out, with ROE = 12.5%) Value of growth opportunities with ROE = 15% may be inferred from the difference between the new VGP = $57.14 and the no growth value of $40.00 Thus the present value of growth opportunities (PVGO) = $ $40.00 = $17.14 Note that the PVGO equation is the intrinsic value at the current dividend policy of 40% payout, less the value of the firm under the old dividend policy of 100% payout. Note that in the latter case E1 = D1 so we can replace the D with the E. In general: 13-25
 Value of growth opportunities with ROE = 15% may be inferred from the difference between the new VGP = $57.14 and the no growth value of $40.00 Thus the present value of growth opportunities (PVGO) = $ $40.00 = $17.14 Note that the PVGO equation is the intrinsic value at the current dividend policy of 40% payout, less the value of the firm under the old dividend policy of 100% payout. Note that in the latter case E1 = D1 so we can replace the D with the E. In general:")
26
Figure 13.1 Dividend Growth for Two Earnings Reinvestment Policies
(for a given ROE) High reinvestment increases stock price only if ROE > k 13-26
 High reinvestment increases stock price only if ROE > k")
27
Multistage Growth Models
As firms progress through their industry life cycle, earnings and dividend growth rates (ROE) are likely to change. A two stage growth model: g1 = first growth rate g2 = second growth rate T = number of periods of growth at g1 13-27
 are likely to change. A two stage growth model: g1 = first growth rate. g2 = second growth rate. T = number of periods of growth at g")
28
Multistage Growth Rate Model: Example
D0 = $ g1 = 20% g2 = 5% k = 15% T = 3 D1 = D2 = D3 = D4 = 3.63 V0 = = $30.40 13-28

29
Table 13.2 Financial Ratios
13-29

30
Figure 13.2 Honda Motor 13-30

31
Two Stage DDM for Honda Year Dividend 2009 0.90 2010 0.98 2011 1.06 2012 1.15 From Value Line Dividends: Assume the dividend growth rate will be steady beyond Value Line forecasts b = 70% and ROE of 11.0%. What should be the long term growth rate? 13-31

32
Two Stage DDM for Honda The required rate of return: Honda = 1.05 Rf in 2008 = 3.5% Market risk premium = historical average of 8% From Value Line The market risk premium is assumed to equal the historical average. 13-32

33
Two Stage DDM for Honda Year Dividend 2009 0.90 2010 0.98 2011 1.06 2012 1.15 k = 11.90% g = 7.70% Find the intrinsic value Value Line reported the actual price = $21.37, so Honda was undervalued by $0.51 or about 2.4%. 13-33

34
Two Stage DDM for Honda Should we trust the valuation result? What if the beta is slightly incorrect, suppose it is 1.10 (< 5% error) rather than 1.05? Now k = 12.3% and the intrinsic value estimate V0= $19.98, reversing our conclusion that Honda is undervalued Year Dividend 2009 0.90 2010 0.98 2011 1.06 2012 1.15 Actual price = $21.37 13-34
 rather than 1.05 Now k = 12.3% and the intrinsic value estimate V0= $19.98, reversing our conclusion that Honda is undervalued Year. Dividend Actual price = $")
35
13.4 Price-Earnings (P/E) Ratios
13-35

36
P/E Ratio and Growth Opportunities
P/E Ratios are a function of two factors Required Rates of Return (k) (inverse relationship) Expected Growth in Dividends (direct relationship) Uses Estimate intrinsic value of stocks Conceptually equivalent to the constant growth DDM Extensively used by analysts and investors 13-36
 (inverse relationship) Expected Growth in Dividends (direct relationship) Uses. Estimate intrinsic value of stocks. Conceptually equivalent to the constant growth DDM. Extensively used by analysts and investors")
37
P/E, ROE and Growth With positive growth: With zero growth: If g = 0 then b should = 0 and the ratio simplifies to: Are the elements of the P/E ratio similar to the constant growth DDM? 13-37

38
Numerical Example: No Growth
E1 = $ g = 0 k = 12.5%; Find P/E and V0 P/E = 1/k = 1/.125 = 8 V0 = P/E x E1 = 8 x $2.50 = $20.00 13-38

39
Numerical Example with Growth
b = 60% ROE = 15%; k = 12.5% (1-b) = 40%, E0 = $2.50 Find the P/E and V0: g = ROE x b = 15% x 60% = 9% E1 = $2.50 (1.09) = $2.725 P/E = ( ) / ( ) = 11.4 V0 = P/E x E1 = 11.4 x $2.73 = $31.14 13-39
 = 40%, E0 = $2.50. Find the P/E and V0: g = ROE x b = 15% x 60% = 9% E1 = $2.50 (1.09) = $ P/E = ( ) / ( ) = V0 = P/E x E1 = 11.4 x $2.73 = $")
40
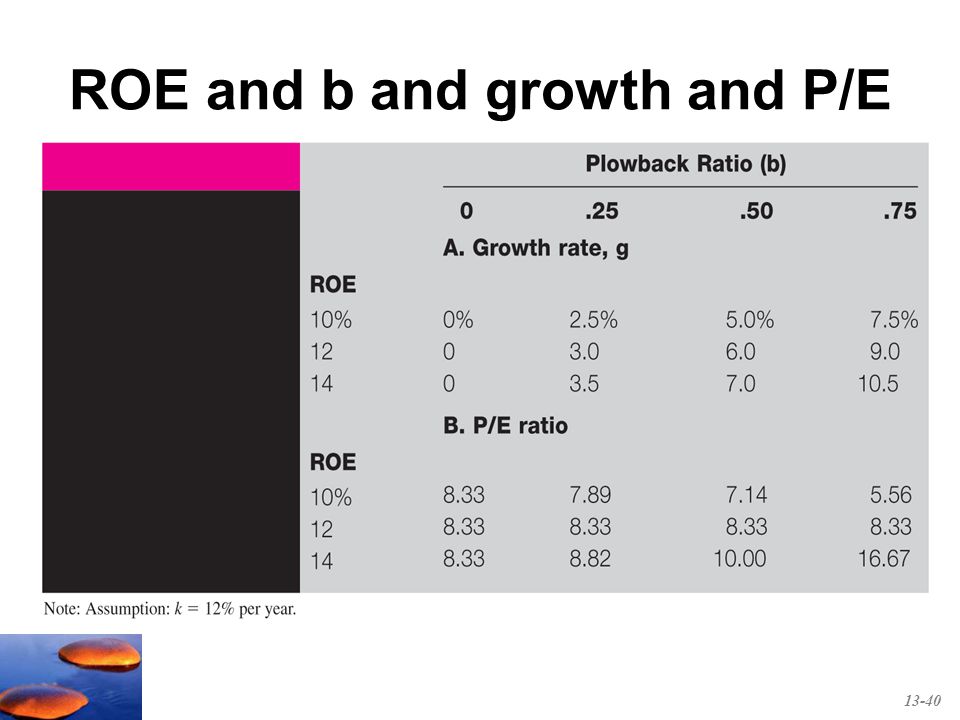
ROE and b and growth and P/E
13-40
41
P/E Ratios and Stock Risk
Riskier firms will have higher required rates of return (higher values of k) Riskier stocks will have lower P/E multiples 13-41
 Riskier stocks will have lower P/E multiples")
42
Pitfalls in Using P/E Ratios
Earnings management is a serious problem, P/E should be calculated using pro forma earnings, A high P/E implies high expected growth, but not necessarily high stock returns, Simplistic, assumes the future P/E will not be lower than the current P/E. If expected growth in earnings fails to materialize the P/E will fall and investors may incur large losses. 13-42

43
Figure 13.3 P/E Ratios and Inflation
13-43

44
Figure 13.4 Earnings Growth for Two Companies
13-44

45
Figure 13.5 Price-Earnings Ratios
13-45

46
Figure 13.6 P/E Ratios 13-46

47
Other Comparative Valuation Ratios
Price-to-book High ratio indicates a large premium over book value, and a ‘floor’ value that is often far below market price Price-to-cash flow P/Cash Flow instead of P/E; less subject to accounting manipulation Price-to-sales Useful for firms with low or negative earnings in early growth stage Be creative Be creative: Need to know the key variable(s) in an industry. For example, hits on a web page for some Internet firms, then can compare price/hits ratio. 13-47
 in an industry. For example, hits on a web page for some Internet firms, then can compare price/hits ratio")
48
Figure 13.7 Valuation Ratios for the S&P 500
13-48

49
13.5 Free Cash Flow Valuation Approaches
13-49

50
Free Cash Flow Capitalize or discount the free cash flow for the firm (FCFF) at the weighted-average cost of capital and then subtract the existing (market) value of debt Useful for firms that don’t pay dividends, Helpful to understand sources and uses of cash where: EBIT = earnings before interest and taxes Tc = the corporate tax rate NWC = net working capital If your students used the Ross, Westerfield and Jordan Fundamentals or Essentials of Corporate Finance texts for their introductory corporate course, you can remind them that the FCFF measure is Cash Flow From Assets (CFA) in that text. 13-50
 at the weighted-average cost of capital and then subtract the existing (market) value of debt. Useful for firms that don’t pay dividends, Helpful to understand sources and uses of cash. where: EBIT = earnings before interest and taxes. Tc = the corporate tax rate. NWC = net working capital. If your students used the Ross, Westerfield and Jordan Fundamentals or Essentials of Corporate Finance texts for their introductory corporate course, you can remind them that the FCFF measure is Cash Flow From Assets (CFA) in that text")
51
FCFF, Firm Value & Equity Value
The free cash flow methods discount year to year cash flows plus some estimate of the terminal value PT where WACC = Weighted average cost of capital g = estimate of long run growth in free cash flow T = time period when the firm approaches constant growth Equity value = Firm Value Firm Value – Market Value of Debt 13-51

52
Free Cash Flow (cont.) Another approach calculates the free cash flow to the equity holders (FCFE) and discounts the cash flows directly at the cost of equity, kE. Equity value can then be estimated as: 13-52
 and discounts the cash flows directly at the cost of equity, kE. Equity value can then be estimated as:")
53
FCF Valuation Example 13-53

54
Comparing the Valuation Models
In theory free cash flow approaches should provide the same estimate of intrinsic value as the dividend growth model In practice the various approaches often differ substantially Simplifying assumptions are used in all models The models establish ranges of likely intrinsic value Using multiple models forces rigorous thinking about the inputs 13-54

55
13.6 The Aggregate Stock Market
13-55
56
Earnings Multiplier Approach
Forecast corporate profits for the coming period for an index such as the S&P 500. Derive an estimate for the aggregate P/E ratio using long-term interest rates Based on the relationship between the ‘earnings yield’ or E/P ratio for the S&P 500 and the yield on 10 year Treasuries Product of the two forecasts is the estimate of the end-of-period level of the market The text states that this is the most popular approach to aggregate market forecasting Aggregate corporate profit forecasts are available from Standard & Poor’s, among others 13-56

57
Figure 13.8 Earnings Yield of the S&P 500 Versus 10-year Treasury Bond Yield
13-57

58
Earnings Multiplier Approach
2009 Data: Starting S&P500 level = 900 Treasury yield = 3.2% Implied Earnings Yield = 2.5% + 3.2% = 5.7% If E/P = 5.7% then P/E = 1 / = If forecast EPS = $55 what is the expected forecast for the S&P500 one year later and the % gain or loss? 13-58

59
Table 13.4 S&P 500 Index Forecasts
An analyst should not rely on a point estimate. Table 13.4 includes a simple scenario analysis. 13-59

Similar presentations


>")


 2.1. Case study 1 : buy side & sell side.>")


