Download presentation
Presentation is loading. Please wait.

1
Christophe Codourey Consultant BI Christophe.codourey@trivadis.com Trivadis SA Rue Marterey 5 CH-1005 Lausanne

2
SQL Server Catalog Report Server Programatic Interface (Web Service) WebUI Delivery Distribution (E-mail, File share, Userdefined) Security Services (NT, Passport, Custom) Security Data Sources (SQL, SharePoint, ODBC, Oracle, Custom) Report Processing Browser Custom App Format (HTML, Excel, PDF, Word, …) Data RetrievalRendering SharePoint Atom Feed Excel
 WebUI Delivery Distribution ( , File share, Userdefined) Security Services (NT, Passport, Custom) Security Data Sources (SQL, SharePoint, ODBC, Oracle, Custom) Report Processing Browser Custom App Format (HTML, Excel, PDF, Word, …) Data RetrievalRendering SharePoint Atom Feed Excel")
3
BI Dev Studio Report Builder 3.0 RDL

4
SQL Server Catalog Report Server Programatic Interface (Web Service) WebUI Delivery Distribution (E-mail, File share, Userdefined) Security Services (NT, Passport, Custom) Security Data Sources (SQL, SharePoint, ODBC, Oracle, Custom) Report Processing Browser Custom App (HTML, Excel, PDF, Word, …) Data RetrievalRendering SharePoint Atom Feed Excel
 WebUI Delivery Distribution ( , File share, Userdefined) Security Services (NT, Passport, Custom) Security Data Sources (SQL, SharePoint, ODBC, Oracle, Custom) Report Processing Browser Custom App (HTML, Excel, PDF, Word, …) Data RetrievalRendering SharePoint Atom Feed Excel")
5
Data extension supports SharePoint 2007/2010 sites Visual Query Designer SuperLeagueTeams

6
Available in SQL Server 2008 R2 Release Candidate T/SQL SQL Azure

7
SQL Server Catalog Report Server Programatic Interface (Web Service) WebUI Delivery Distribution (E-mail, File share, Userdefined) Security Services (NT, Passport, Custom) Security Data Sources (SQL, SharePoint, ODBC, Oracle, Custom) Report Processing Browser Custom App (HTML, Excel, PDF, Word, …) Data RetrievalRendering SharePoint Atom Feed Excel
 WebUI Delivery Distribution ( , File share, Userdefined) Security Services (NT, Passport, Custom) Security Data Sources (SQL, SharePoint, ODBC, Oracle, Custom) Report Processing Browser Custom App (HTML, Excel, PDF, Word, …) Data RetrievalRendering SharePoint Atom Feed Excel")
8
New text orientation option provides more flexibility to the report layout

9
More control over page breaks Tablix, Rectangle and Group =Globals!PageName & " Page: " & Globals!PageNumber & " of " &Globals!TotalPages ="Overall Page: " & Globals!OverallPageNumber & " of " & Globals!OverallTotalPages

10
Use expressions to determine what renderer is being used Dynamically disable/enable page breaks Disable page breaks if exporting to Excel.

11
Control layout and write expressions that consider renderer format Dynamically disable drill through expressions for non-interactive renderers and enable them for interactive ones

12
Nesting of aggregate functions is now supported e.g. Average Month Sales =Avg(Sum(Quantity, "Quarter"), "Year") AVG SUM AVG
, Year ) AVG SUM AVG.")
13
Datasets can be shared, stored, processed and cached externally from the report. Cache refresh plans work on cached reports or shared dataset query results On first use Via a schedule

14
Values from one DataSet can be used to get Value(s) from another DataSet Lookup (1:1) MultiLookup Get multiple values, -> Param 1 is an array LookupSet (1:n) E.g. Get all phone nr from a selected customer =Lookup(Fields!TeamA.Value,Fields!Title.Value,Fields!ShortName.Value,"SuperLeagueTeam")
.")
15
SQL Server Catalog Report Server Programatic Interface (Web Service) WebUI Delivery Distribution (E-mail, File share, Userdefined) Security Services (NT, Passport, Custom) Security Data Sources (SQL, SharePoint, ODBC, Oracle, Custom) Report Processing Browser Custom App (HTML, Excel, PDF, Word, …) Data RetrievalRendering SharePoint Atom Feed Excel
 WebUI Delivery Distribution ( , File share, Userdefined) Security Services (NT, Passport, Custom) Security Data Sources (SQL, SharePoint, ODBC, Oracle, Custom) Report Processing Browser Custom App (HTML, Excel, PDF, Word, …) Data RetrievalRendering SharePoint Atom Feed Excel")
16
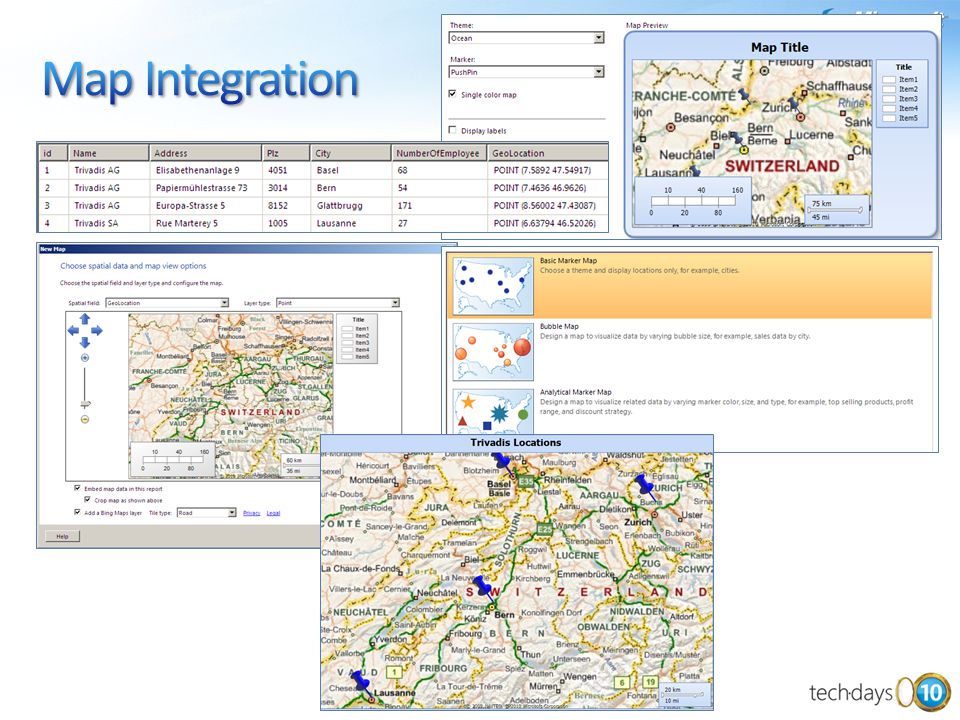
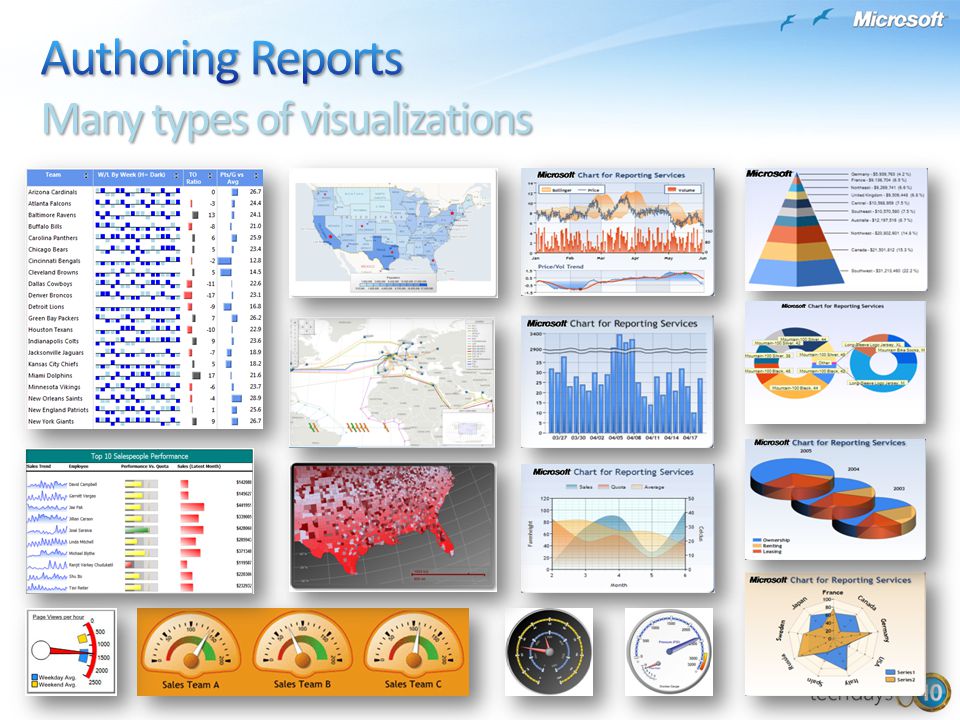
SQL 2005 Chart SQL 2005SQL 2008 Chart Multiple areas Multiple axes Calculated series Gauge Bullet graph SQL 2005SQL 2008SQL 2008 R2 Chart Multiple areas Multiple axes Calculated series Gauge Bullet graph Map NEW! SQL spatial NEW! Bing™ support NEW! Sparkline NEW! Data Bar NEW! Indicator NEW!

17
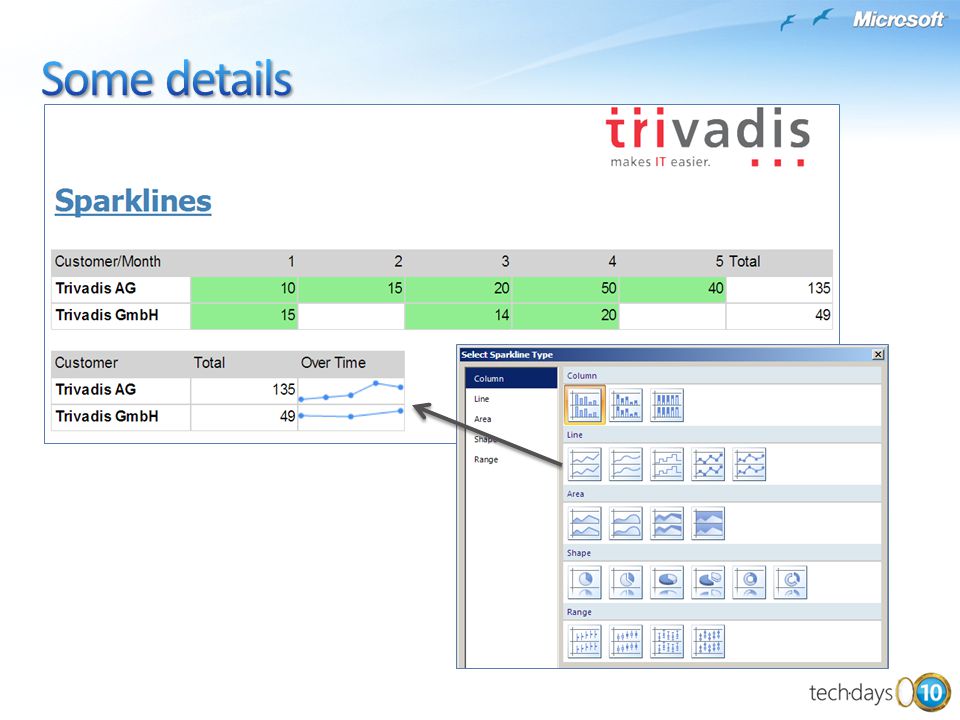
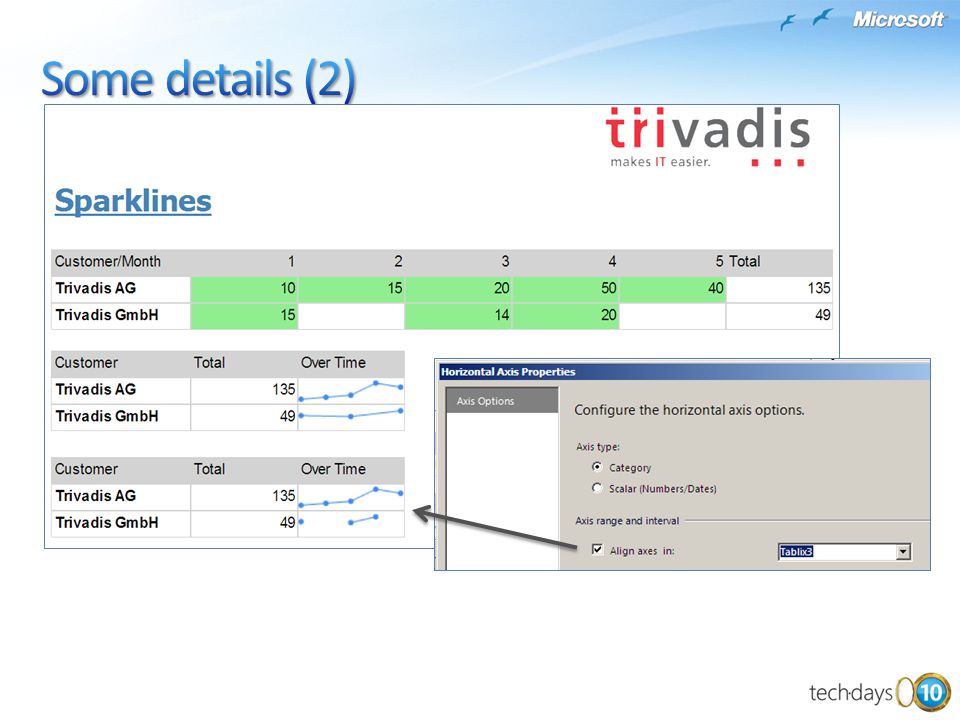
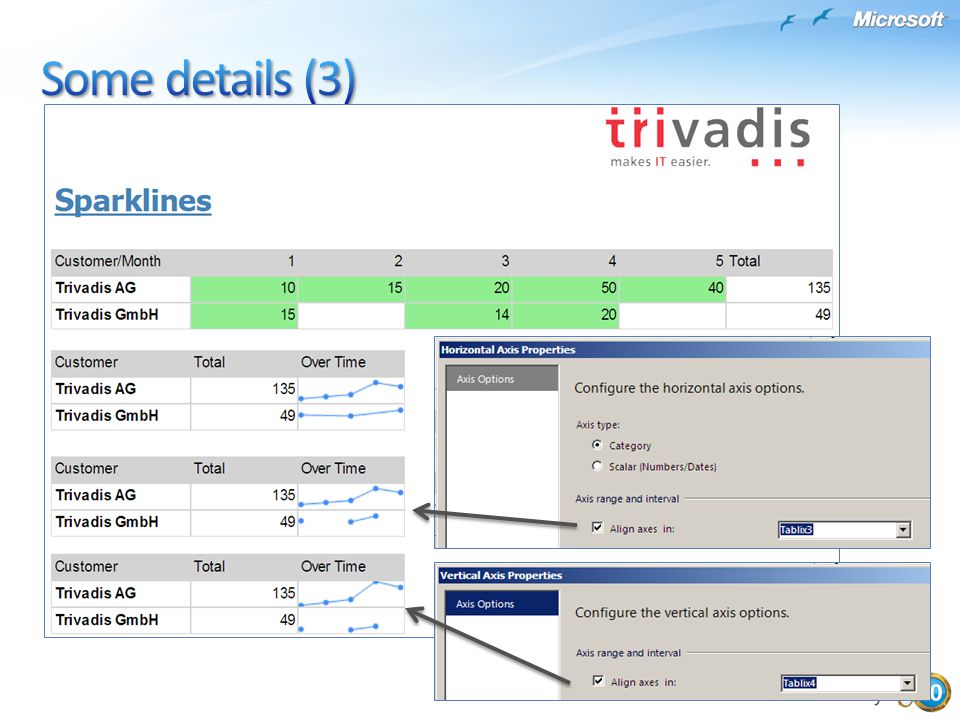
SparklinesSparklines Sparklines “Data intense, word-sized graphics” – Invented by Edward Tufte Automatic axis alignment. All charts will have the same number of data points, regardless of source data. Convertable into full charts Data Bars Show a single value in a cell. Min and Max are automatically determined, but are configurable. Data Bars

18
= iif(Fields!HomeGame.Value = 1, "Blue", "LightBlue") = Fields!TeamB.Value & " " & Fields!Result.Value
 = Fields!TeamB.Value & & Fields!Result.Value")
19
Sparklines are regular charts with predifined property values

23
Icons Show status against a value, a goal or a trend Own Icon Sets can be created by Report Author Color, icon and size can be changed based on data Automatic support for comparing each member of a group against siblings IndicatorsIndicators

24
Stepped or Block grouping Pivot Custom Subtotals Non-pivot columns Nested controls Multi-Pivot Custom Headers

26
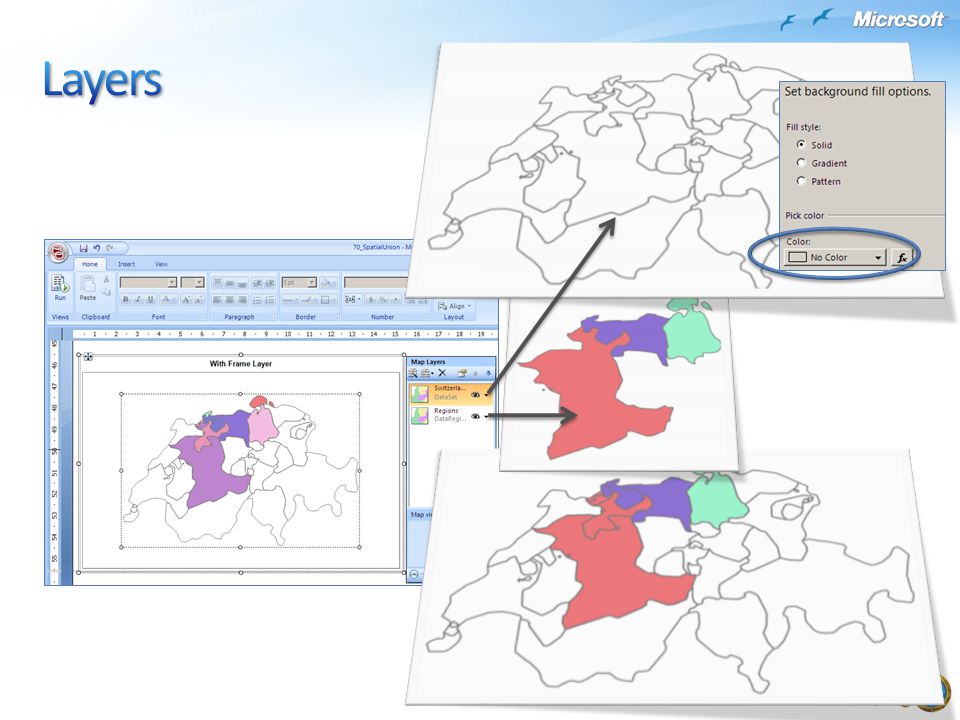
The product team currently plans on publishing links (Books On-Line/MSDN) to a number of map file providers when the product releases. However, we do not have a list that we can release at this time. Europe shape Files: http://www.cdc.gov/epiinfo/europe.htm

27
SZ.SHP http://www.sharpgis.net/page/shape2sql.aspx

28
Works currently only in Report Builder

31
SQL Server Catalog Report Server Programatic Interface (Web Service) WebUI Delivery Distribution (E-mail, File share, Userdefined) Security Services (NT, Passport, Custom) Security Data Sources (SQL, SharePoint, ODBC, Oracle, Custom) Report Processing Browser Custom App (HTML, Excel, PDF, Word, …) Data RetrievalRendering SharePoint Atom Feed Excel
 WebUI Delivery Distribution ( , File share, Userdefined) Security Services (NT, Passport, Custom) Security Data Sources (SQL, SharePoint, ODBC, Oracle, Custom) Report Processing Browser Custom App (HTML, Excel, PDF, Word, …) Data RetrievalRendering SharePoint Atom Feed Excel")
32
More intuitive UI Search Support Manage Report without rendering

33
Publish report items to the catalog for re-use Users can mix & mash different report items for their desired views

35
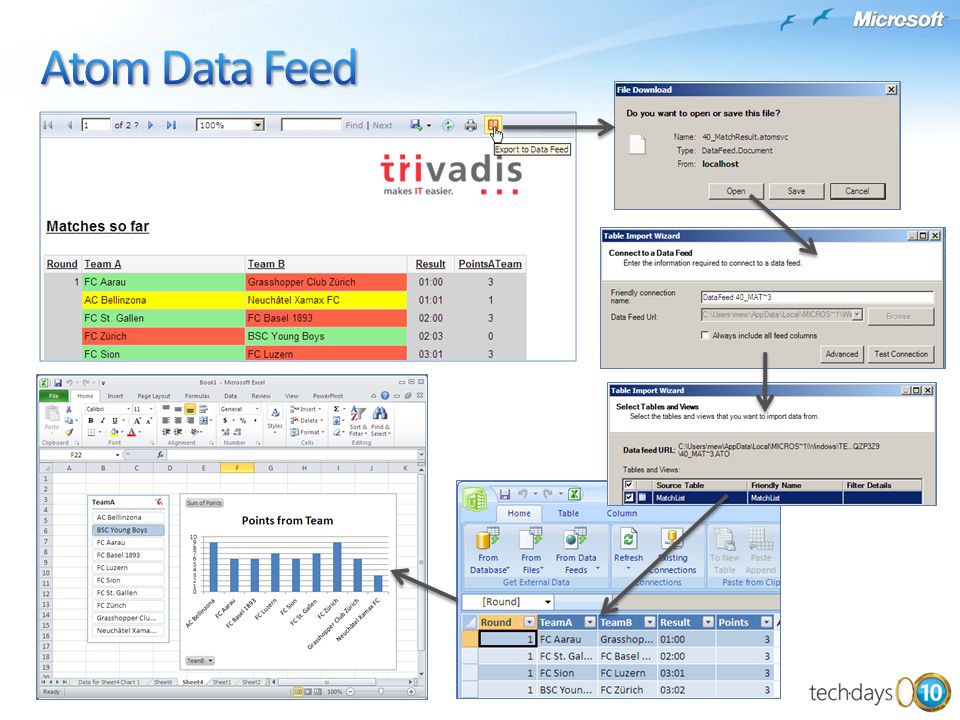
string uri ="http://.../ReportServer?/Dir/MatchResult&rs:Command=Render &rs:Format=ATOM&rc:DataFeed=xAx0x1"; var client = new WebClient(); client.Credentials = CredentialCache.DefaultCredentials; Stream atomStream = client.OpenRead(uri); XDocument document = XDocument.Load(atomStream); var query = from feed in document.Descendants(XName.Get("properties", "http://schemas.microsoft.com/ado/2007/08/dataservices/metadata")) select new { TeamA = feed.Element(XName.Get("TeamA", "http://schemas.microsoft.com/ado/2007/08/dataservices")).Value, TeamB = feed.Element(XName.Get("TeamB", "http://schemas.microsoft.com/ado/2007/08/dataservices")).Value, }; ResultList.ItemsSource = query.ToList(); Feed-ID
; client.Credentials = CredentialCache.DefaultCredentials; Stream atomStream = client.OpenRead(uri); XDocument document = XDocument.Load(atomStream); var query = from feed in document.Descendants(XName.Get( properties , )) select new { TeamA = feed.Element(XName.Get( TeamA , )).Value, TeamB = feed.Element(XName.Get( TeamB , )).Value, }; ResultList.ItemsSource = query.ToList(); Feed-ID")
36
<feed xmlns:d="http://schemas.microsoft.com/ado/2007/08/dataservices" xmlns:m="http://schemas.microsoft.com/ado/2007/08/dataservices/metadata" xmlns="http://www.w3.org/2005/Atom"> uuid:0957b3c6-2d59-46b7-bcd8-ed0cfd5a48b0;id=2351 2010-03-29T06:44:25Z uuid:0957b3c6-2d59-46b7-bcd8-ed0cfd5a48b0;id=2352 2010-03-29T06:44:25Z 1 FC Aarau Grasshopper Club Zürich 01:00 3 uuid:0957b3c6-2d59-46b7-bcd8-ed0cfd5a48b0;id=2353...

37
Additional data sources, detail improvements for report authoring and data distribution SharePoint Lists, SQL Azure Page breaks, text rotation, info of render format, aggregates of aggregates Shared datasets Atom data feed New features in the area of better data visualization Data Bars Sparklines Indicators High flexibility for displaying Spatial Data Shape Files Bing Maps It’s not a revolution but the next evolution level Release 3.0 ;-)
")
38
For more Information please contact Christophe Codourey Consultant BI Christophe.Codourey@trivadis.com Trivadis SA Rue Marterey 5 CH-1005 Lausanne

Similar presentations


 features Compatibility experience and issues Missing cube.>")


 views Interactive analysis.>")


 아이티즌 서정만 선임연구원>")


