Download presentation
Presentation is loading. Please wait.

1
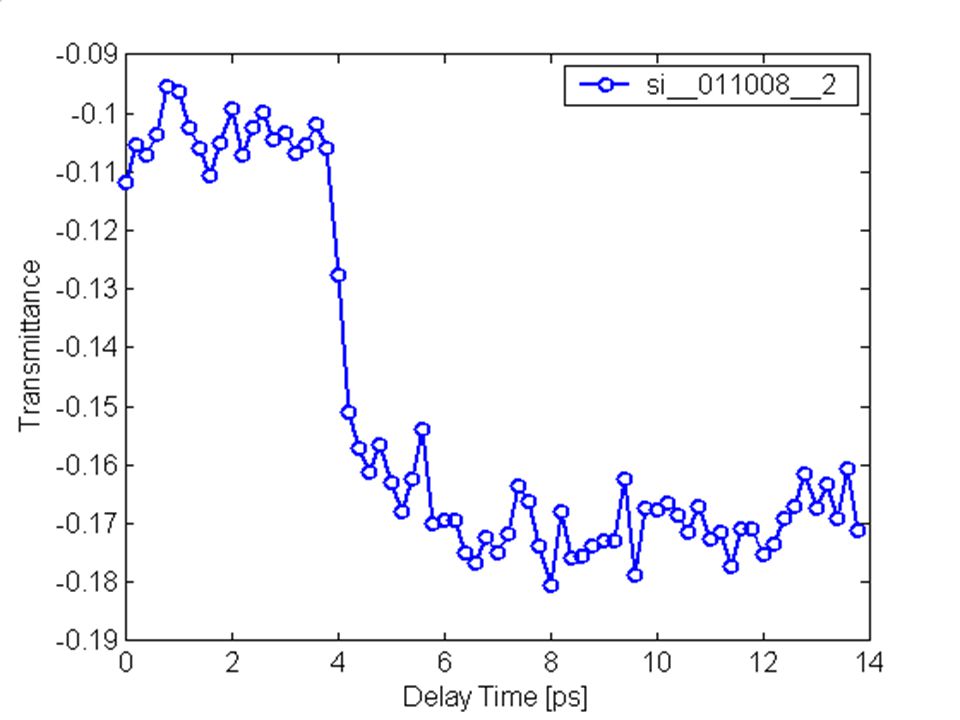
January 10, 2008 Update description of slides Slide 1: This is the response of Silicon when pumped with 800 nm, probed with mid-IR –FWHM of pulse ~150 fs (i.e. resolution) –Scanning step = 200 fs –Scan range: 14 ps –time zero established (t = 4 ps) as well as optimal alignment –when 400 nm filter is put in, a delay of ~ 1ps is introduced to time zero
 –Scanning step = 200 fs –Scan range: 14 ps –time zero established (t = 4 ps) as well as optimal alignment –when 400 nm filter is put in, a delay of ~ 1ps is introduced to time zero.")
3
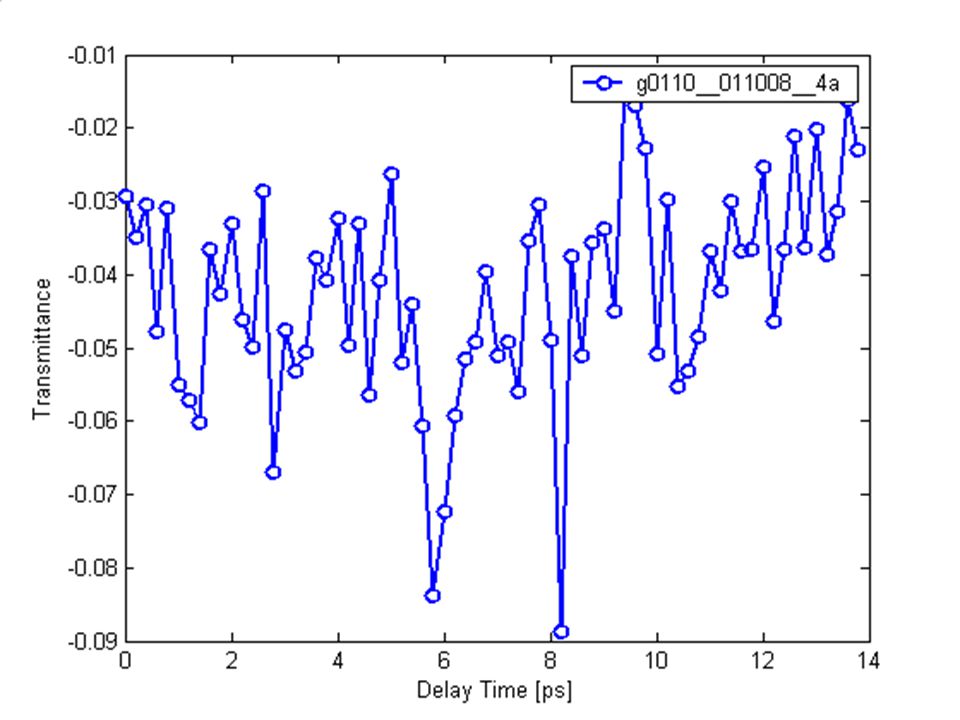
Slide 2: This is a raw trace of your most recent sample, g0110 –400 nm filter inserted, replace Si with sample –note: the drop in transmittance near 5 ps –note: noise, especially the spurious peak at 8.2 ps –conclusion: short transient, need to average several traces

5
Slide 3: This is an average of 5 separate traces –sample translated between each trace –transient intraband signal is more evident now –automatically shift x-axis to display t = 0 –gridlines show: –several hundred fs “rise time” (i.e. time it takes e- to go into CB) –everything is over in 3 ps; thus, the time constant here is clearly NOT 3 ps … I’ll have to fit this later
 –everything is over in 3 ps; thus, the time constant here is clearly NOT 3 ps … I’ll have to fit this later.")
Similar presentations


 ● Standard Definitions ● Computing the DFT and FFT ● Sine and cosine wave multiplication.>")


 November 29 th 2010 1 Ben Rotter.>")


