Download presentation
Presentation is loading. Please wait.

1
Chapter 3 Data Description Section 3-2 Measures of Central Tendency

2
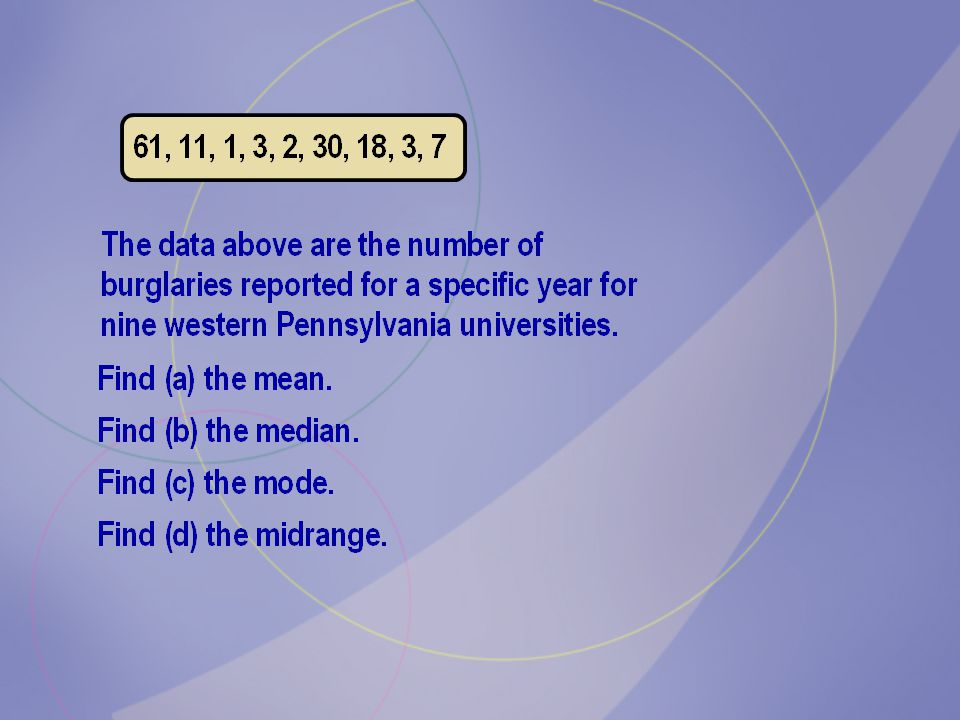
Chapter 3 Data Description Section 3-2 Exercise #3

5
MD: 1, 2, 3, 3, 7, 11, 18, 30, 61 MD: 7

8
MD: 1, 2, 3, 3, 7, 11, 18, 30, 61

10
Chapter 3 Data Description Section 3-2 Exercise #5

11
Find (a) the mean, (b) the median, (c) the mode, and (d) the midrange.
 the mean, (b) the median, (c) the mode, and (d) the midrange.")
12
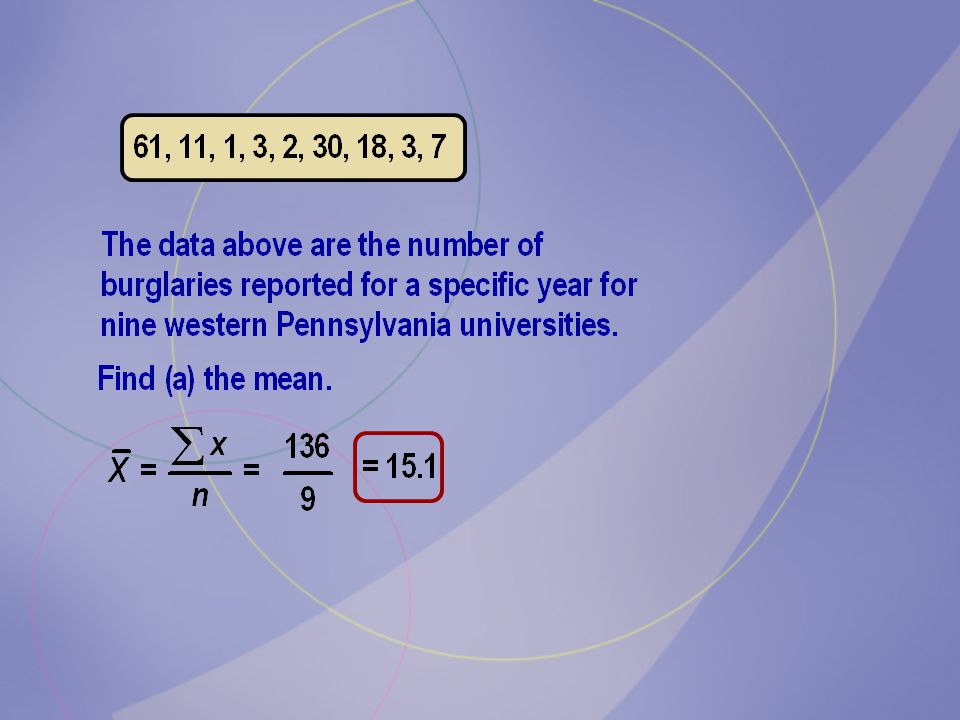
(a)
")
13
(b) Arrange data in increasing order: 75 88 117 136 189 229 239 372 465 574 663 1202 median
 Arrange data in increasing order: median")
14
(b) Arrange data in increasing order:
 Arrange data in increasing order:")
15
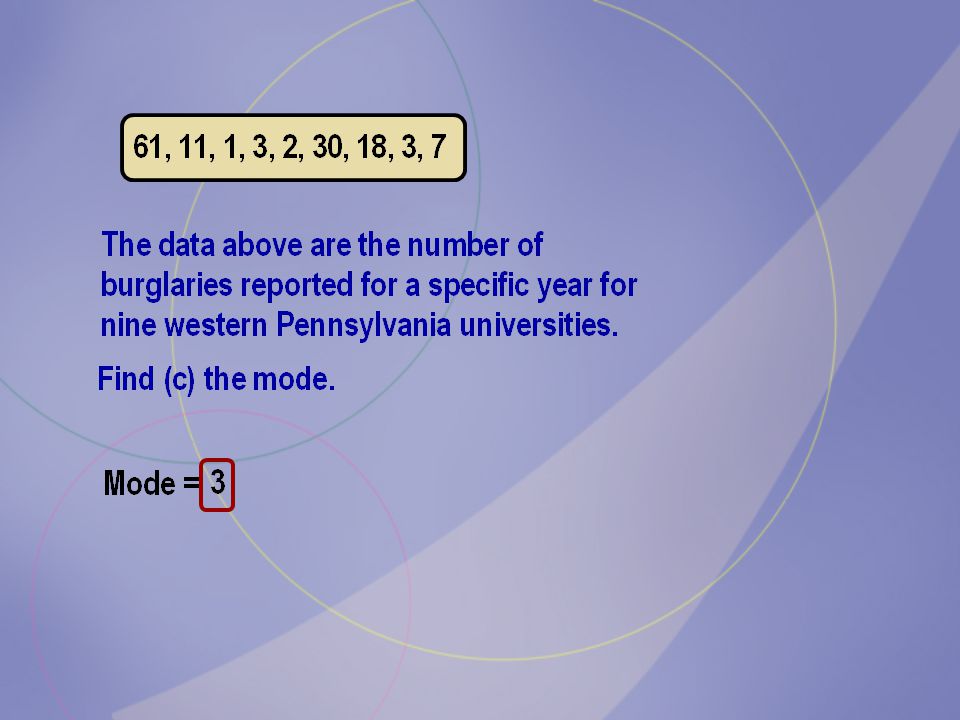
(c) No data are repeated. No mode.
 No data are repeated. No mode.")
16
(d) Arrange data in increasing order.
 Arrange data in increasing order.")
18
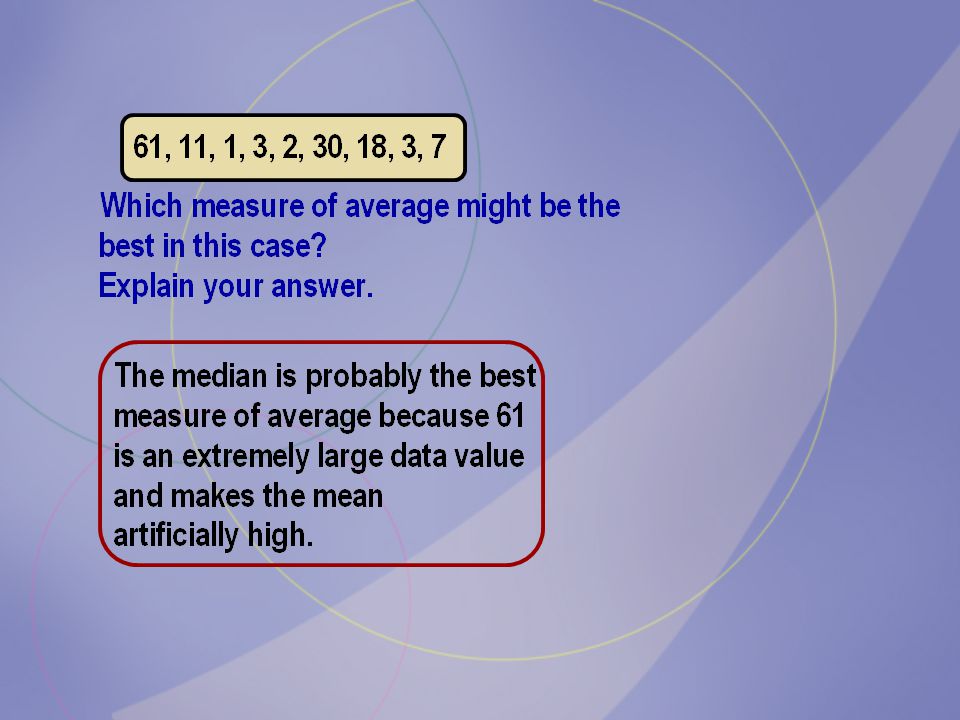
It seems that the average number of identity thefts is higher than 300.

19
Section 3-2 Exercise #17 Chapter 3 Data Description

20
5107.5-118.5 1496.5-107.5 1885.5-96.5 2574.5-85.5 1263.5-74.5 652.5-63.5 FrequencyClass Boundaries

21
107.5 – 118.5 96.5 – 107.5 85.5 – 96.5 74.5 – 85.5 63.5 – 74.5 52.5 – 63.5 Boundaries 8281269 348658 20002580 16381891 142814102 5655113 6807 80

22
modal class: 74.5 – 85.5

23
Section 3-2 Exercise #19 Chapter 3 Data Description

24
Find the (a) mean and (b) modal class. 262-68 055-61 148-54 641-47 534-40 1227-33 720-26 213-19 FrequencyClass Limits

25
62 – 68 55 – 61 48 – 54 41 – 47 34 – 40 27 – 33 20 – 26 13 – 19 Class 54.5 – 61.5 61.5 – 68.5 47.5 – 54.5 40.5 – 47.5 33.5 – 40.5 26.5 – 33.5 19.5 – 26.5 12.5 – 19.5 f X m fXmXm Boundarie s limits 32216 161723 3601230 185537 264644 511 0058 130265 35 1183

26
modal class: 26.5 – 33.5 Find the (a) mean and (b) modal class.
 mean and (b) modal class.")
27
Chapter 3 Data Description Section 3-3 Exercise #7

28
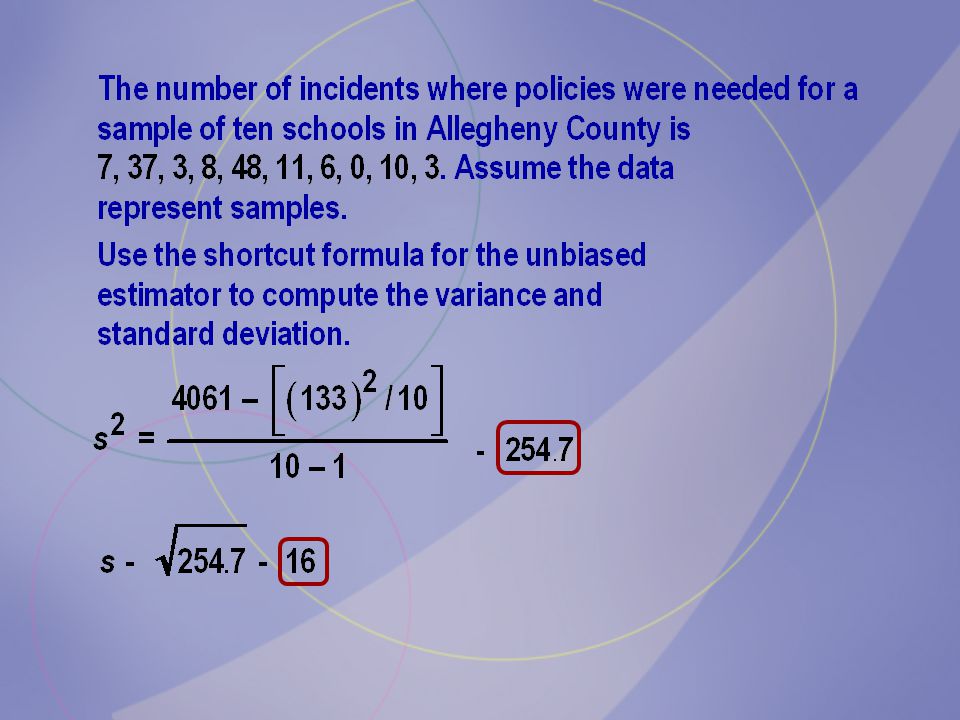
Find the range. range = 48 – 0 = 48

29
n = 10

31
range = 48 s 2 = 254.7 s = 16 By any of these measures, it can be said that the data can vary.

32
Chapter 3 Data Description Section 3-3 Exercise #21

33
2539-602 1475-539 0411-474 2347-410 0283-346 5219-282 0155-218 291-154 1327-90 f Number

34
2 1 0 2 0 5 0 2 13 1141 506.5 0 757 0 1252.5 0 245 760.5 650,940.5 256,542.25 0 286,524.5 0 313,751.25 0 30,012.5 44,489.25 570.5 506.5 442.5 378.5 314.5 250.5 186.5 122.5 58.5 539-602 475-538 411-474 347-410 283-346 219-282 155-218 91-154 27-90 Class f

37
Section 3-3 Exercise #33 Chapter 3 Data Description

40
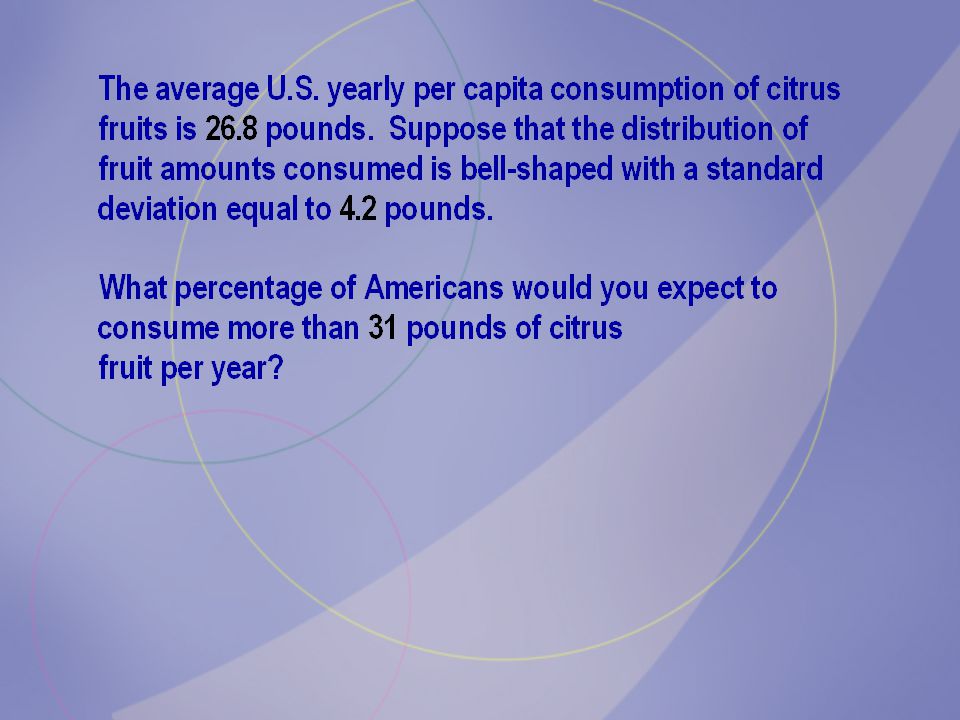
Chapter 3 Data Description Section 3-3 Exercise #41

42
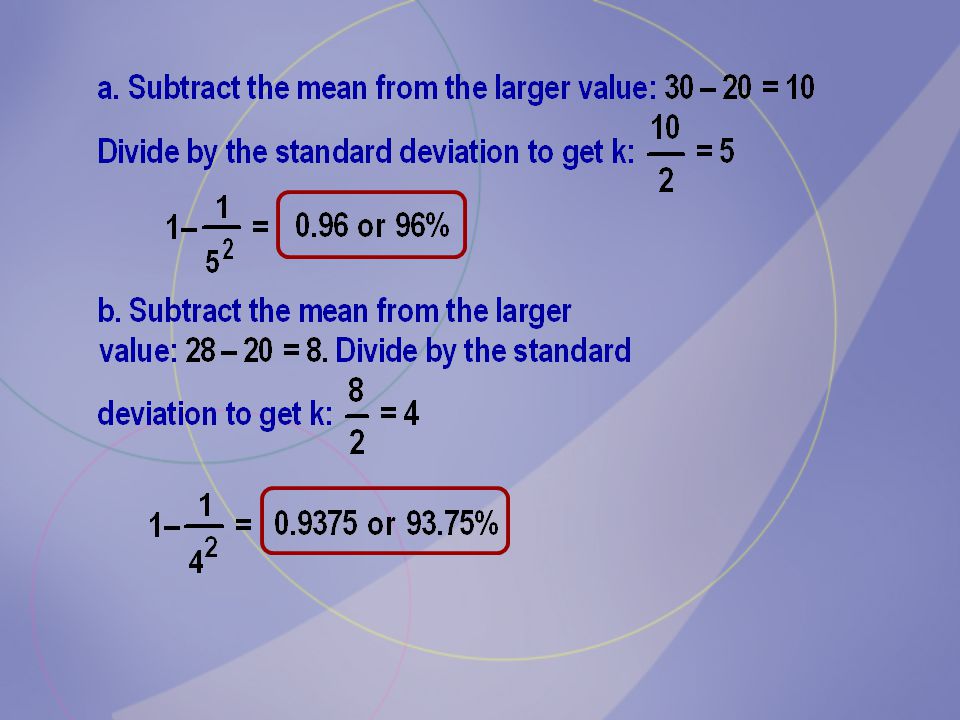
22.6 31 26.8 34% 16%

43
Chapter 3 Data Description Section 3-4 Exercise #13

45
Section 3-4 Exercise #22 Chapter 3 Data Description

47
For 78, For 82, For 86,

48
For 88, For 92, For 97,

49
Chapter 3 Data Description Section 3-4 Exercise #23

50
Therefore, the answer is the 2 nd in the series, or 82.

51
Chapter 3 Data Description Section 3-5 Exercise #1

52
Minimum: Q1:Q1: Median: Q3:Q3: Maximum: Interquartile Range: Data arranged in order: 6, 8, 12, 19, 27, 32, 54 Identify the five number summary and find the interquartile range. 8, 12, 32, 6, 27, 19, 54 32 19 8 6 54

53
Chapter 3 Data Description Section 3-5 Exercise #9

54
Minimum: Q1:Q1: Median: Q3:Q3: Maximum: Interquartile Range: 55 65 70 90 95 10095908580757065605550

55
Section 3-5 Exercise #15 Chapter 3 Data Description

56
9.88.013.94.43.921.7 15.93.211.724.834.117.6 03530252015105

57
Data arranged in order : Minimum: Q1:Q1: MD: Q3:Q3: Maximum: 3.2 34.1 9.88.013.94.43.921.7 15.93.211.724.834.117.6

58
Comment on the skewness of the data. 35302520151050 3.234.1 12.8 19.65 6.2 The distribution is positively skewed.

59
Chapter 3 Data Description Section 3-5 Exercise #16

60
50,000 52,435 62,850 66,500 77,700 78,008 92,000 125,628 United States 46,563 56,242 102,014 105,944 274,026 311,539 South America

61
For USA: 50,000 52,435 62,850 66,500 77,700 78,008 92,000 125,628 United States 125,628 72,100 50 100 150 200 250 300 350

62
For South America: 46,563 56,242 102,014 105,944 274,026 311,539 South America 50 100 150 200 250 300 311,539 103,979

63
125,628 72,100 50 100 150 200 250 300 311,539 103,979 South America USA Compare the distributions:

Similar presentations


 MSIS 111 Prof. Nick Dedeke.>")


!>")


 2007 IUPUI SPEA K300 (4392) Outline: Numerical Methods Measures of Central Tendency Representative value Mean Median, mode, midrange Measures of Dispersion.>")