Download presentation
Presentation is loading. Please wait.

1
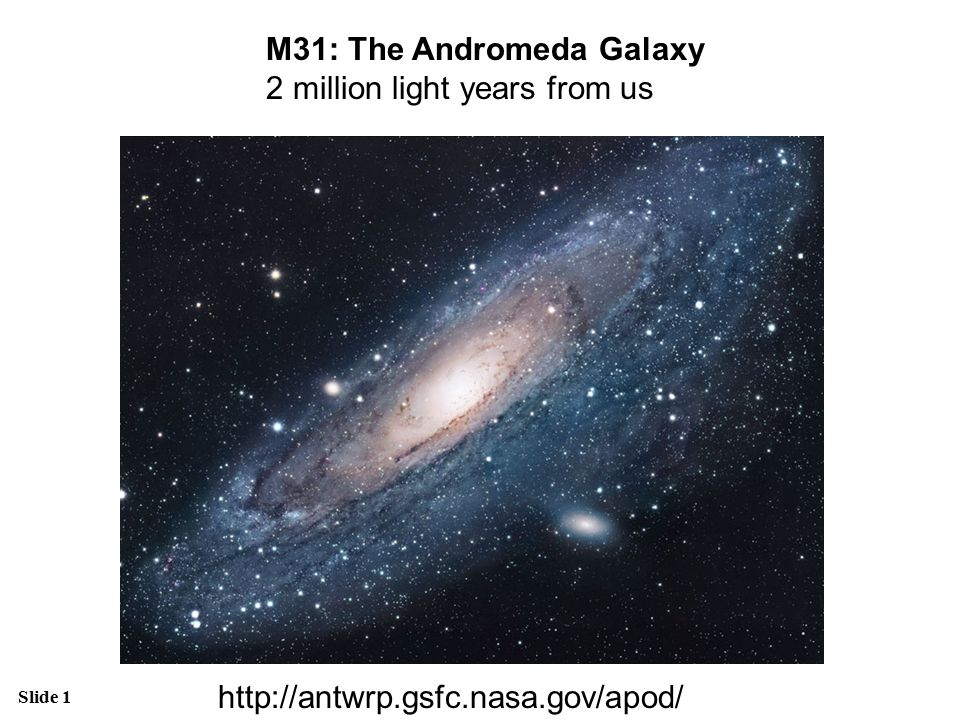
M31: The Andromeda Galaxy 2 million light years from us
2
Milky Way Galaxy 200 billion stars Galactic year = 225 million yr
25,000 light years, Or ~ 8 kpc Figure 1.11: (© Anglo-Australian Telescope Board) 200 billion stars Galactic year = 225 million yr Our sun is 4.6 billion yr old 1 pc = 3.26 ly
 200 billion stars. Galactic year = 225 million yr. Our sun is 4.6 billion yr old. 1 pc = 3.26 ly.")
3
“Milky Way” – a milky patch of stars that rings the Earth
Galactos = milk in Greek

4
Galileo found that the Milky Way is made up of stars

5
The Structure of the Milky Way (1)
Disk Nuclear Bulge Sun Halo Globular Clusters

6
Local group: ~ 30 galaxies
Figure 13.8: (a) The Local Group. Our galaxy is located at the center of this diagram. The vertical lines giving distances from the plane of the Milky Way are solid above the plane and dashed below.
 The Local Group. Our galaxy is located at the center of this diagram. The vertical lines giving distances from the plane of the Milky Way are solid above the plane and dashed below.")
7
Galaxy M31 in Andromeda – similar to the Milky Way Galaxy
1 Mpc from us Figure 12.1: (a) This photograph of the Great Galaxy in Andromeda, a spiral galaxy about 2.3 million ly from us, shows us what our Milky Way Galaxy would look like if we could view it from such a great distance. (AURA/NOAO/NSF)
 This photograph of the Great Galaxy in Andromeda, a spiral galaxy about 2.3 million ly from us, shows us what our Milky Way Galaxy would look like if we could view it from such a great distance. (AURA/NOAO/NSF)")
8
The Structure of the Milky Way (2)
Galactic Plane Galactic Center The structure is hard to determine because: 1) We are inside 2) Distance measurements are difficult 3) Our view towards the center is obscured by gas and dust
 We are inside. 2) Distance measurements are difficult. 3) Our view towards the center is obscured by gas and dust.")
9
William and Caroline Herschel, 1785
Figure 12.2: In 1785, William Herschel published this diagram showing the star system as a thick disk seen edge on. The sun is located near the center of this grindstone universe. Herschel could not see very far because of the interstellar gas and dust. He concluded that we live near the center of a relatively small disk of stars.

10
Strategies to Explore the Structure of Our Milky Way
I. Select bright objects that you can see throughout the Milky Way and trace their directions and distances II. Observe objects at wavelengths other than visible (to circumvent the problem of optical obscuration), and catalogue their directions and distances III. Trace the orbital velocities of objects in different directions relative to our position
, and catalogue their directions and distances. III. Trace the orbital velocities of objects in different directions relative to our position.")
11
The key to determining the size and the shape of the Galaxy: measure the distances to the most distant stars and star clusters Parallax works only for the closest stars within 500 pc To probe the distance at larger scales, we must find standard candles – very bright objects of known luminosity (or absolute magnitude) Then we can measure their intensities or apparent magnitudes and find the distance using the inverse square law: R d
 Then we can measure their intensities or apparent magnitudes and find the distance using the inverse square law: R. d.")
12
The key to the distance scale in the Universe: variable stars cepheids
Henrietta Leavitt ( ) Discovered and catalogued over 2000 variable stars in Small Magellanic Cloud
 Discovered and catalogued over 2000 variable stars in Small Magellanic Cloud.")
13
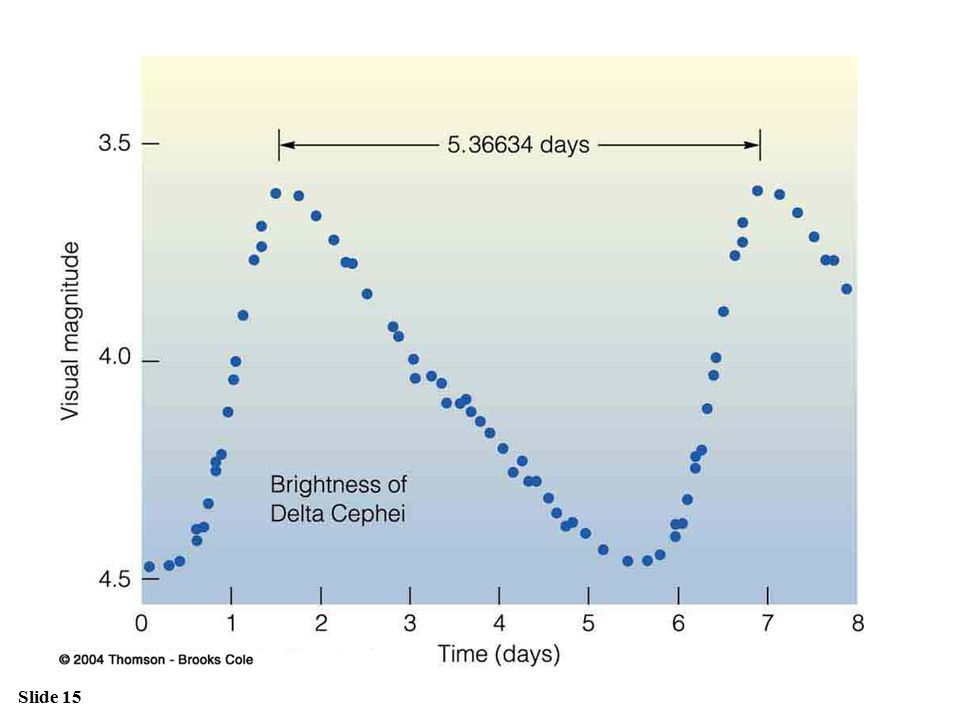
Delta Cephei Discovered in 1784 by John Goodricke (deaf-mute)
")
14
Also explained a puzzle of Algol!
John Goodricke

16
Leavitt noticed that the brightest variable stars had longest periods

17
Period-magnitude dependence for cepheids in SMC

18
Period-luminosity relation
Since all cepheids in SMC are at the same distance from us, the same relationship should be between their periods and absolute magnitudes! Average magnitude M<V> Period (log P) 0.4 2.0 1.4 0.8 0.6 1.0 1.2 1.6 1.8 -2 -7 -5 -6 -4 -3 Leavitt did not know the distance to SMC and could not calibrate this relation. It was done by Shapley
 Leavitt did not know the distance to SMC and could not calibrate this relation. It was done by Shapley.")
19
Proposed to use globular clusters as tracers of the mass distribution in our Galaxy
Harlow Shapley ( )
")
20
Exploring the Galaxy Using Clusters of Stars
Two types of star clusters: Open clusters h and c Persei 1) Open clusters: young clusters of recently formed stars; within the disk of the Galaxy 2) Globular clusters: old, centrally concentrated clusters of stars; mostly in a halo around the Galaxy Globular Cluster M 19
 Open clusters: young clusters of recently formed stars; within the disk of the Galaxy. 2) Globular clusters: old, centrally concentrated clusters of stars; mostly in a halo around the Galaxy. Globular Cluster M 19.")
21
Globular Clusters Dense clusters of 50,000 – 1 million stars
Old (~ 11 billion years), lower-main-sequence stars Approx. 200 globular clusters in our Milky Way Globular Cluster M80
, lower-main-sequence stars. Approx. 200 globular clusters in our Milky Way. Globular Cluster M80.")
22
Locating the Center of the Milky Way
Distribution of globular clusters is not centered on the sun… …but on a location which is heavily obscured from direct (visual) observation
 observation.")
23
Figure 12.6: (b) Looking toward Sagittarius, we see nothing to suggest this is the center of the galaxy. Gas and dust block our view. Only the distribution of globular clusters told Shapley the sun lay far from the center of the star system. (Daniel Good)
.")
24
Infrared View of the Milky Way
Near infrared image Interstellar dust (absorbing optical light) emits mostly infrared Galactic Plane Nuclear bulge Infrared emission is not strongly absorbed and provides a clear view throughout the Milky Way
 emits mostly infrared. Galactic Plane. Nuclear bulge. Infrared emission is not strongly absorbed and provides a clear view throughout the Milky Way.")
25
Cepheid Distance Measurements
Comparing absolute and apparent magnitudes of Cepheids, we can measure their distances (using the 1/d2 law)! The Cepheid distance measurements were the first distance determinations that worked out to distances beyond our Milky Way! Cepheids are up to ~ 40,000 times more luminous than our sun => can be identified in other galaxies.
! The Cepheid distance measurements were the first distance determinations that worked out to distances beyond our Milky Way! Cepheids are up to ~ 40,000 times more luminous than our sun. => can be identified in other galaxies.")
26
Cepheids help to determine distances to other galaxies

27
Cepheid Variables: The Period-Luminosity Relation
The variability period of a Cepheid variable is correlated with its luminosity. The more luminous it is, the more slowly it pulsates. => Measuring a Cepheid’s period, we can determine its absolute magnitude!

28
What are cepheids??

29
Cepheids: what happens when the balance between the thermal pressure and gravity becomes unstable

30
Pulsating Variables: The Instability Strip
For specific combinations of radius and temperature, stars can maintain periodic oscillations. Those combinations correspond to locations in the Instability Strip Cepheids pulsate with radius changes of ~ 5 – 10 %.

31
There are several different types of variable stars
-2 2 4 6 5.0 4.5 4.0 3.5 log Teff log (L/L) Main Sequence Solar-type stars Mira LPVs Cepheids Irregular LPVs DBVs DDVs PNNVs Instability Strip Classical Cepheids RR Lyrae Scutis VW Virginis ZZ Ceti (DAVs) There are several different types of variable stars
 Main Sequence. Solar-type stars. Mira LPVs. Cepheids. Irregular LPVs. DBVs. DDVs. PNNVs. Instability Strip. Classical Cepheids. RR Lyrae. Scutis. VW Virginis. ZZ Ceti (DAVs) There are several different types of variable stars.")
32
Mechanism of pulsations: the battle between opacity, the temperature and gravity
Explained by Sergei Zhevakin in 1950s

33
A simple pulsation cycle
At one point in the pulsation cycle, a layer of stellar material loses support against the star’s gravity and falls inwards. This inward motion tends to compress the layer, which heats up and becomes more opaque to radiation. Since radiation diffuses more slowly through the layer (as a consequence of its increased opacity), heat builds up beneath it. N.B. These diagrams are definitely not to scale!!
, heat builds up beneath it. N.B. These diagrams are definitely not to scale!!")
34
A simple pulsation cycle 2
The pressure rises below the layer, pushing it outwards. As it moves outwards, the layer expands, cools, and becomes more transparent to radiation. Energy can now escape from below the layer, and pressure beneath the layer drops. The layer falls inwards and the cycle repeats.

35
This animation illustrates two stellar pulsation cycles.
General idea is OK, but it does not work – pulsations will be damped

36
Partial ionisation zones
In most stars there are two main partial ionisation zones. The hydrogen partial ionisation zone is a broad region with a characteristic temperature of 1 to 1.5 104 K, in which the following cyclical ionisations occur: The helium II partial ionisation zone is a region deeper in the stellar interior with a characteristic temperature of 4 104 K, where further ionisation of helium takes place:

37
Pulsating Variables: The Valve Mechanism
Partial He ionization zone is opaque and absorbs more energy than necessary to balance the weight from higher layers. => Expansion Upon expansion, partial He ionization zone becomes more transparent, absorbs less energy => weight from higher layers pushes it back inward. => Contraction. Upon compression, partial He ionization zone becomes more opaque again, absorbs more energy than needed for equilibrium => Expansion

38
The pulsation properties of a star depend primarily on where its partial ionisation zones are found within the stellar interior. The location of the partial ionisation zones is determined by the star’s temperature. -5 -7 -9 -10 -3 -6 -8 -4 log (1-Mr/Mstar) He H Surface Centre Teff ~ 7500K For stars hotter than Teff ~ 7500K, the partial ionisation zones are located too close to the star’s surface, where there is not enough mass to drive the oscillations effectively.
 He. H. Surface. Centre. Teff ~ 7500K. For stars hotter than Teff ~ 7500K, the partial ionisation zones are located too close to the star’s surface, where there is not enough mass to drive the oscillations effectively.")
39
-5 -7 -9 -10 -3 -6 -8 -4 log (1-Mr/Mstar) He H Surface Centre Teff ~ 5500K For stars cooler than Teff ~ 5500K, on the other hand, the partial ionisation zones are deep in the stellar interior. However at low temperatures, energy transport via convection becomes quite efficient in the stellar interior, preventing the build-up of heat and pressure beneath the driving pulsation layer.

40
Observed properties of a classical Cepheid
Modelling pulsations Computer modelling of stellar pulsation suggests that it is primarily the helium II ionisation zone which is responsible for the observed oscillations of stars on the instability strip. The hydrogen ionisation zone, however, still plays an important role, producing an observable phase lag between the star’s maximum brightness and its minimum radius. Observed properties of a classical Cepheid Time (days) r R/Rmin Teff V Note the phase lag between the star’s maximum brightness and its minimum radius.
 r. R/Rmin. Teff. V. Note the phase lag between the star’s maximum brightness and its minimum radius.")
41
The structure of the Galaxy
Two components: Disk Spherical (halo and bulge)
")
42
Figure 12.7: An artist’s conception of the Milky Way Galaxy seen face on and edge on. Notice the position of the sun. Hot blue stars in the disk of the galaxy light up the spiral arms. Only the inner part of the halo is shown here.

43
Spiral arms

44
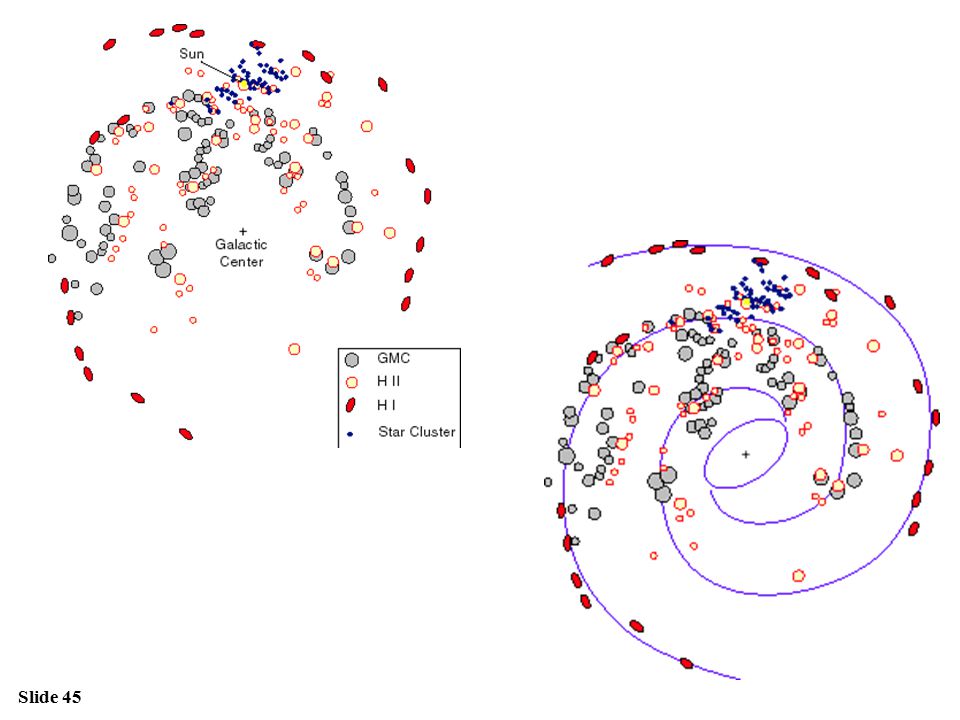
Methods to map out the spiral arms:
galactic (or open) clusters (found in spiral arms) O & B stars: bright, short lived HI 21 cm line (HI is the astronomer's name for hydrogen atoms) when the electron "flips its spin", it emits a 21 cm radio wave (radio frequency passes through dust) HII regions HII ionized Hydrogen (found preferentially in spiral arms) Molecular clouds ( CO)
 clusters. (found in spiral arms) O & B stars: bright, short lived. HI 21 cm line. (HI is the astronomer s name for hydrogen atoms) when the electron flips its spin , it emits a 21 cm radio wave. (radio frequency passes through dust) HII regions. HII ionized Hydrogen (found preferentially in spiral arms) Molecular clouds ( CO)")
46
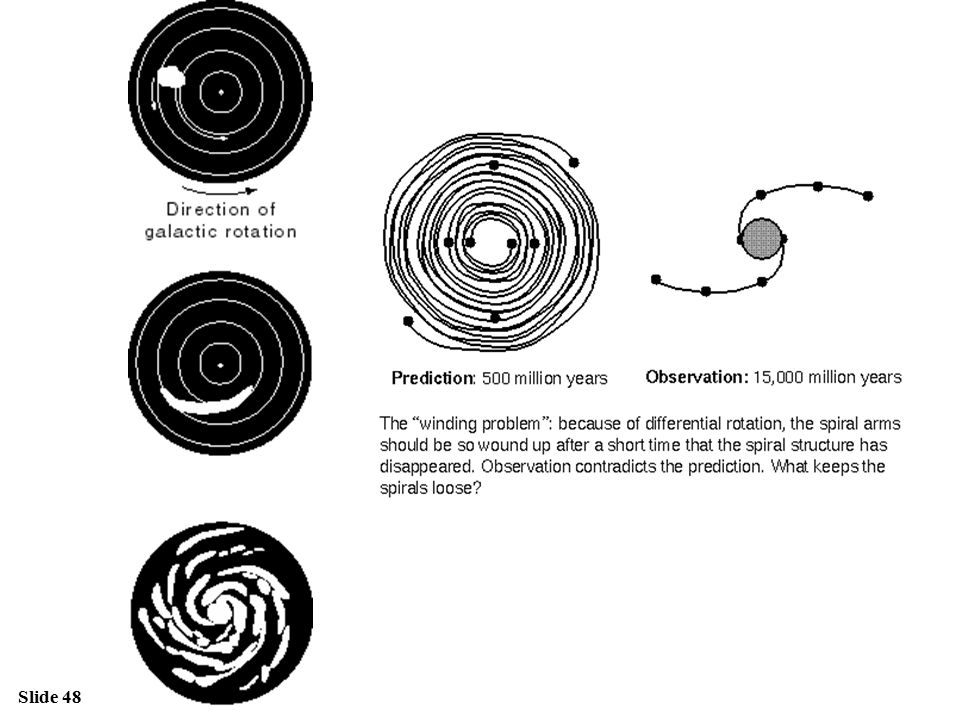
The puzzle of spiral arms
Figure 12.16: (a) Images of other galaxies, such as M51 shown here, reveal that the spiral arms are studded with hot blue stars surrounded by their pink emission nebulae. In this visible-wavelength image, emission from ionized hydrogen has been enhanced. Blue light from the most luminous of these stars gives the arms a blue tint. (NASA, The Hubble Heritage Team) M 51
 Images of other galaxies, such as M51 shown here, reveal that the spiral arms are studded with hot blue stars surrounded by their pink emission nebulae. In this visible-wavelength image, emission from ionized hydrogen has been enhanced. Blue light from the most luminous of these stars gives the arms a blue tint. (NASA, The Hubble Heritage Team) M 51.")
51
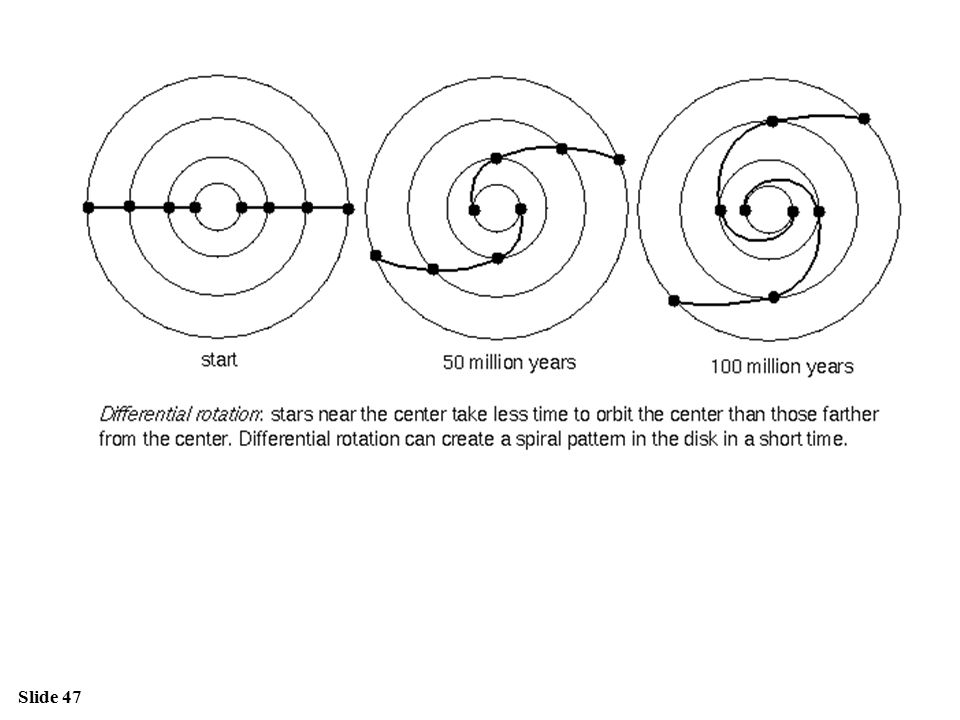
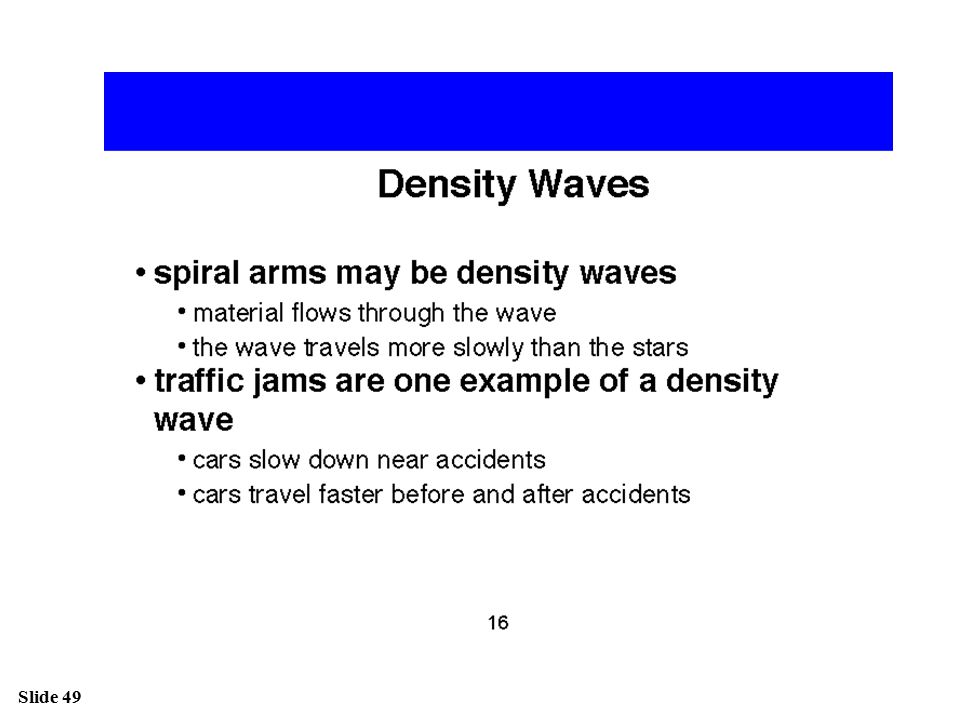
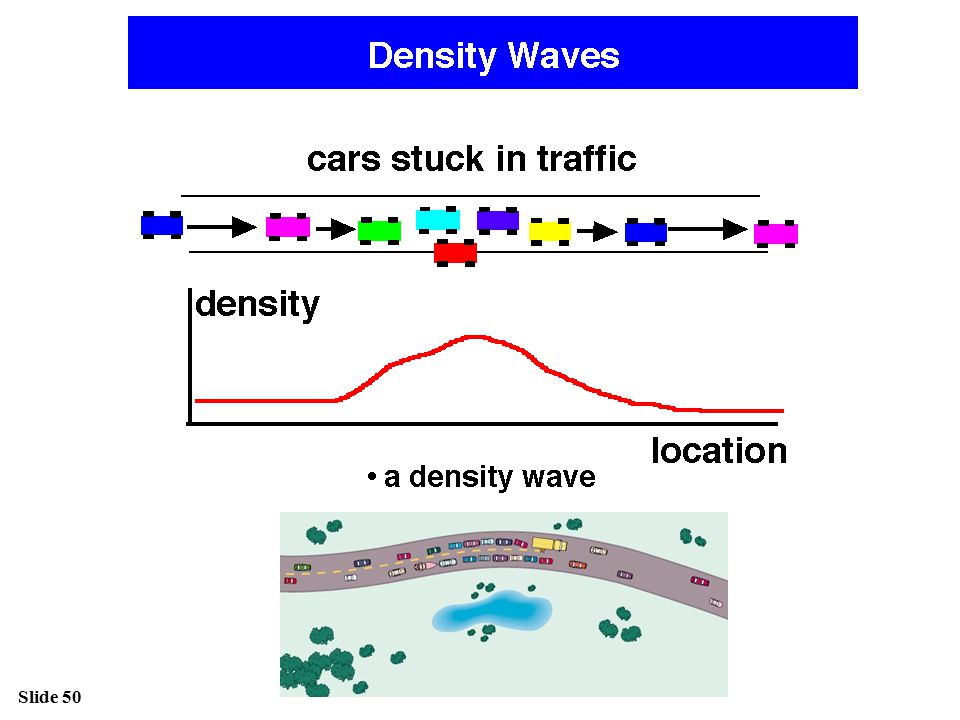
Density wave theory of the spiral arms

52
Star Formation in Spiral Arms
Shock waves from supernovae, ionization fronts initiated by O and B stars, and the shock fronts forming spiral arms trigger star formation Spiral arms are stationary shock waves, initiating star formation

53
Star Formation in Spiral Arms (2)
Spiral arms are basically stationary shock waves Stars and gas clouds orbit around the Galactic center and cross spiral arms Shocks initiate star formation Star formation self-sustaining through O and B ionization fronts and supernova shock waves

54
Winds from other stars drive new star formation cycles
Figure 12.21: The energetic birth of a massive star compresses nearby gas clouds, triggering the gravitational contraction of the gas to form new stars.

55
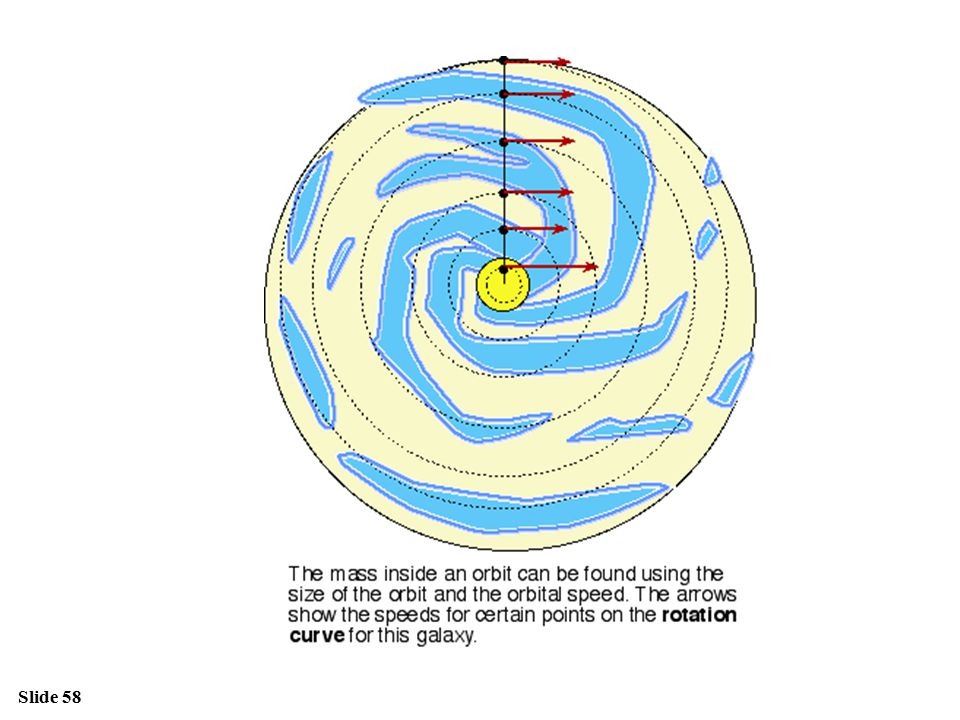
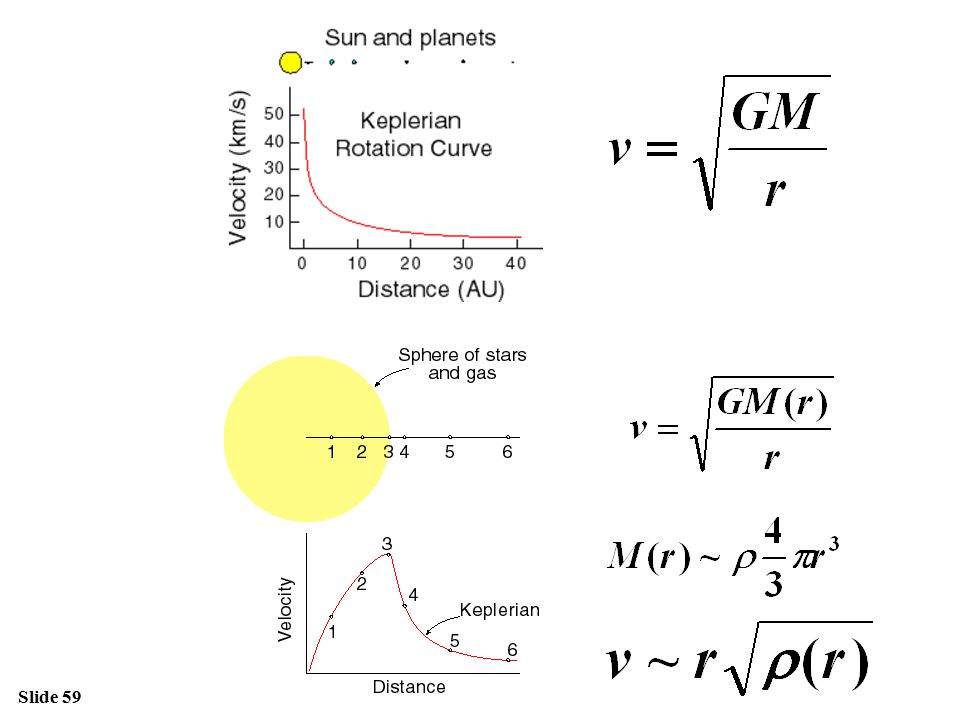
Measuring the mass of the Galaxy

56
Key idea: to measure rotation velocities
Figure 12.11: The differential rotation of the galaxy means that stars at different distances from the center have different orbital periods. In this example, the star just inside the sun’s orbit has a shorter period and gains on the sun, while the star outside falls behind.

57
Orbital Motion in the Milky Way
Differential Rotation Sun orbits around Galactic center with 220 km/s 1 orbit takes approx. 240 million years Stars closer to the galactic center orbit faster Stars farther out orbit more slowly

60
Matter extends beyond the visible disk!

61
There is much more matter than we see!

62
Dark matter halo

63
"spherical bastards” Fritz Zwicky Walter Baade

64
What is dark matter??? White dwarfs Brown dwarfs Black holes
Exotic particles ??? Revision of the Standard Model of elementary particles may be necessary

65
The age and origin of our Galaxy

66
The age of our Galaxy Age of the star clusters from turnoff points 9-10 billion years for oldest open clusters in the disk 12-13 billion years for oldest globular clusters in the halo Disk seems to be younger than halo (?!)
")
67
Ages of the stars Two populations of stars Walter Baade 1893-1960
Their main difference is in chemical composition Population I – metal-rich Population II – metal-poor Metals: all elements heavier than helium

68
The Abundance of Elements in the Universe
All elements heavier than He are very rare. Logarithmic Scale Linear Scale

69
=> Young stars contain more metals than older stars
Metals in Stars Absorption lines almost exclusively from hydrogen: Population II Many absorption lines also from heavier elements (metals): Population I At the time of formation, the gases forming the Milky Way consisted exclusively of hydrogen and helium. Heavier elements (“metals”) were later only produced in stars. => Young stars contain more metals than older stars
: Population I. At the time of formation, the gases forming the Milky Way consisted exclusively of hydrogen and helium. Heavier elements ( metals ) were later only produced in stars. => Young stars contain more metals than older stars.")
70
Figure 10. 14: Massive stars young and old
Figure 10.14: Massive stars young and old. (a) Hidden deep inside a molecular cloud, the newly born massive star AFGL2591 is rapidly expelling rings of gas to the right. Similar clouds of gas being expelled to the left are hidden behind a dusty disk surrounding the star. (Gemini Observatory/NSF/C. Aspin)
 Hidden deep inside a molecular cloud, the newly born massive star AFGL2591 is rapidly expelling rings of gas to the right. Similar clouds of gas being expelled to the left are hidden behind a dusty disk surrounding the star. (Gemini Observatory/NSF/C. Aspin)")
71
Continuing cycle of stellar evolution

72
Metal abundance in stars is related to their age!
Younger star More metals

73
Population I: Young stars: metal rich; located in spiral arms and disk
Stellar Populations Population I: Young stars: metal rich; located in spiral arms and disk Population II: Old stars: metal poor; located in the halo (globular clusters) and nuclear bulge
 and nuclear bulge.")
74
All heavy elements were synthesized in stars
There were no metals in the early universe, before the first stars were born All heavy elements were synthesized in stars That is why metals are so rare in the universe The lack of metals in Population II stars also suggests that the disk is younger than the halo

75
History of the Milky Way
The traditional theory: Quasi-spherical gas cloud fragments into smaller pieces, forming the first, metal-poor stars (pop. II); Rotating cloud collapses into a disk-like structure Later populations of stars (pop. I) are restricted to the disk of the Galaxy
; Rotating cloud collapses into a disk-like structure. Later populations of stars (pop. I) are restricted to the disk of the Galaxy.")
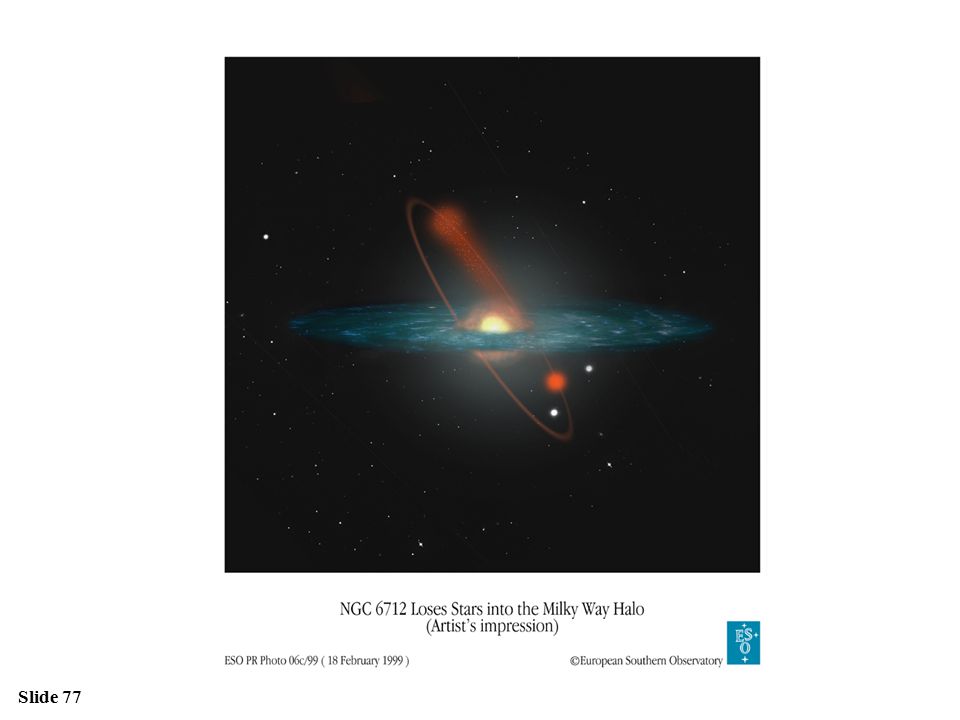
76
Problems with the traditional model
Some of the oldest stars are in the bulge, and some younger clusters are in the halo Many Population II stars in the bulge are metal-rich Even the oldest stars have some metals Maybe the bulge formed first and the halo later? Our Galaxy may have absorbed many small galaxies in the past (galactic cannibalism) Many globular clusters have been destroyed and gave their stars to the halo
 Many globular clusters have been destroyed and gave their stars to the halo.")
78
What is in the Galactic Center??

80
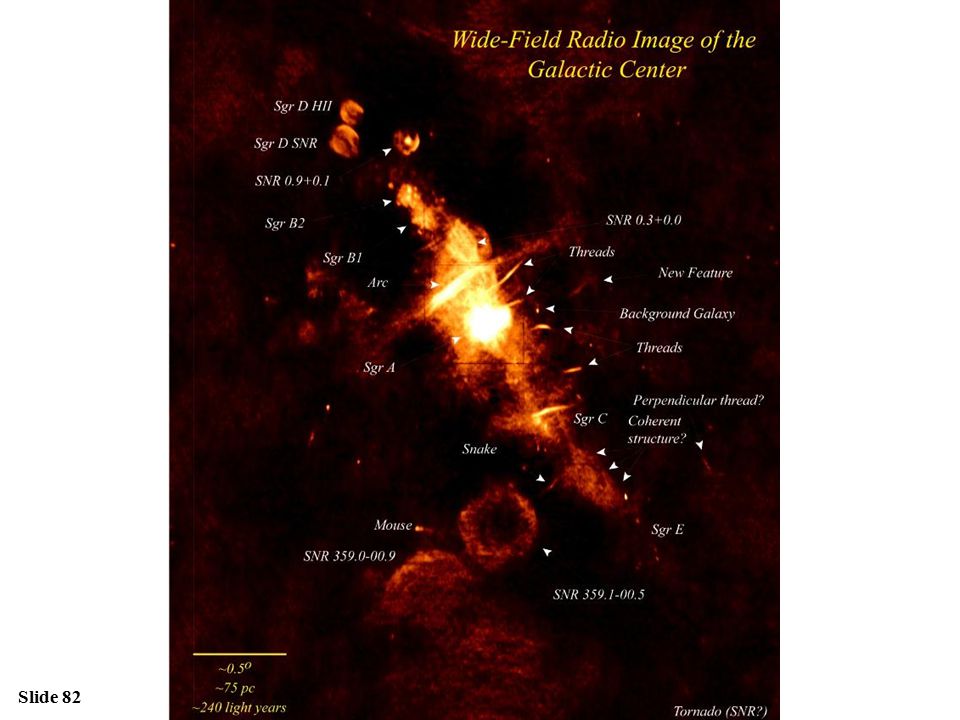
Extinction by 30 magnitudes
The Galactic Center (1) Our view (in visible light) towards the galactic center (GC) is heavily obscured by gas and dust Extinction by 30 magnitudes Only 1 out of 1012 optical photons makes its way from the GC towards Earth! Galactic center Wide-angle optical view of the GC region
 Our view (in visible light) towards the galactic center (GC) is heavily obscured by gas and dust. Extinction by 30 magnitudes. Only 1 out of 1012 optical photons makes its way from the GC towards Earth! Galactic center. Wide-angle optical view of the GC region.")
81
Need to observe the GC in the radio, infrared, or X-ray range
Central 2 pc Infrared images

84
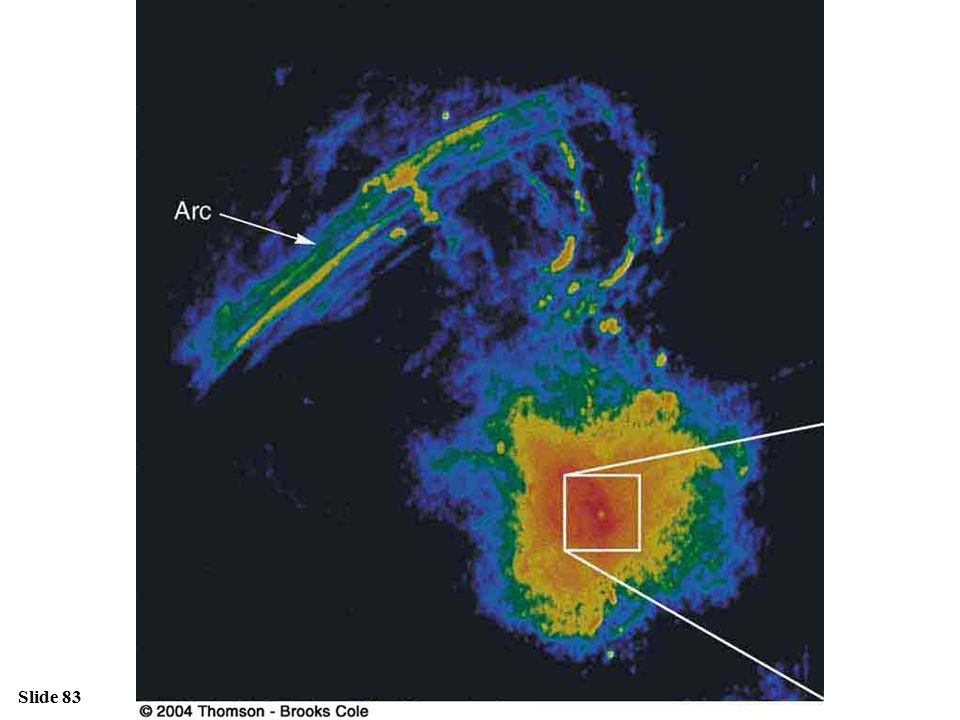
Synchrotron radiation of relativistic particles

85
The central radio emission consists of three parts:
Sagittarius A East (blue): a supernova remnant, which was produced by a violent explosion only several tens of thousands of years ago. The origin is unknown. Explanations range from a star disrupted by a black hole to a chain reaction of ordinary supernovae or even a gamma-ray burst. Sagittarius A West or Minispiral (red): Gas and dust streamers ionized by stars and spiraling around the very center, possibly feeding the nucleus. Sagittarius A *: A bright and very compact radio point at the intersection of the arms of the Minispiral (difficult to see in this image)
: a supernova remnant, which was produced by a violent explosion only several tens of thousands of years ago. The origin is unknown. Explanations range from a star disrupted by a black hole to a chain reaction of ordinary supernovae or even a gamma-ray burst. Sagittarius A West or Minispiral (red): Gas and dust streamers ionized by stars and spiraling around the very center, possibly feeding the nucleus. Sagittarius A *: A bright and very compact radio point at the intersection of the arms of the Minispiral (difficult to see in this image)")
87
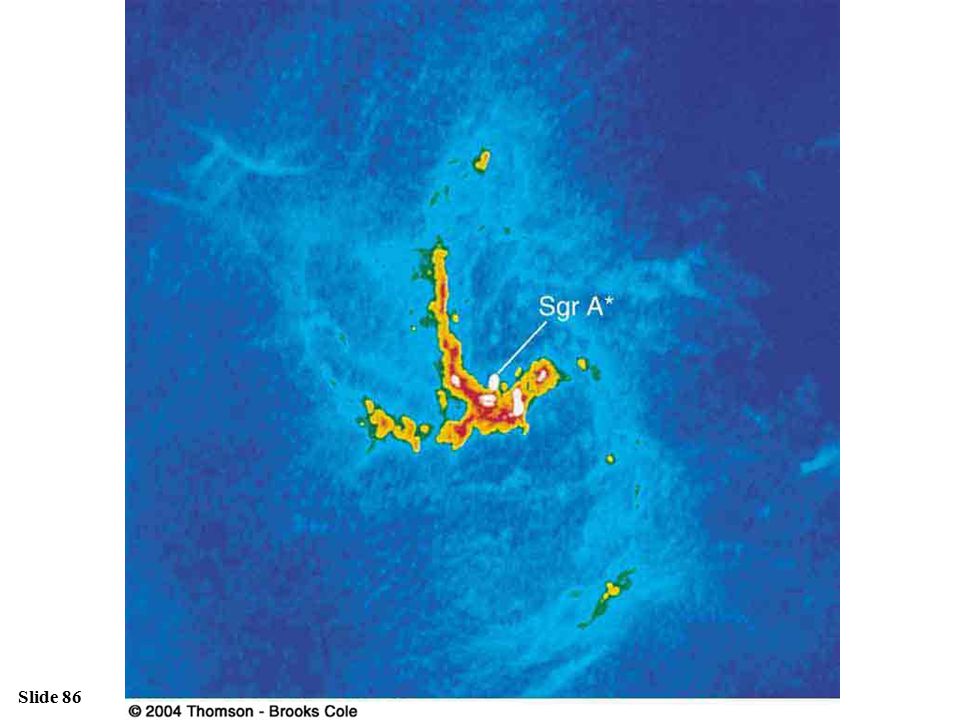
Fast rotation of spiral filaments around Sgr A*

88
If one looks at this region with big telescopes and near-infrared cameras one can see lots of stars. If one takes pictures every year it seems that some stars are moving very fast (up to 1500 kilometers per second). The fastest stars are in the very center - the position marked by the radio nucleus Sagittarius A* (cross). Distance between stars is less that 0.01 pc

89
Explanation: the dark mass ~ 2.6 million solar masses
Is this a black hole?! Rotation curve for the Galactic Center

90
A Black Hole at the Center of Our Galaxy
By following the orbits of individual stars near the center of the Milky Way, the mass of the central black hole could be determined to ~ 2.6 million solar masses

91
Radio observations with Very Long Baseline Interferometry (VLBI) which are thousands of times more precise than optical observations (good enough to easily pin-point a source the size of a pea in New York when sitting in Paris)
 which are thousands of times more precise than optical observations (good enough to easily pin-point a source the size of a pea in New York when sitting in Paris)")
93
Resolution limit: Determined by diffraction D is the telescope mirror
For visible light ~ 0.5 m and Dmax ~ 10 m For radio waves ~ 1 cm = 104 m but Dmax ~ 107 m !

94
Race to measure the size of Sgr A*
0.1 mas = 100x106 km 2 Rs = 8x10⁶ km Race to measure the size of Sgr A* The size of Sagittarius A* as measured with VLBI at different wavelengths of the observed radiation

95
Recent VLBI observations (Nature 2005)
Indicate heavier black hole ~ 4 million solar masses? Size ~ 1 AU (12 Schwarzschild Radii) Density ~ 7x10²¹ Msun/pc3 No other explanation but a black hole!
 Density ~ 7x10²¹ Msun/pc3. No other explanation but a black hole!")
96
“Shadow” of a black hole

98
Black hole vicinity is probably very messy …

99
Cores of other galaxies show an accretion disk with a possible black hole

100
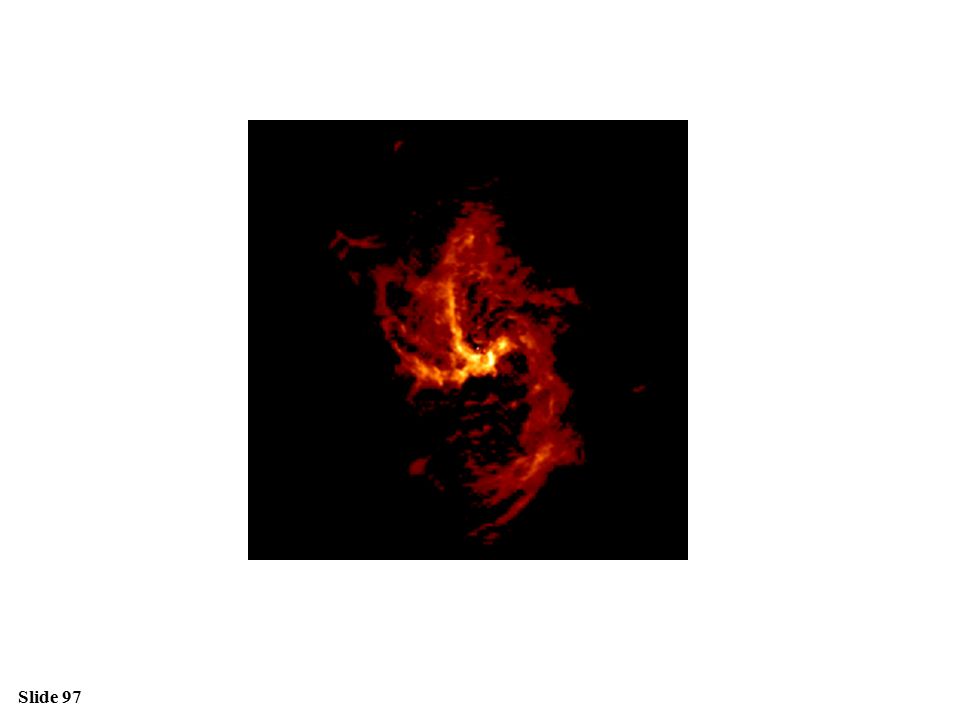
What about X-ray emission due to accretion?
Rather weak X-ray source Chandra X-ray image of the Sgr A West region

101
Rapid X-ray variability and minute-long flares!
Another Chandra X-ray image

102
X-ray View of the Galactic Center
Galactic center region contains many black-hole and neutron-star X-ray binaries Supermassive black hole in the galactic center is unusually faint in X-rays, compared to those in other galaxies Chandra X-ray image of Sgr A*

103
Evidence for a black hole of ~ 3-4 million solar masses:
Rotation curve indicating an ultra-compact object No motion of the central object Rapid variability Dense stellar population Radio jets Radio jets but rather weak X-ray emission Other galaxies contain much heavier black holes and stronger activity

Similar presentations


: v orb 2 =GM/R. This comes out about 10.>")

 Introduction to Astronomy Galaxy Evolution & AGN Prof. D.C. Richardson Sections 0101-0106.>")


 German philosopher The infinitude of creation is great enough to make a world, or a Milky Way of worlds,>")


