Download presentation
Presentation is loading. Please wait.

1
Galaxy Distributions Analysis of Large-scale Structure Using Visualization and Percolation Technique on the SDSS Early Data Release Database Yuk-Yan Lam August 9, 2001

2
General Background Sloan Digital Sky Survey Astrophysics principles Large-scale structure

3
Mapping out the Sky: Sloan Digital Sky Survey ¼ of the sky >100 million celestial objects EDR database ~42,000 galaxies Projected galaxy spectra 1 million Apache Point Observatory, New Mexico

4
“Pi in the sky” Total Solid Angle: 10,000 square degrees

5
Astrophysical Principles Redshift Spectral classification Galaxy types

6
Cosmological Redshift Stretching of light wavelength due to Universe expansion (received wavelength of light) = (emitted wavelength) x (1 + z) At time of light emission, Universe was a factor of (1 + z) smaller in its linear dimension
 = (emitted wavelength) x (1 + z) At time of light emission, Universe was a factor of (1 + z) smaller in its linear dimension")
7
Galaxies with varying redshifts: Low High

8
Fingerprints: Spectra Spectrogram – photograph of a spectrum SDSS spectrograph splits light from each source into hundreds of spectra, which are photographed by digital cameras. QUASAR SPECTRA GALAXY SPECTRA

9
Galaxy Types Two Important Characteristics 1. How much light? 2. How is the light divided between the bulge and the disk? Bulge – spherical center Disk – flat portion

10
The Elliptical Galaxy Massive Spectra similar to a cool star No discernible disk

11
The Spiral Galaxy Massive Almost flat spectra Disks with spiral patterns Three classes: Sa Sb Sc with increasing prominence of disk and arms

12
Other Galaxy Types Dwarf Galaxies Lenticular Galaxy – No arms but a disk Irregular Galaxy Blue Compact Galaxy

13
Large-Scale Structure Different Types of Topology Possible Percolation Statistics

14
Filamentary “Network” Topology More “connected” as implied by a filamentary geometry Filamentary: Galaxies concentrated to one-dimensional threads forming a kind of three- dimensional network.

15
Cellular “Bubble” Topology Cellular: Galaxies concentrated in narrow walls separating large, isolated voids.

16
“Swiss Cheese” Topology Both kinds of regions are connected, so it is possible to swim to any point through the holes or burrow to any point inside. AKA Sponge:

17
“Meatball” Topology “Clumpier”

18
Phase 1: Visualization Two dimensions Three dimensions

19
Sample (projected into two dimensions) In redshift space Galaxy query on EDR 41,946 galaxies with their spectra found
 In redshift space Galaxy query on EDR 41,946 galaxies with their spectra found")
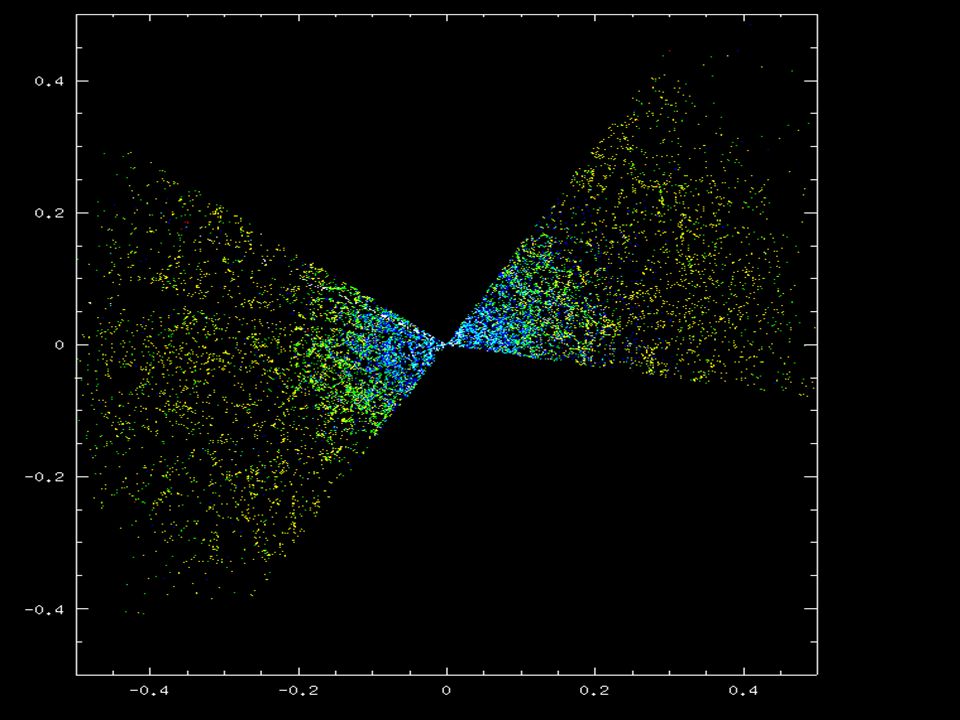
20
Position In Relation to Spectrum Goal: See how a galaxy’s location in the sky may be related to its recorded spectrum Plot using the following color code: REDspectrum < -0.4 YELLOW-0.4 < spectrum < -0.2 GREEN -0.2 < spectrum < 0.0 BLUE0.0 < spectrum < 0.3 LIGHT BLUE0.3 < spectrum < 0.6 WHITE spectrum > 0.6

22
CAVE Components: Stereographic Projectors Interactive Wand Stereo Glasses

23
Phase 2: Percolation Preview: Percolation principles Step 1: Initial Conditions Step 2: Percolation Occurs Step 3: Evolution Statistics

24
Percolation Principles The Simple Cubic Lattice The On/Off State -> Filling Factor Method of Expansion Method of Grouping

25
Two-Dimensional Analogy: Square lattice & on/off state Initial LatticeOn/Off State

26
How to expand?

27
Grouping Neighbors Groups Largest Cluster Statistic (LCS) Mergers Neighbors Merging Groups
 Mergers Neighbors Merging Groups")
28
Percolation Statistics Related to Large-Scale Topology Standards: Faster growth of LCS -> More connected distribution Slower growth of voids than Gaussian -> Bubble topology Faster growth of clusters than Gaussian -> Network topology Slower growth of clusters than Gaussian -> Meatball topology

29
Sample Simulations LCS Radius Size Network Meatball Poisson

30
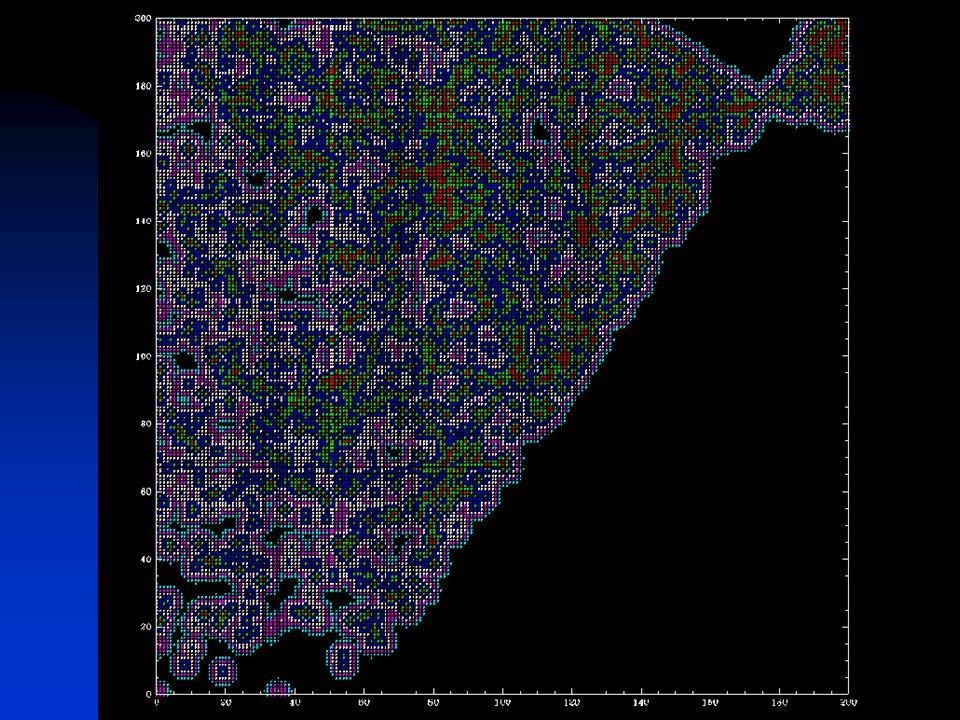
Step 1: Initial Conditions Size used: 350 FF:.000468665 In red- shift space

31
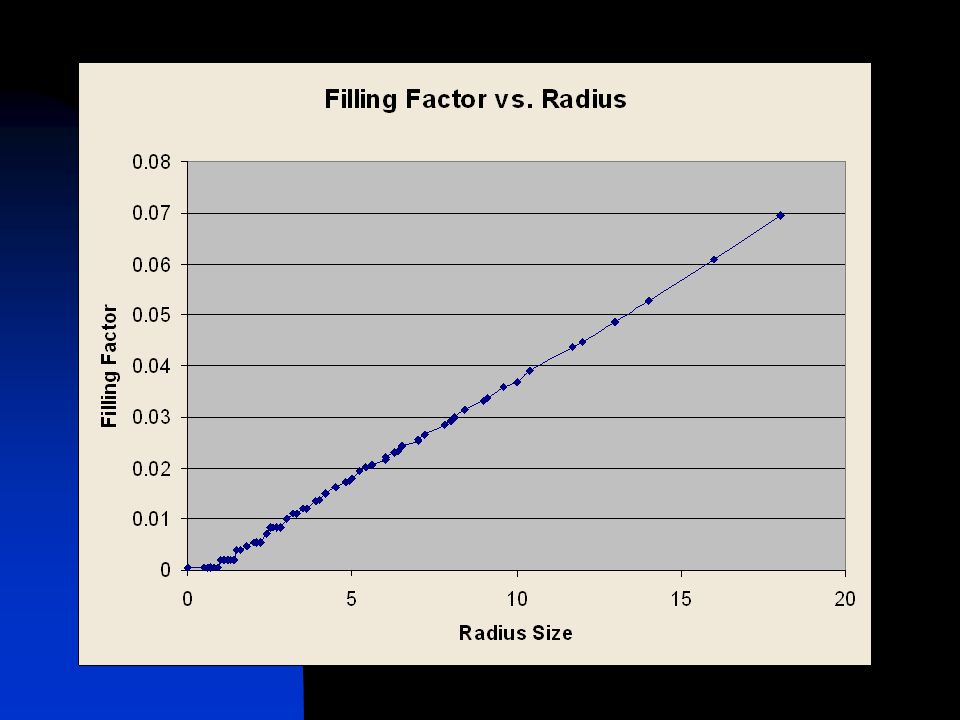
Percolation Visualized Filling Factor versus Radius Size Step 2: E-x - p - a - n - d

34
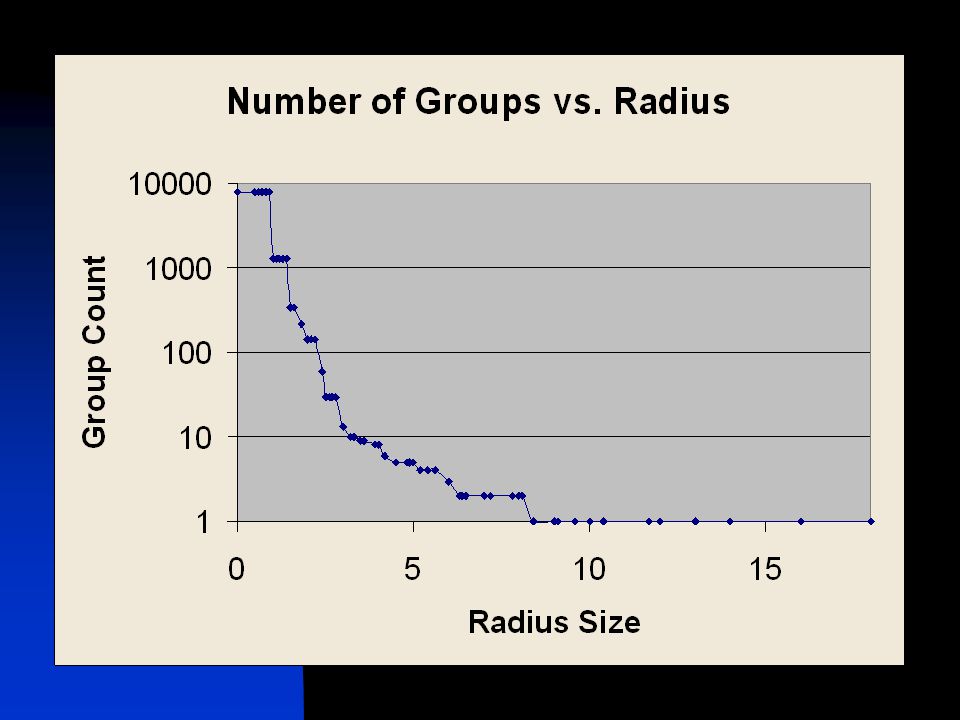
Step 3: Evolution Statistics Number of Groups vs. Radius LCS vs. Radius

38
Where now? Compare with simulations Improve grid accuracy Boundary effects Incorporate additional surveys Visualization of technique Comparison with other techniques Application to other areas

39
Acknowledgements Mark Subbarao, Astronomy and Astrophysics Department, University of Chicago Joshua Frieman, Astronomy and Astrophysics Department, University of Chicago Mark Hereld, MCS Division, Argonne National Laboratory Sloan Digital Sky Survey http://www.sdss.org

Similar presentations


>")

>")


