Download presentation
Presentation is loading. Please wait.

1
Far-IR/Submillimeter Astronomy Astronomy 101 Dr. C. Darren Dowell, Caltech Submillimeter Observatory 11 October 2000 http://www.submm.caltech.edu/~cdd/class

2
Outline Kirchhoff’s Law Far-infrared/submillimeter emission Atmospheric constraints, observatories Detectors Observing strategies Bolometers A submillimeter camera

3
Kirchhoff’s Law Absorptivity = emissivity Example 1: A 99% reflective mirror absorbs 1% of radiation incident on it. This means it must also emit with a spectrum given by: –F( ) = B( ) × 1% Example 2: Spacecraft radiators (directed toward cold outer space) are coated with black (absorptive) paint to cool efficiently.
 = B( ) × 1% Example 2: Spacecraft radiators (directed toward cold outer space) are coated with black (absorptive) paint to cool efficiently..")
4
Where is the far-IR/submillimeter? A useful definition: –Far-IR: = 30 m to 300 m, which is unobservable from the ground –Submillimeter: = 300 m to 1 mm, partially available from high, dry mountains In frequency units, 3 10 11 Hz to 1 10 13 Hz Compare: –Visual wavelengths at 0.5 m 6 10 16 Hz –Commercial FM radio at 3 m 1 10 8 Hz

5
Sources of far-IR/submillimeter emission Continuum –Blackbody emission from solar system objects and stars –‘Graybody’ emission from dusty nebulae –Free-free (bremsstrahlung) emission from ionized gas –Synchrotron emission from relativistic electrons spiraling around magnetic fields Line –Rotational transitions of molecules –Electronic transitions in atoms (large prinicipal quantum number ‘n’, fine structure)
 emission from ionized gas –Synchrotron emission from relativistic electrons spiraling around magnetic fields Line –Rotational transitions of molecules –Electronic transitions in atoms (large prinicipal quantum number ‘n’, fine structure)")
6
Vela/Puppis Nebula seen by IRAS

7
Dust in the Interstellar Medium Dust grains are made of silicate and graphite material, coated with ices in cold regions. There is a grain size distribution (more small grains, fewer large grains); an average size of 0.1 m gives the best fit in simple models. Dust is intermixed with H 2 in molecular clouds, with M(dust)/M(H 2 ) 0.01. The majority of dust emission is from nebulae with ongoing star formation, where the dust is heated by nearby stars.
; an average size of 0.1 m gives the best fit in simple models. Dust is intermixed with H 2 in molecular clouds, with M(dust)/M(H 2 ) The majority of dust emission is from nebulae with ongoing star formation, where the dust is heated by nearby stars..")
8
Emission from a single dust grain F( ) = A Q( ) B(,T) / D 2 –F( ) = flux density (measured intensity) –A = geometrical cross section = r 2 –Q( ) = emissivity (modification to cross section) –B(,T) = Planck function –D = distance from observer to dust grain AQ( ) = emission cross section = absorption cross section (by Kirchhoff’s Law) –Q( ) 1 at ultraviolet wavelengths. –Q( ) falls as -2 at submillimeter wavelengths. –Nebulae which are visually opaque are usually transparent in the far-IR/submillimeter.
 falls as -2 at submillimeter wavelengths. –Nebulae which are visually opaque are usually transparent in the far-IR/submillimeter..")
9
Comparison of optical/IR with far-IR/submillimeter

10
The Milky Way – An Edge-On Spiral Galaxy

11
The Andromeda Galaxy (M 31)
")
12
Continuum spectra of various objects

13
Far-IR/submillimeter emission lines Spectral lines are responsible for 5 to 50% of total far-IR/submillimeter emission from nebulae. –Larger fraction for longer wavelengths; smaller fraction for shorter wavelengths. –Largest fraction for environments where young stars are evaporating gas off dust grains.

14
Submm. lines in the Orion Nebula

15
Rotational transitions Start with classical mechanics: –I = m 1 m 2 R 2 /(m 1 +m 2 ) –J = I –E = I 2 /2 Add quantum mechanics: –J = {N(N+1)} 1/2 h/2 quantized – = E/h, with N = 1 most likely Then: –E = h 2 N(N+1)/8 2 I – = h(N+1)/4 2 I {state N+1 state N} m1m1 m2m2 R C O
 –J = I –E = I 2 /2 Add quantum mechanics: –J = {N(N+1)} 1/2 h/2 quantized – = E/h, with N = 1 most likely Then: –E = h 2 N(N+1)/8 2 I – = h(N+1)/4 2 I {state N+1 state N} m1m1 m2m2 R C O ")
16
Rotational transitions of Carbon Monoxide CO molecule: –m 1 = 12 amu = 2.0 × 10 -26 kg –m 2 = 16 amu = 2.7 × 10 -26 kg –R = 1.1 Å = 1.1 × 10 -10 m Plug in: –I = m 1 m 2 R 2 /(m 1 +m 2 ) = 1.4 × 10 -46 kg m 2 – = h(N+1)/4 2 I = 121 GHz (N+1) Actually: – = 115.271 GHz, 230.538 GHz, 345.796 GHz, … 12 amu 16 amu 1.1 Å C O
 = 1.4 × kg m 2 – = h(N+1)/4 2 I = 121 GHz (N+1) Actually: – = GHz, GHz, GHz, … 12 amu 16 amu 1.1 Å C O")
17
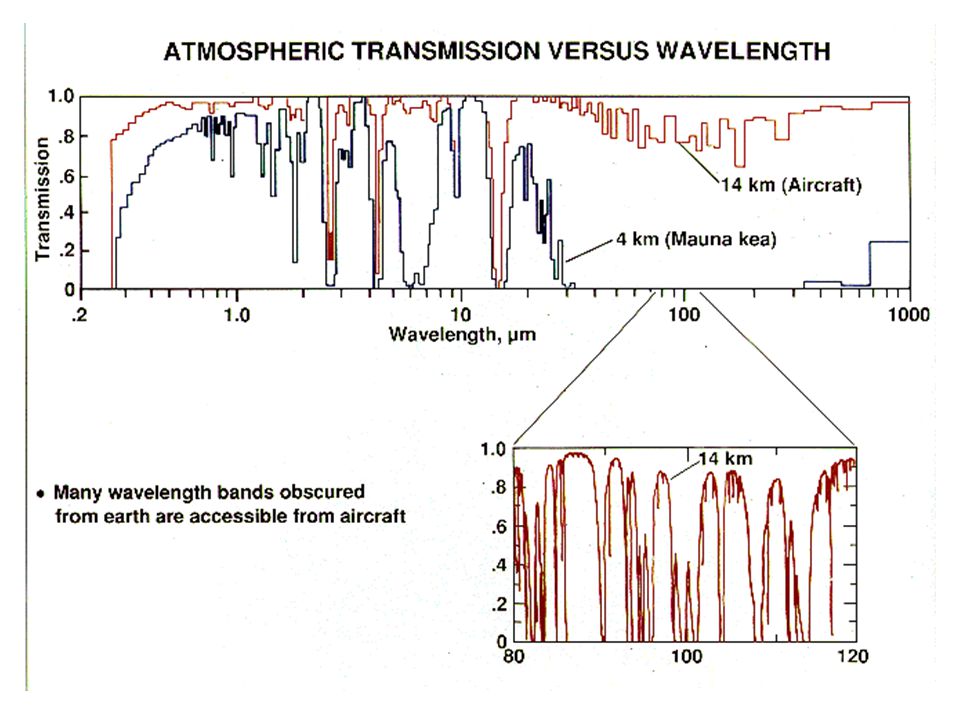
Atmospheric constraints Water vapor is the primary enemy of far- IR/submillimeter astronomy. Range = 30 – 300 m is unavailable from the ground. Other options: –Airplanes (40,000 ft.) – KAO, SOFIA –Balloons (120,000 ft.) –Satellites – IRAS, ISO, SIRTF 300 m – 1 mm range is partially available from high, dry mountains (> 10,000 ft.) – Mauna Kea (CSO, JCMT, SMA); South Pole; Chile (ALMA) > 1 mm – available from lower elevations
 – KAO, SOFIA –Balloons (120,000 ft.) –Satellites – IRAS, ISO, SIRTF 300 m – 1 mm range is partially available from high, dry mountains (> 10,000 ft.) – Mauna Kea (CSO, JCMT, SMA); South Pole; Chile (ALMA) > 1 mm – available from lower elevations.")
19
Mauna Kea, Hawaii (13,000 ft.) 1000 m300 m
 1000 m300 m")
20
‘Submillimeter Valley’, Mauna Kea

21
Caltech Submm. Observatory – 10 m

22
Kuiper Airborne Observatory (1974-1995) – 0.9 m
 – 0.9 m")
23
A telescope in an airplane (!)
")
24
On the Kuiper Airborne Observatory

25
Stratospheric Observatory for Infrared Astronomy (2002) – 2.5 m
 – 2.5 m")
26
Space Infrared Telescope Facility (2002) – 0.85 m
 – 0.85 m")
27
Angular resolution in the far- IR/submillimeter Diffraction for a single telescope: 1.2 / D –Typical submillimeter telescope: D = 10 m, = 800 m = 20” Interferometry can solve angular resolution problem: 1.2 / B, where B is the separation of two telescopes –SMA: 1” –ALMA (2007): 0.1” There are slow atmospheric ‘seeing’ (wavefront distortion) effects, but they can be corrected with sky monitors.
: 0.1 There are slow atmospheric ‘seeing’ (wavefront distortion) effects, but they can be corrected with sky monitors.")
28
Far-IR/submillimeter detectors ‘Incoherent’ – light as a particle –Photoconductors – 1 photon raises 1 electron from valence band to conduction band; works only for < 200 m –Bolometers – photons raise the temperature of an absorber, which is measured by a thermistor ‘Coherent’ – light as a wave –Heterodyne mixers – measure ‘beat frequency’ of cosmic radiation against a local oscillator

29
Heterodyne mixers Basic idea: Illuminate mixer element with radiation from the sky, and also radiation from a transmitter (‘local oscillator’). Beat frequencies get produced: –V sky = V 1 sin ( 1 t – 1 ) –V LO = V 0 sin ( 0 t – 0 ) –V output = (V sky + V LO ) 2 = C sin [( 1 - 0 )t – ] + high frequency terms which get filtered out –See Smith, p. 106, for exercise. Example: Line of interest at 345 GHz, LO at 344 GHz line appears at (345 – 344) = 1 GHz, a frequency which spectrometers can deal with.
 –V LO = V 0 sin ( 0 t – 0 ) –V output = (V sky + V LO ) 2 = C sin [( 1 - 0 )t – ] + high frequency terms which get filtered out –See Smith, p. 106, for exercise. Example: Line of interest at 345 GHz, LO at 344 GHz line appears at (345 – 344) = 1 GHz, a frequency which spectrometers can deal with..")
30
Difficulty of infrared/submillimeter astronomy from the ground Infrared astronomy from the ground has been likened to “observing in the day, with the telescope on fire”. Why? The atmosphere emits, and the telescope itself emits. Atmospheric emission is ~10 6 times brighter than the faintest source which can be detected in 1 hour. Telescope emission can be minimized with a good design.

31
Optical telescope

32
Submillimeter telescope

33
Observing strategies The terrestrial atmosphere absorbs heavily in the far-IR/submillimeter, so it must also emit. (Kirchhoff’s Law) –Transmission = 60% emissivity = 40% –T (atmosphere) = 270 K peak 2900 m / T 10 m significant emission on the Rayleigh-Jeans side of the spectrum. The atmospheric emission changes as ‘cells’ of water vapor drift by. Constant sky subtraction is necessary.
 –Transmission = 60% emissivity = 40% –T (atmosphere) = 270 K peak 2900 m / T 10 m significant emission on the Rayleigh-Jeans side of the spectrum. The atmospheric emission changes as ‘cells’ of water vapor drift by. Constant sky subtraction is necessary..")
34
One sky subtraction approach – chopping mirror A mirror wobbles back and forth, causing the detector to view two different parts of the sky. (Smith, p. 128)
.")
35
Another sky subtraction approach – differential radiometer One pixel is ‘source + sky’, and two pixels are ‘sky’. This is similar to using edge pixels on a CCD to subtract the sky, but with a much worse sky and fewer pixels.

36
Bolometer – diagram of 1 ‘pixel’ Radiation is intercepted, absorber heats, and temperature change is measured by thermistor. weak thermal link wires cold bath at fixed temperature absorber thermistor radiation

37
Actual bolometers

38
A closer look…

39
An even closer look… leg = thermal link, wire on top absorber: 1 mm square doped silicon thermistor (invisible)
")
40
What is a thermistor? A thermistor is a resistor whose resistance varies with temperature. Thermistors can be made out of semiconductors. When the temperature increases, more electrons enter the conduction band, and therefore the resistance goes down.

41
Typical thermistor behavior

42
IV curves – a useful method for analyzing detector performance An applied current is necessary to measure a resistance.

43
IV curve for a bolometer linear region turnover, due to self-heating

44
Now add radiation… operating current

45
Limits to bolometer performance The kinetic energy of the electrons and atoms in a bolometer limit its performance: –Johnson noise – random voltage from fluctuations in the motion of electrons –Phonon noise – random bolometer temperature from fluctuations of energy flowing down the thermal link The colder, the better. NEP: Smallest power which is detected in a 1 second integration; units W Hz -1/2 = W s 1/2 State of the art: –Bolometers at 0.3 K: NEP = 10 -16 W s 1/2 –Bolometers at 0.1 K: NEP = 10 -17 W s 1/2

46
A Lightbulb on the Moon? How much power can be collected by a 10 meter telescope from a 100 watt lightbulb at the distance of the Moon? –P = 100 watts ( r 2 /4 d 2 ) –r = 5 m, d = 4 x 10 8 m –Therefore, P = 4 x 10 -15 watts In principle, one could easily detect the light bulb with a bolometer at 0.3 K. Detecting the light bulb might be more difficult than our simple calculation would indicate. Why?
 –r = 5 m, d = 4 x 10 8 m –Therefore, P = 4 x watts In principle, one could easily detect the light bulb with a bolometer at 0.3 K. Detecting the light bulb might be more difficult than our simple calculation would indicate. Why .")
47
Bolometers – impartial detectors of radiation Bolometers can detect radiation over a very broad range of the electromagnetic spectrum, from X rays to radio wavelengths Wavelength is contrained to passband of interest by choice of absorber and by choice of filters in front of detector. The bolometer is the superior broadband ( / > 0.01) detector from = 200 m – 1 mm.
 detector from = 200 m – 1 mm..")
48
SHARC II – a camera using bolometers SHARC II – Submillimeter High Angular Resolution Camera, 2 nd generation For the Caltech Submillimeter Observatory Observing at = 350 m Goal: 12 × 32 = 384 bolometers – the most submillimeter pixels in the world, by a factor of 3 Bolometers cooled to 0.3 K Started in 1997; first tests with 16 pixels in September 2000; finish in 2001(?)
")
49
Goal: 2-dimension bolometer array

50
Cross section of SHARC II

51
Useful cryogens for far-IR cameras Liquid cryogens are used at their boiling point temperature, since they are colder than their surroundings. Water as a ‘cryogen’ would provide a temperature of 373 K. Liquid nitrogen (N 2 ) – 77 K Liquid helium ( 4 He) at 1 atmosphere – 4.2 K Liquid 4 He at 10 -3 atmosphere – 1.5 K Liquid 3 He at 10 -3 atmosphere – 0.3 K
 – 77 K Liquid helium ( 4 He) at 1 atmosphere – 4.2 K Liquid 4 He at atmosphere – 1.5 K Liquid 3 He at atmosphere – 0.3 K.")
52
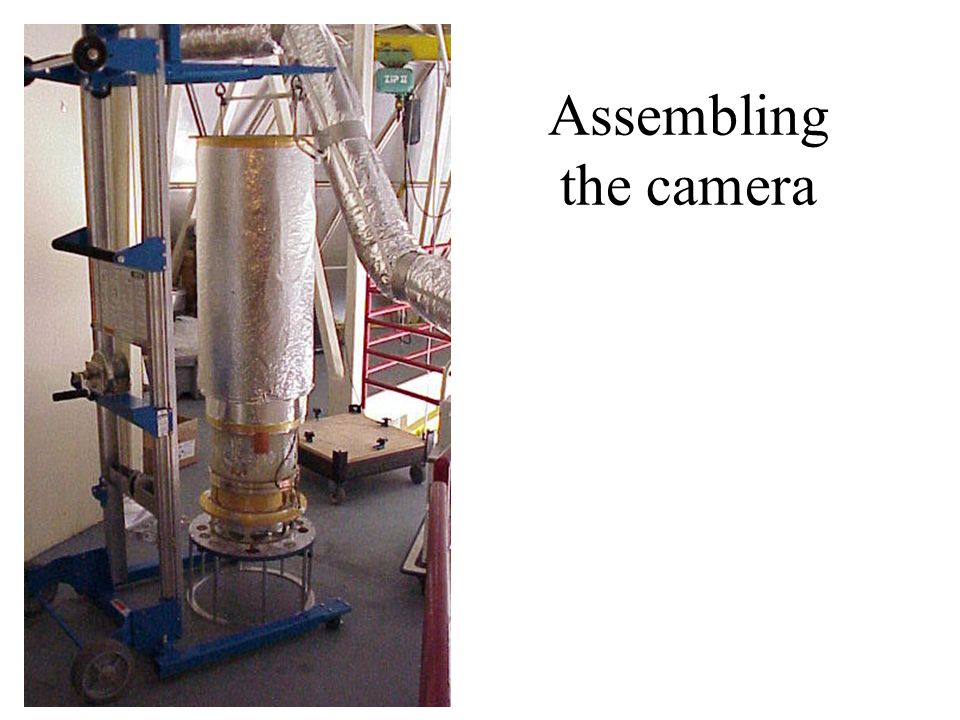
Assembling the camera

54
No Multi-Layer Insulation P = net power flow = AT 1 4 – AT 0 4 = A[T 1 4 – T 0 4 ] P T 1 > T 0 = 1 = a T 0 = 1 = a AT 1 4 AT 0 4
![No Multi-Layer Insulation P = net power flow = AT 1 4 – AT 0 4 = A[T 1 4 – T 0 4 ] P T 1 > T 0 = 1 = a T 0 = 1 = a AT 1 4 AT 0 4](http://images.slideplayer.com/16/5022272/slides/slide_54.jpg "No Multi-Layer Insulation P = net power flow = AT 1 4 – AT 0 4 = A[T 1 4 – T 0 4 ] P T 1 > T 0 = 1 = a T 0 = 1 = a AT 1 4 AT 0 4")
55
With one shield layer Equilibrium of shield: AT 1 4 a + AT 0 4 a = 2 AT 2 4 P = AT 2 4 + AT 0 4 (1-a) – AT 0 4 = A( [T 1 4 – T 0 4 ] P T 1 = 1 = a T 0 = 1 = a AT 1 4 T 2 = a 1 AT 1 4 a AT 1 4 (1-a) AT 2 4 AT 0 4 (1-a) AT 0 4 AT 0 4 a
![With one shield layer Equilibrium of shield: AT 1 4 a + AT 0 4 a = 2 AT 2 4 P = AT 2 4 + AT 0 4 (1-a) – AT 0 4 = A( [T 1 4 – T 0 4 ] P T 1 = 1 = a T 0 = 1 = a AT 1 4 T 2 = a 1 AT 1 4 a AT 1 4 (1-a) AT 2 4 AT 0 4 (1-a) AT 0 4 AT 0 4 a](http://images.slideplayer.com/16/5022272/slides/slide_55.jpg "With one shield layer Equilibrium of shield: AT 1 4 a + AT 0 4 a = 2 AT 2 4 P = AT 2 4 + AT 0 4 (1-a) – AT 0 4 = A( [T 1 4 – T 0 4 ] P T 1 = 1 = a T 0 = 1 = a AT 1 4 T 2 = a 1 AT 1 4 a AT 1 4 (1-a) AT 2 4 AT 0 4 (1-a) AT 0 4 AT 0 4 a")
56
Putting it on the telescope

57
On the telescope

58
Inaugural image – Orion Nebula core

59
Key points – far-IR/submm. astronomy Most of the far-IR/submillimeter emission from the universe comes from dust. Line emission is mostly from rotational transitions of simple molecules. The far-IR/submillimeter is particularly useful for studying the formation of stars, from nearby nebulae to high-redshift galaxies. The water in the Earth’s atmosphere absorbs most of far- IR/submillimeter radiation from space – the main motivation for airborne and spaceborne observatories. Far-IR/submm detectors include photoconductors, bolometers, and heterodyne mixers. Bolometers detect a small temperature rise from absorbed radiation.

Similar presentations


, what do they need to know to figure out how far away that object is? Why are.>")


 light immediately beyond the color red is call infrared light.>")

