Download presentation
Presentation is loading. Please wait.

1
Visual interpretation Chapter 10

2
Visual interpretation in important to GIS development and application. It is the interpretation of aerial photography by a photo interpreter. –Regarded as somewhat useful but old- fashioned likely to be replaced by digital analyses

3
Visual interpretation is now seen in the new context. –Skills that a photo interpreter uses are applied equally to photographs as well as digital images –So a new name has come into use that of image analyst or image interpreter

4
In addition, remote sensing data has become more detailed, much like photography Finally, computer science is not evolved to the point where image analysis can be done completely automatically

5
Characteristics of aerial imagery Visual interpretation is used to extract information from fine resolution imagery at scales of 1:40,000 or larger –And includes almost all aerial photography and fine scale satellite imagery (e.g. IKONOS) –Excludes coarse resolution imagery produced by satellites such as Landsat
 –Excludes coarse resolution imagery produced by satellites such as Landsat.")
6
Characteristics of aerial imagery GIS requires the following conditions be met –Geometric errors removed –Detailed spatial information is contained –Can provide taxonomic details such as separation of corn from wheat –Spatial relationships can be examined such as vegetation distribution and water bodies –Patterns of change from one day to the next are monitored –Equipment and experienced staff are available –Historical phenomena can be examined such as land- use change

7
Sources of imagery Two common sources –Archival imagery previously acquired for another purpose. –Imagery acquired specifically for the project at hand

8
Archival imagery Several sources are available. –USGS –US National Archives and Records Administration –State agencies Department of Transportation Department of natural resources. Such imagery must often be bought

9
Archival imagery In most cases, computerized databases permit online searches. Many states update photography on a regular basis. –These are useful in examining change

10
Custom acquisition Imagery is acquired, according to the user specifications. –The date scale emulsion coverage and other characteristics are determined by the user. The disadvantages include –high cost –requirement for planning well in advance. –effort devoted to preparing and monitoring the specifications –delays and cancellations due to weather or equipment malfunctions

11
Custom acquisition Users should prepare a contract or statement of work –Specifies in detail the products and services required from the firm with respect to cost, deadlines, and products to be prepared Contract is a means for controlling the completeness and quality of the imagery

12
Custom acquisition The photo interpreter may participate in making decisions about scale, date, time of day, deadlines, choice of film, and coverage

13
Custom acquisition Photo interpreter should ask: –Will imagery be adequate for the purpose of the project? –Is the film emulsion satisfactory for the task? –Is the season suitable? –Will planned time of day provide appropriate shadowing? –In stereophotography, what will the overlap be?

14
Elements of image interpretation Image analysis requires explicit recognition of eight elements of image interpretation that form the framework and understanding of an image –Shape –Size –Tone –Texture –Shadow –Site –Association –pattern

15
Shape The outline of a feature –Important to note that shape depends on perspective –Overhead perspective, introduces scale effect

19
Size The first to the dimensions of a feature Relative size determined by comparing the object with familiar nearby features Absolute size refers to the use of the aerial image to derive measurements

21
Tone Refers to the average brightness of an area or, in the case of color imagery, to the dominant color of the region –Depends on the nature of the surface in the ankles of observation and illumination. –Smooth surfaces behave like specular reflectors, they tend to reflect radiation in a single direction These features may appear bright or dark –Rough surfaces behave this diffuse reflectors. Scatter radiation in all directions. A peer is medium gray tones

23
Texture Refers to the variation in tone over a surface or the apparent roughness of the surface as seen in the photo Created by micro shadows in small irregularities in the surface.

26
Shadow Refers to large distinctive shadows that revealed the outline of a future as projected onto a flat surface. –Depends on the nature of the object, angle of illumination, perspective, and slope of the ground surface

32
Site Refers to a futures position with respect to topography and drainage. –Some things occupy a distinctive topographic position because of their function Sewage treatment facilities at the lowest feasible topographic position. Power plants located adjacent to water for cooling

37
Association Association refers to the distinctive spatial interrelationships between features –Schools often associated with athletic fields. –Large parking lots often associated with malls

41
Pattern Refers to distinctive arrangement of features –Orchards have trees plant can rows –Mobile home parks have rectangular buildings arranged in rows

51
Image interpretation tasks Classification - Assign objects to classes –Detection, recognition, identification. –Interpreter confidence is ranked as possible, probable Enumeration - Count items Measurement- mensuration –Uses image scale to derive measurements such as length with distance and volume Delineation – demarcation of regions

52
Interpretation strategies Field observation. –Required when the image and its relationship to ground conditions are imperfectly understood Direct recognition. –Interpreter derives information directly from inspection of the image Inference –Based on visible features can derive information about invisible features –Certain relationships and identify features

53
Interpretation strategies Interpretive overlays. –Useful when relationships between visible patterns are used to reveal patterns not directly visible. –Soils may be revealed by relationships with vegetation patterns, slope, and drainage Photomorphic regions –Identify regions of uniform appearance on an image. –Does not attempt to resolve individual landscape components. Mostly used with small-scale imagery in which coarse resolutions tend to average separate components

54
Interpretation strategies Image interpretation keys. –Keys are reference information designed to enable rapid identification of features. –Usually a collection of annotated images or stereograms and a description, which may include sketches or diagrams

55
Aerial mosaics and image maps IMAP is characterized by the planimetrically accurate representation of your surface and uses symbols to represent select features An aerial image is not really a map because Tilton relief displacement introduced your metric errors –Its features are represented without selection or symbolization

56
Aerial mosaics and image maps A aerial images form the basis of useful map-like representation of the Earth’s surface such as mosaics and orthophotos Aerial mosaics are produced by assembling adjacent aerial photographs to form a single image

58
Aerial mosaics and image maps Uncontrolled mosaics performed by assembling adjacent photographs without strict concern for geometric integrity

60
Aerial mosaics and image maps A controlled mosaic presents the detail of an aerial photograph in planimetrically correct position

62
Aerial mosaics and image maps An aerial index is created by placing adjacent area photographs together in their approximate relative position without represent econometric relationships –These are to be used as a guide for identifying those photographs that represent an area that is needed without searching the entire collection

64
Aerial mosaics and image maps Orthophotos are aerial photographs prepared using stereoscopic parallax and photogrammetric principles to remove the effects of relief displacement and tilt to provide a planimetrically correct aerial image

66
Aerial mosaics and image maps And orthophoto quadrangle is an orthophoto that represents the same region as the USGS topographic quadrangle –These can be thought of as image maps The digital orthophoto quadrangle (DOQ) is a digital version
 is a digital version")
67
Field observations and accuracy assessment Field observations are necessary because aerial imagery is not infallible or a total source of information –The information is derived through interpretation

68
Field observations and accuracy assessment Think of a map or GIS as a statement about conditions of a certain place –The more precise the statement, the more useful it is to the user Delineate small parcels, specific labels, etc. –The less precise the statement, the less useful The larger the parcels, more general labels, etc.

69
Field observations and accuracy assessment For example, a broad area labeled as a forest –Versus Smaller areas each individually labeled as oak, pine, and fir.

70
Field observations and accuracy assessment Field data are first-hand observations collected on the ground –Often use copies of images or maps to annotate in the field Field work can create delays, increased expense, and other difficulties –But it is essential for establishing the validity of the work

71
On-screen digitizing Traditionally, photointerpreters used transparent (mylar) overlays to show outlines, mark features, and make annotations –These then had to be digitized, transferred and registered to a planimetrically correct base layer
 overlays to show outlines, mark features, and make annotations –These then had to be digitized, transferred and registered to a planimetrically correct base layer")
73
Manual Digitizing Most common form of coordinate data input Requires a digitizing table –Ranging in size (25x25 cm to 150x200cm) Ideally the map should be flat and not torn or folded Cost: hundreds (300) to thousands (5000)
 Ideally the map should be flat and not torn or folded Cost: hundreds (300) to thousands (5000)")
74
On-screen digitizing In digital imagery it requires taking a raster image and putting a drawing a vector layer on top of it. –This all can be saved as one file –Can then be transferred directly to a GIS This is called heads-up digitizing

75
Raster-scanned image on the computer screen Operator follows lines on-screen in vector mode Heads-Up Digitizing II

78
Digitizing Errors Undershoots Dangles Spurious Polygons

79
On-screen digitizing Not inherently difficult Requires consistency and attention to detail Can be challenging –Edges can be difficult to identify –Shadows –Low image contrast

80
Accuracy Assessment Procedures well established to evaluate the accuracy of interpretation –For maps with polygons of specific types, an overall map accuracy and individual class accuracies can be determined Requires a set of reference data points that have known characteristics –Ideally should be random –That may miss some categories, so, often random selection combined with collecting across all classes and across the entire study area

81
Accuracy Assessment Should keep field collected data for input separate from, field data used for accuracy assessment Assessment is a table called the error matrix –Each reference point and its matching map label are compared

86
The kappa statistic There are so many values in the error matrix that it becomes confusing to people. –Want a single number that encapsulates the significance of the error matrix. –This is the kappa (κ) statistic Difference between the observed agreement reported by the diagonal and the agreement that might be due solely to chance
 statistic Difference between the observed agreement reported by the diagonal and the agreement that might be due solely to chance.")
87
The kappa statistic Kappa is estimated by k hat Observed = accuracy reported in error matrix –Sum correct / total Expected = correct classification due to chance

88
The kappa statistic The statistic adjusts the percentage correct by subtracting the estimated contribution of chance agreement –A κ=0.83 means that the classification is 83% better than would be expected from chance assignment of pixels to categories –Kappa ranges between +1 and -1

89
Interpretation Equipment Paper prints or transparencies Magnification Flatbed scanners –Dpi – up to about 3500 Light tables Densitometers Stereo imagery equipment

Similar presentations
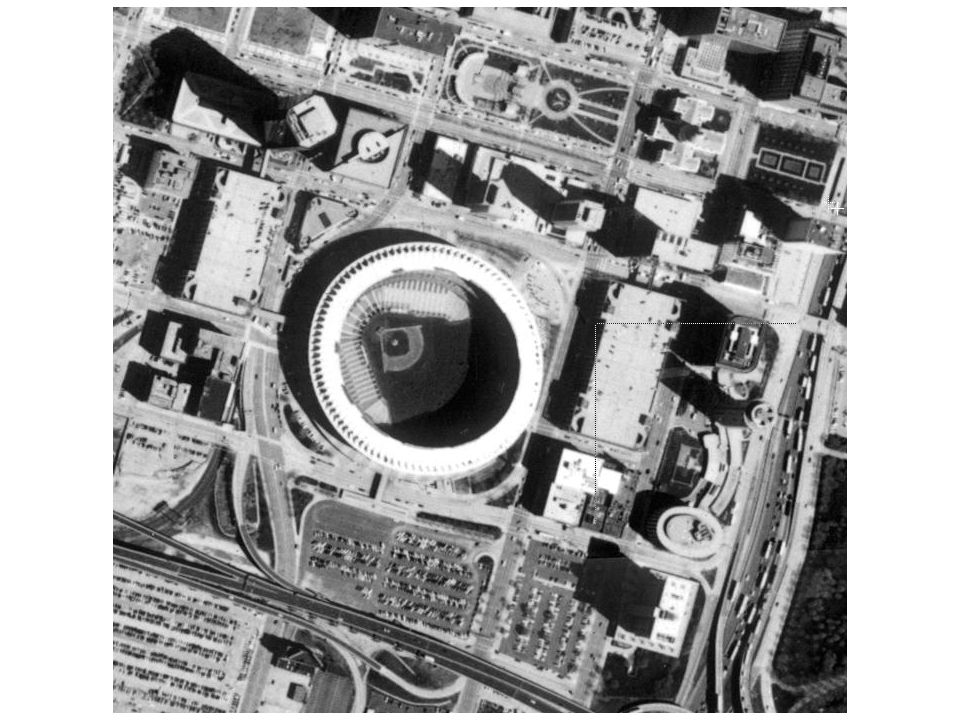
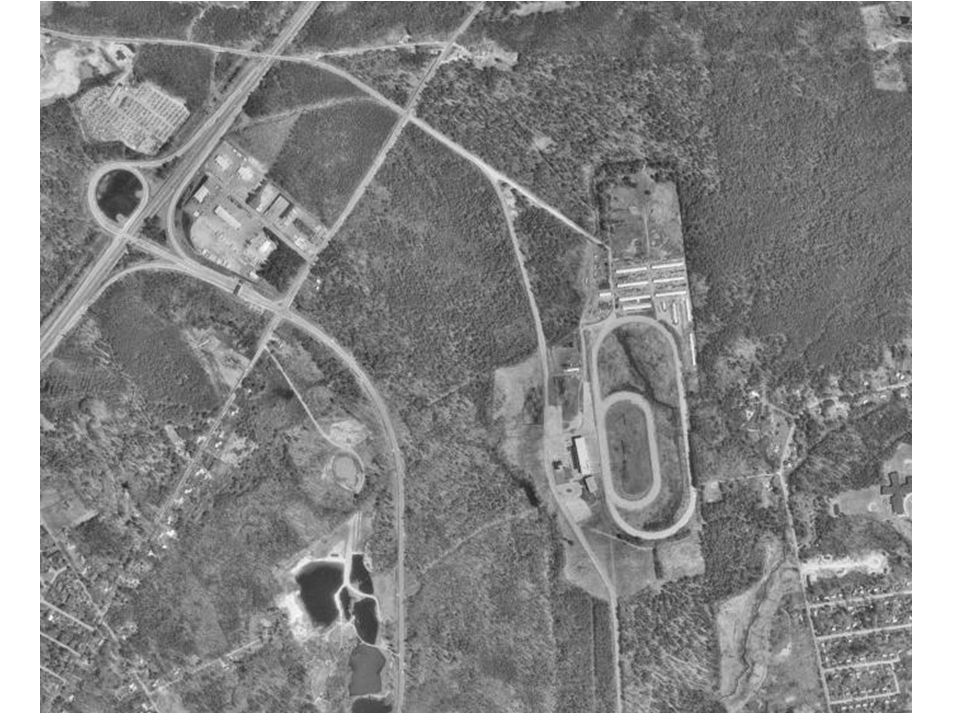
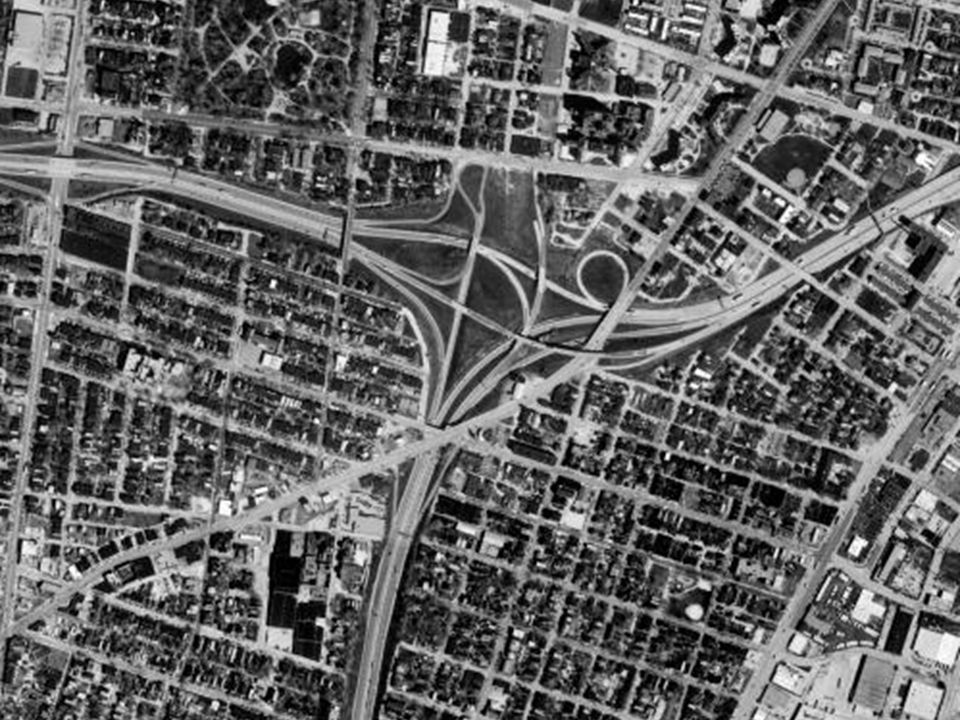

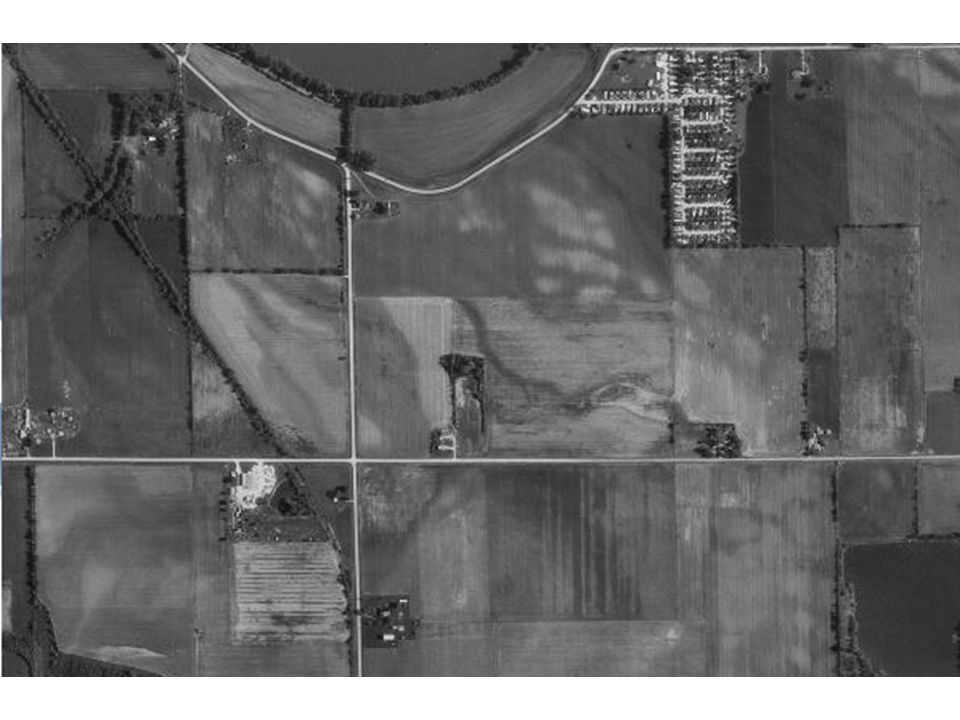
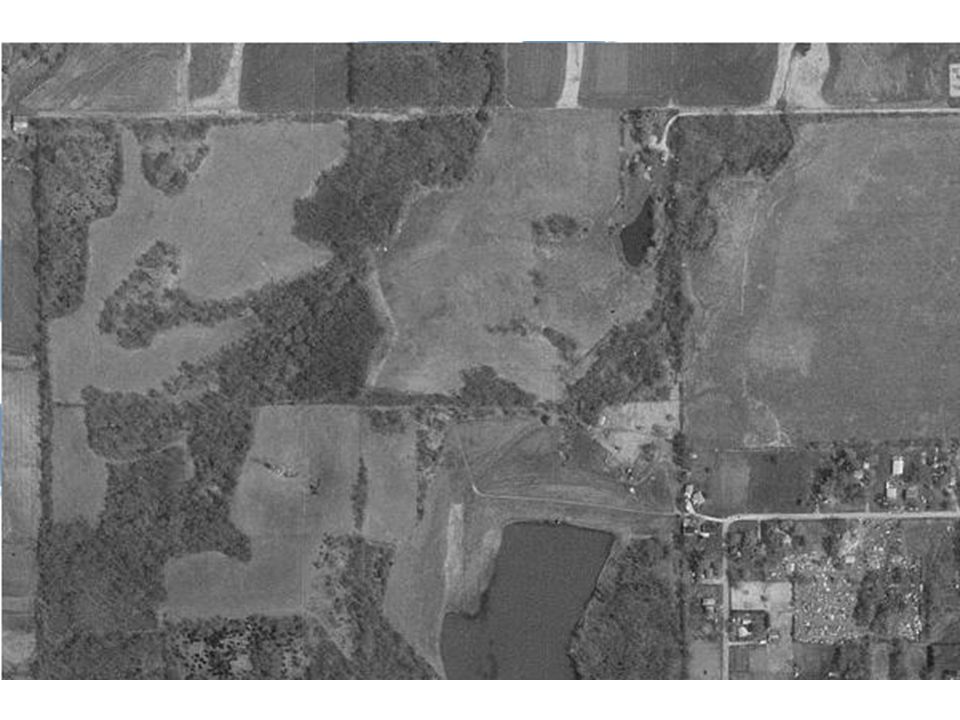
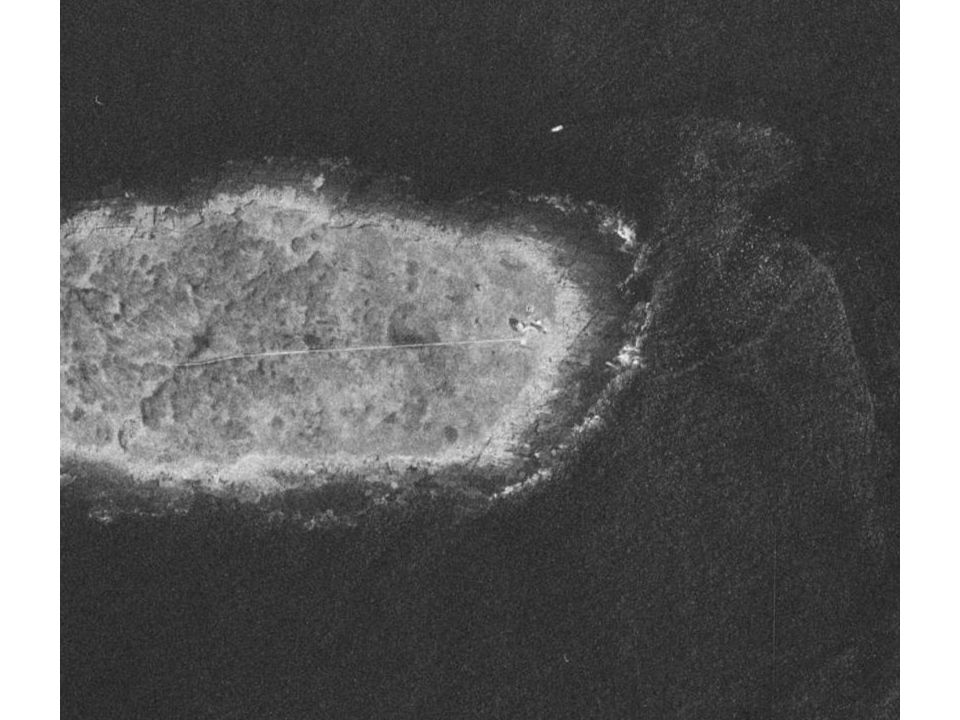
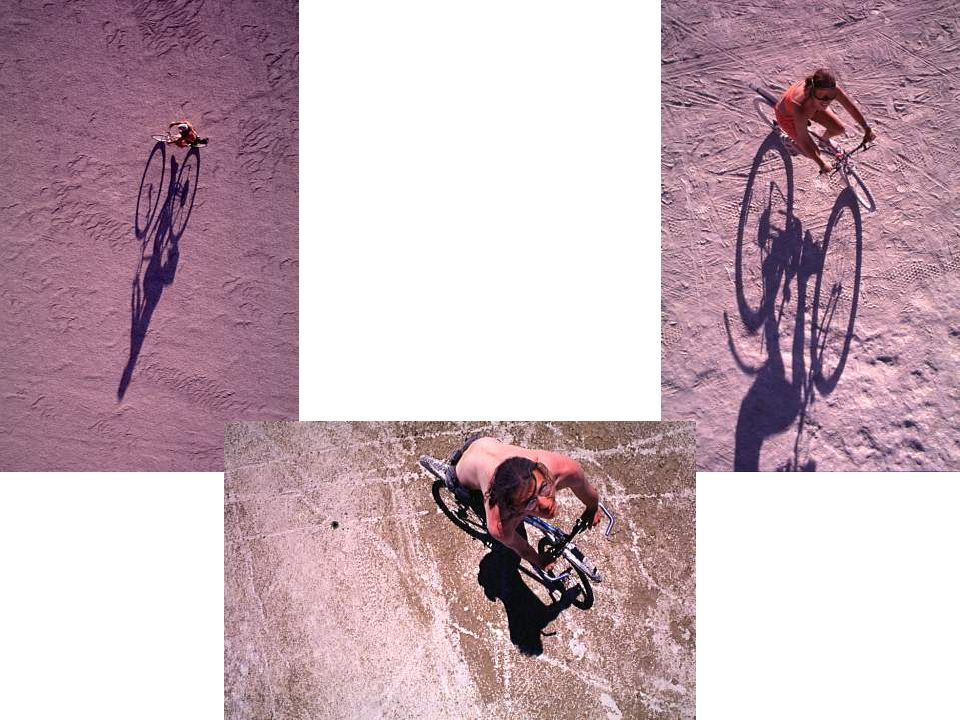
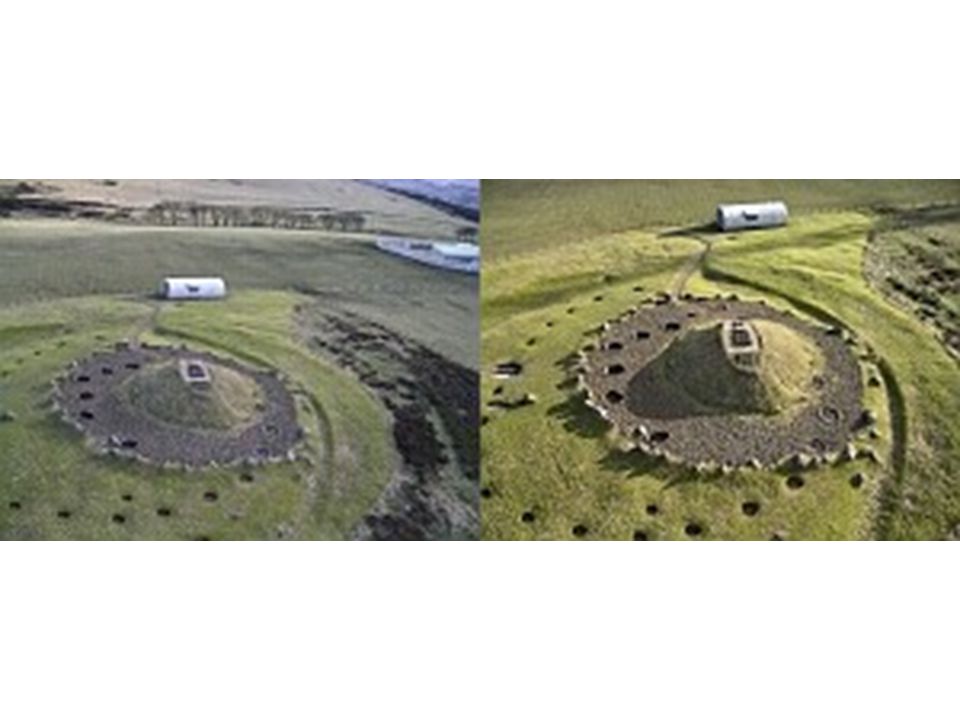
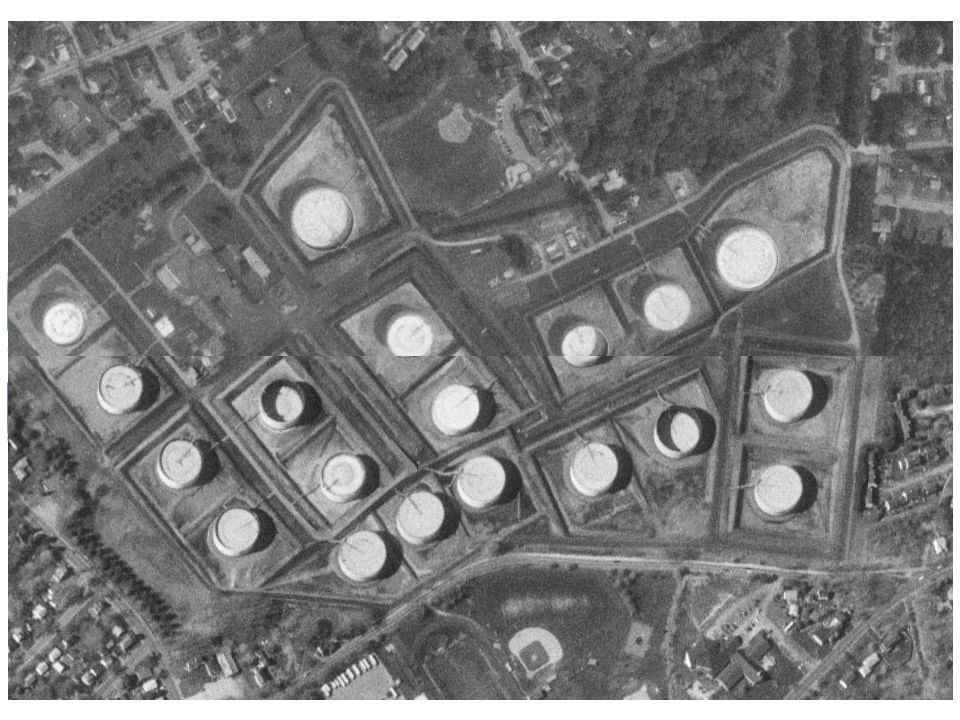
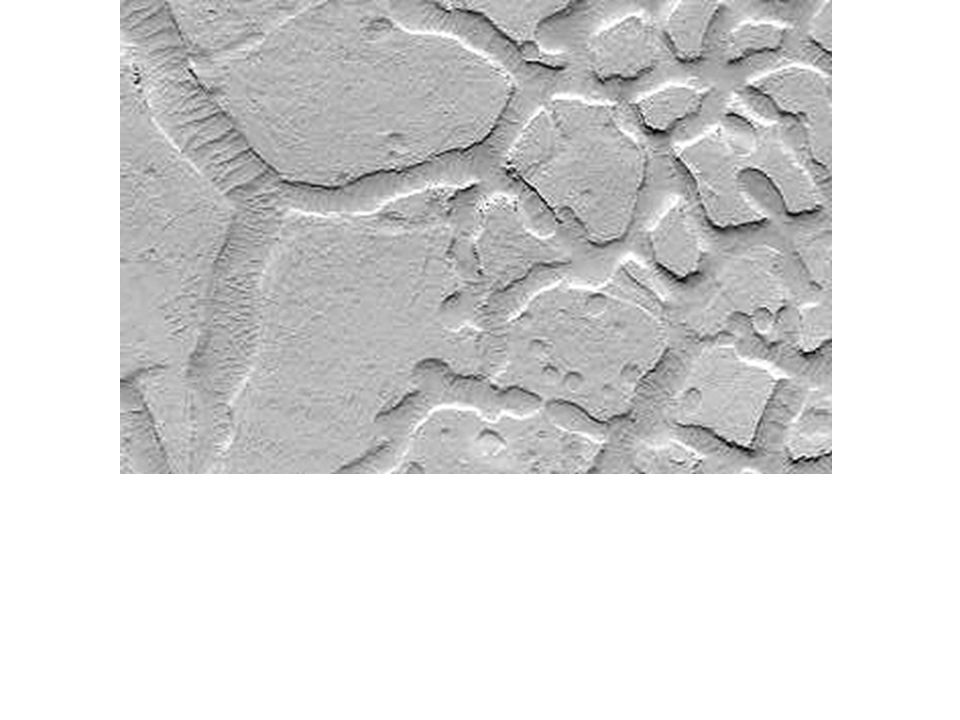
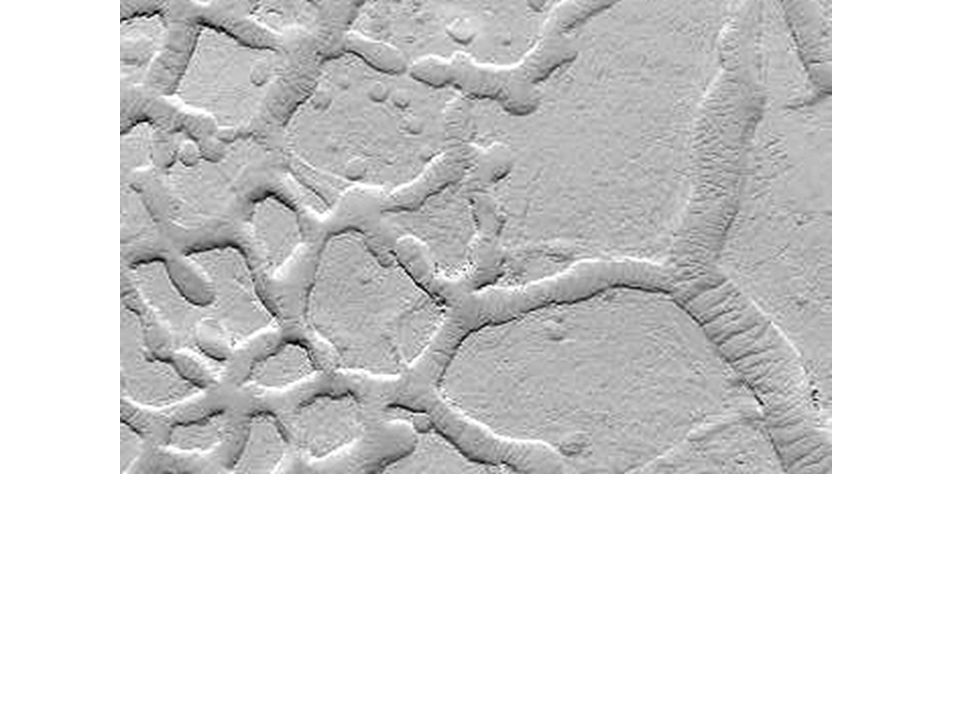
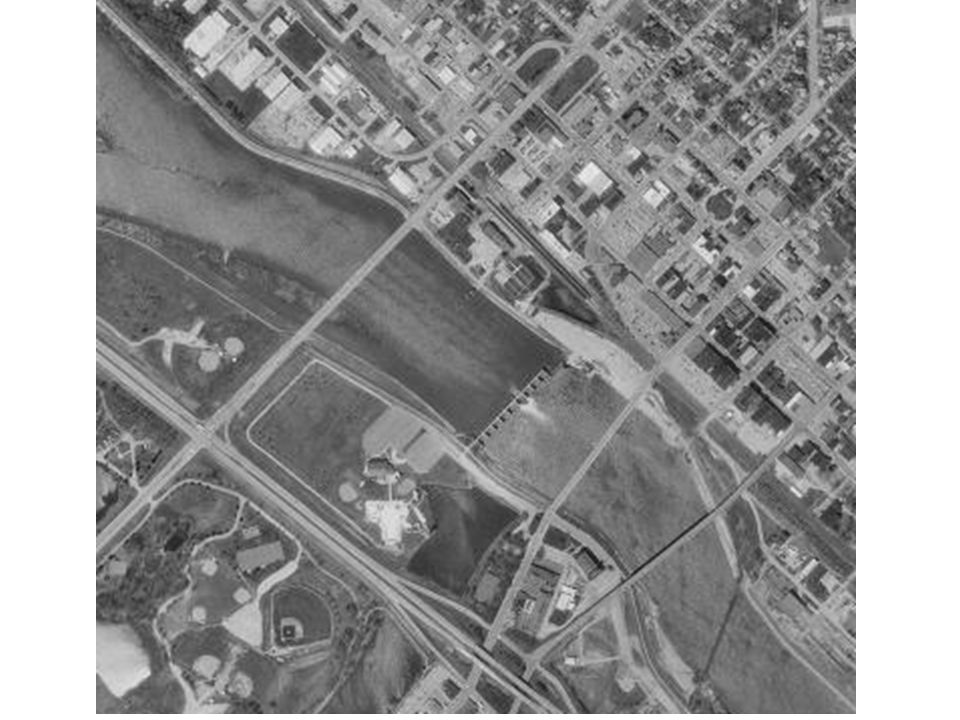
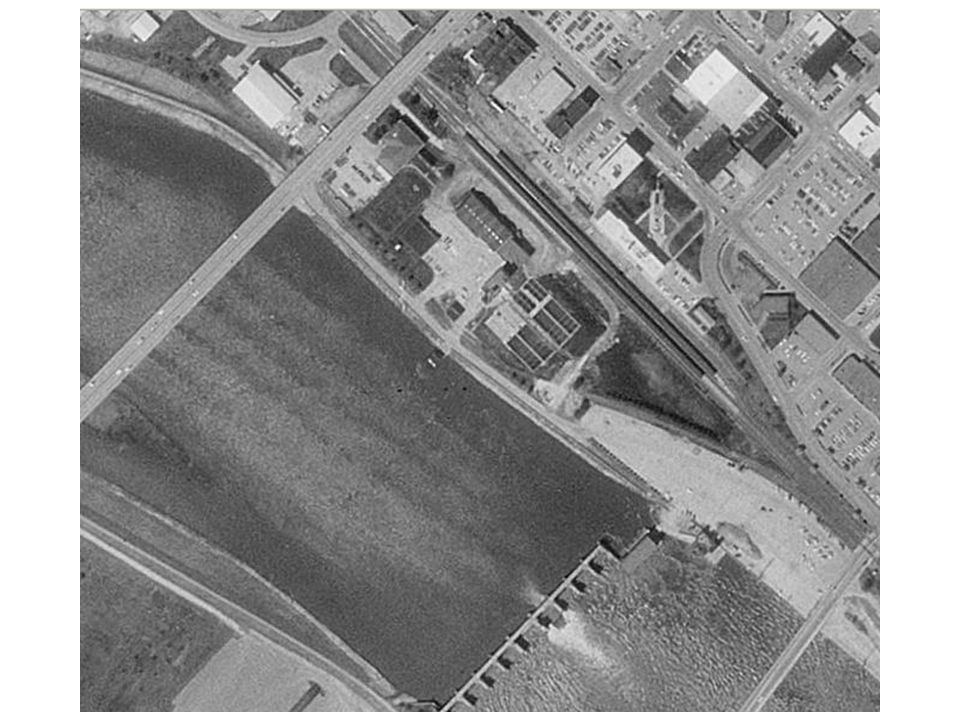
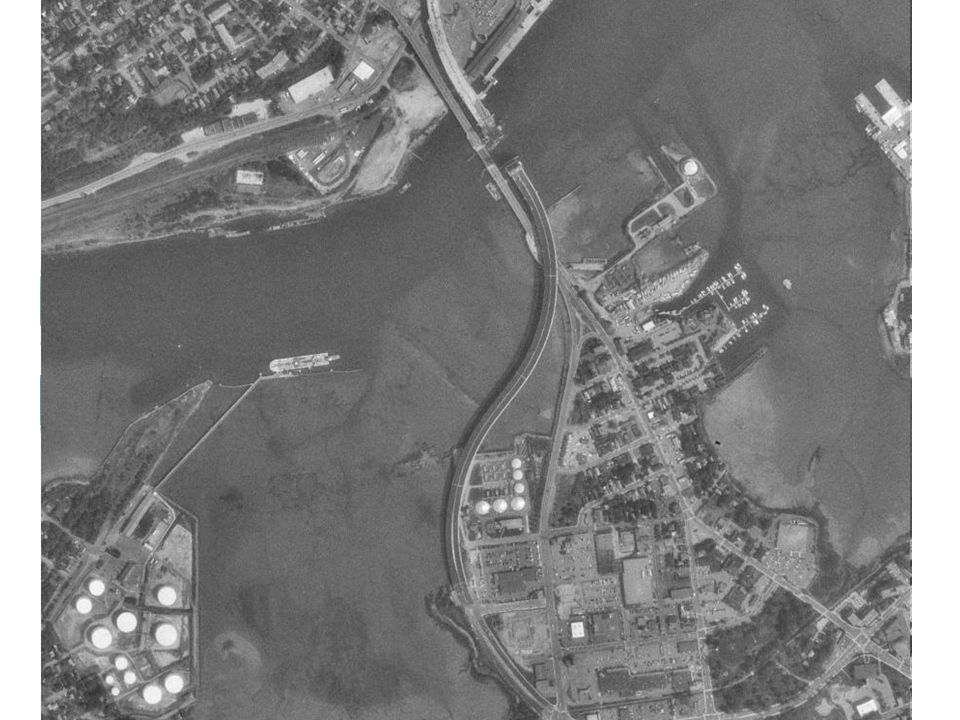
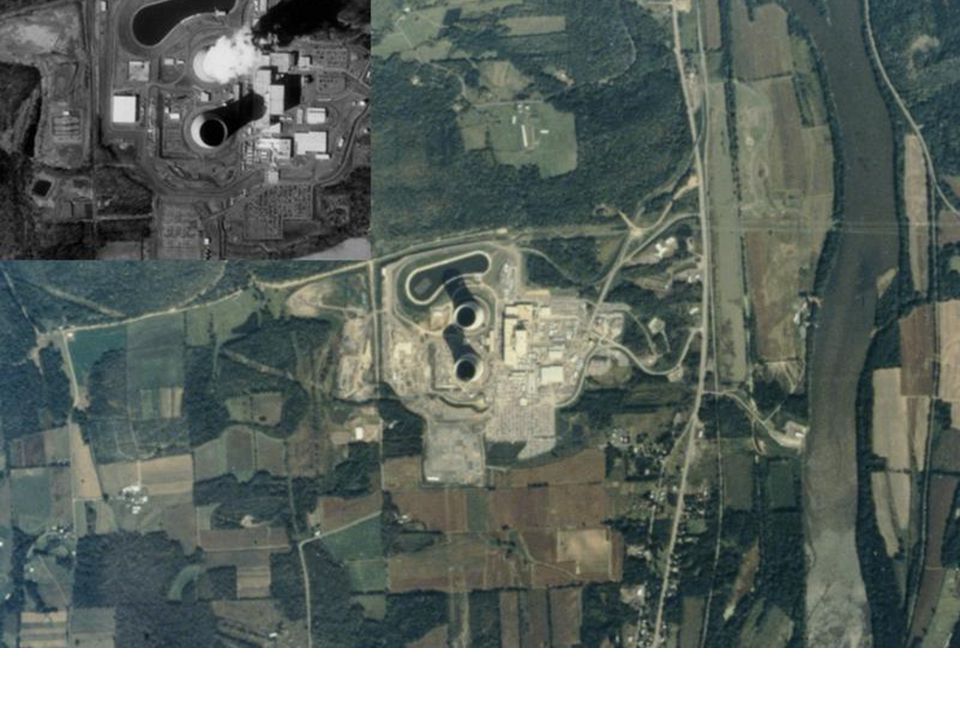
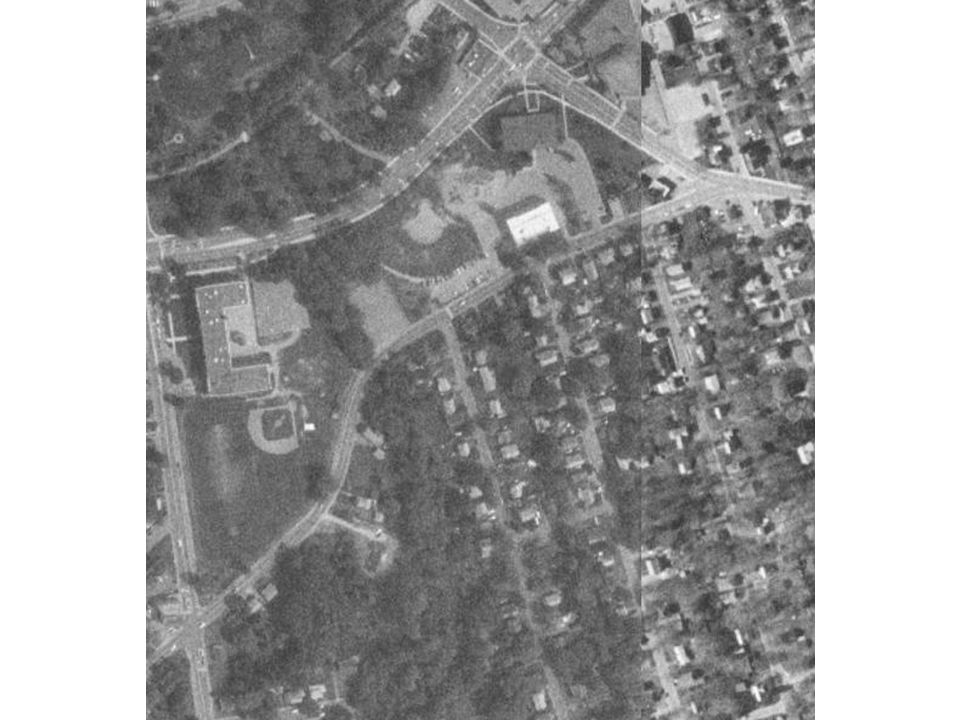
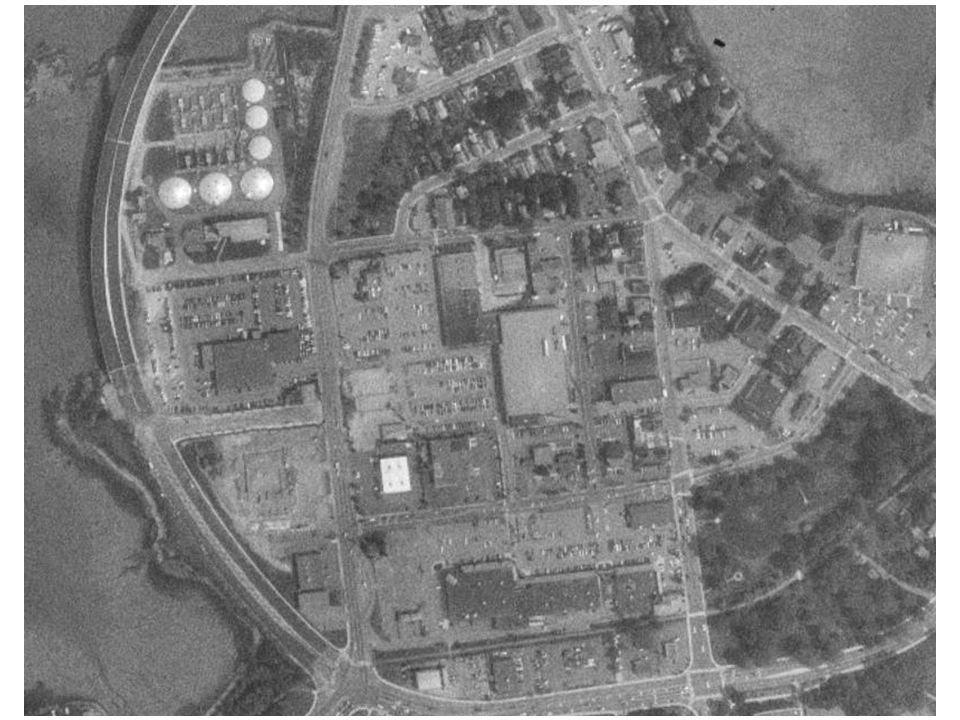
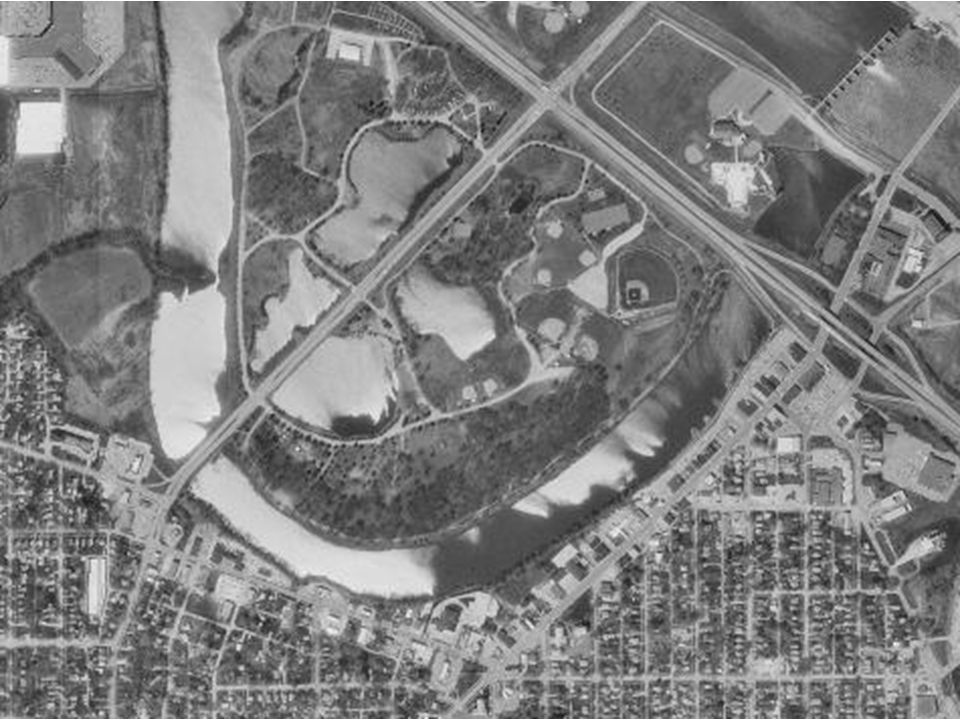
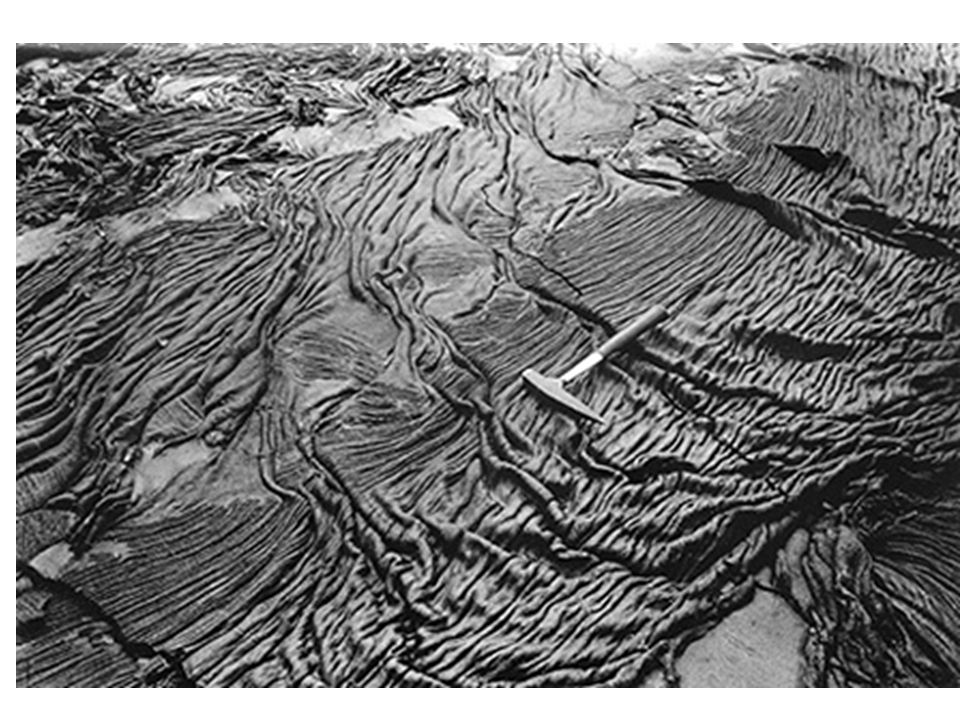
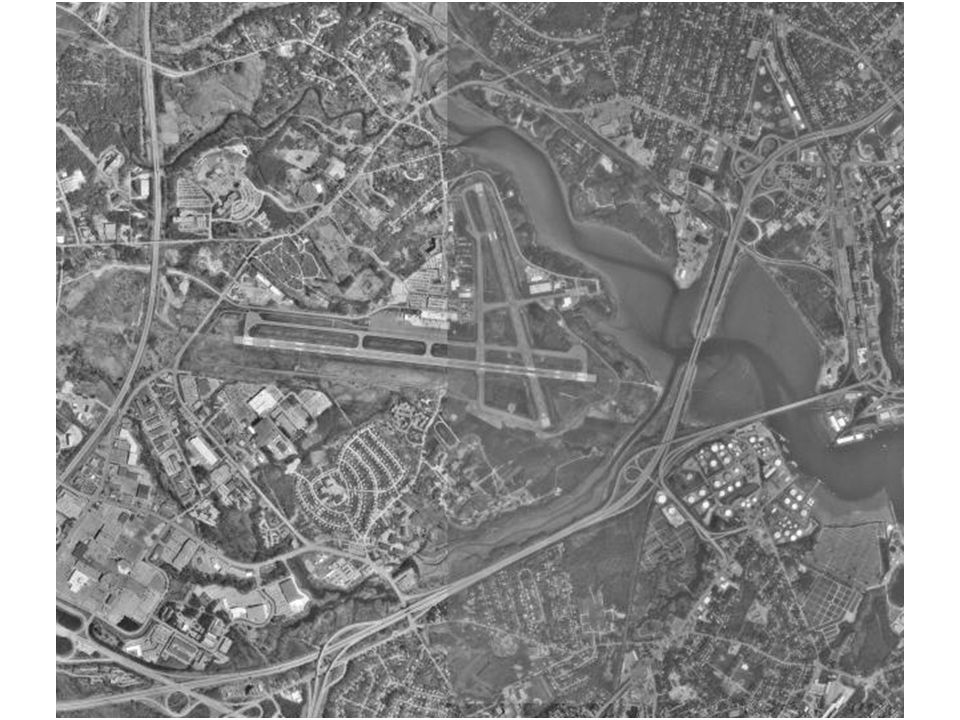
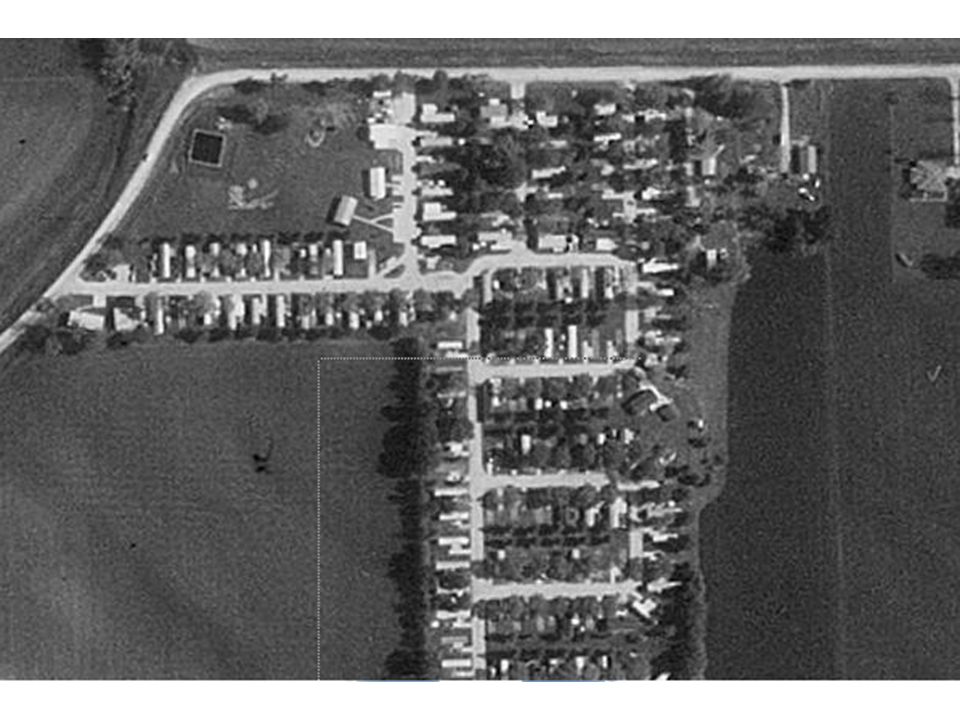
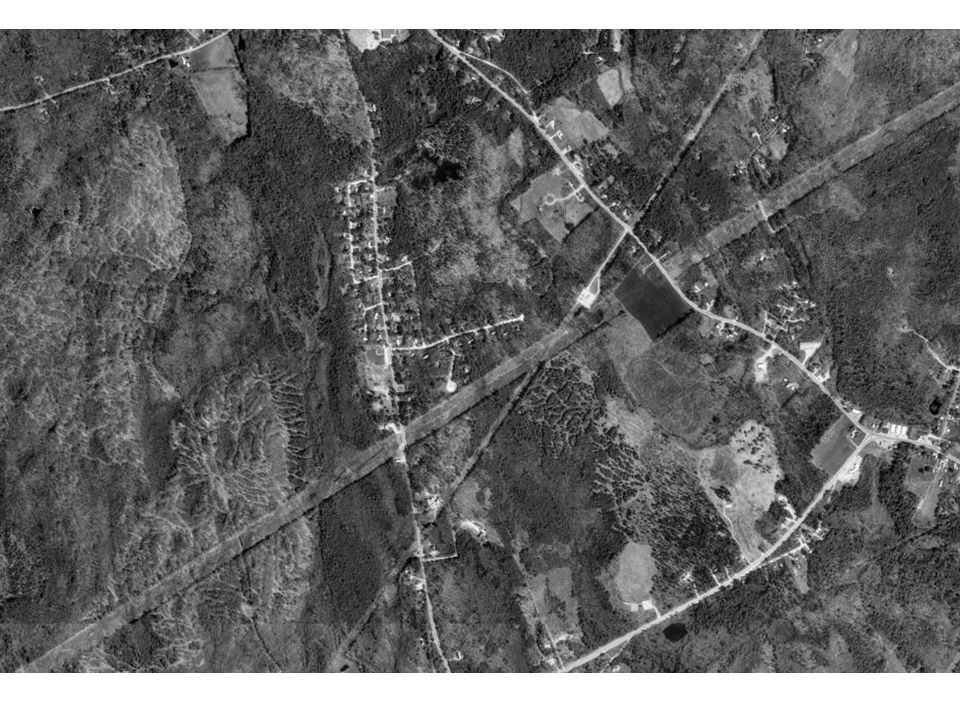
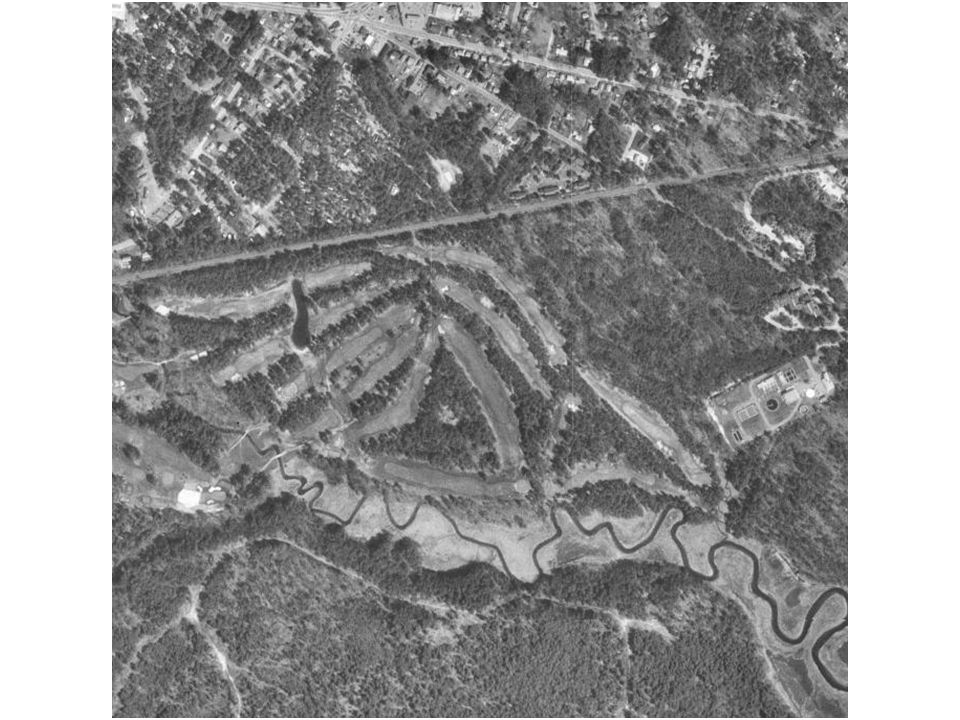
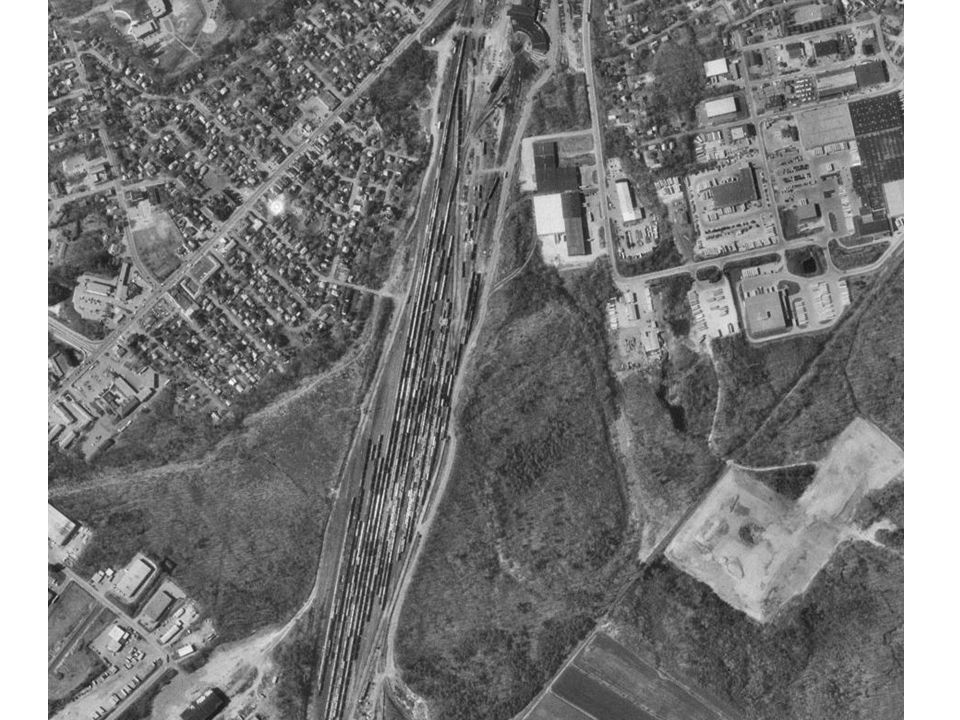
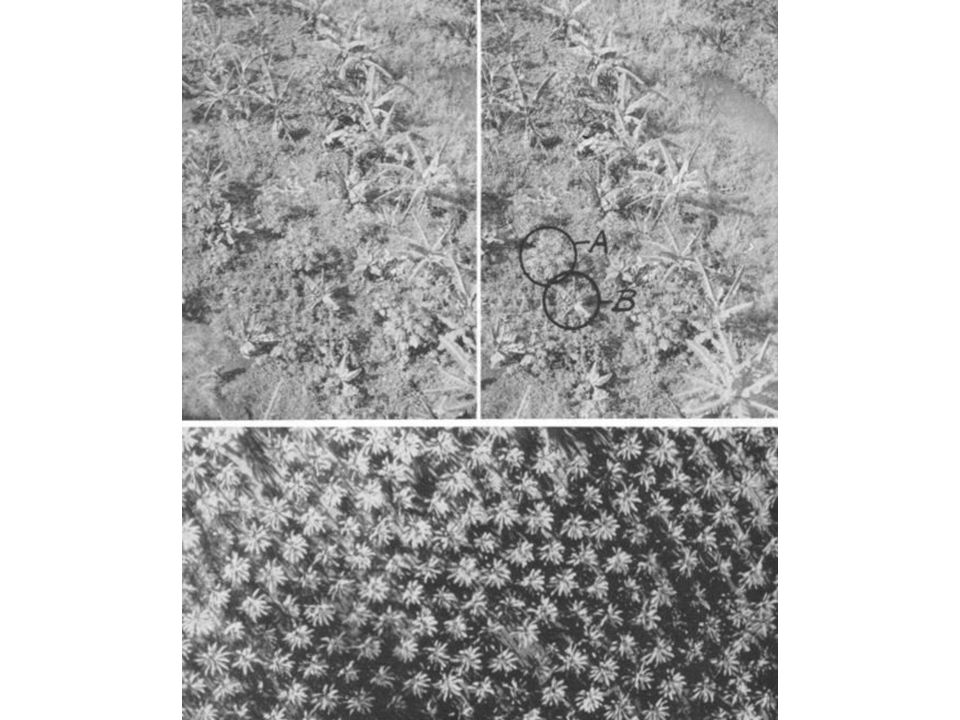
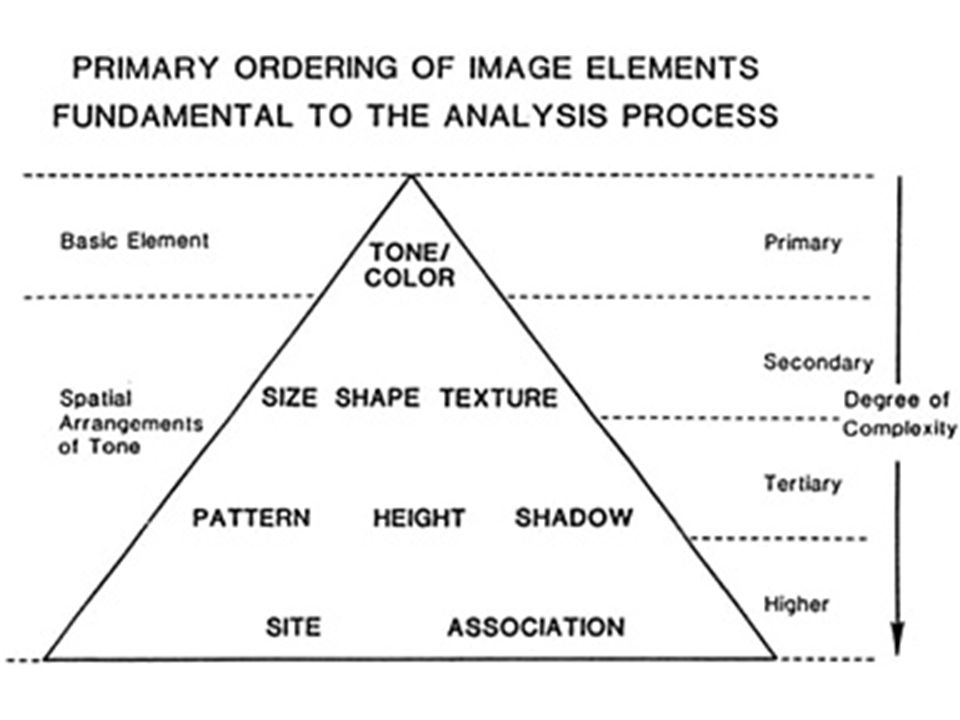
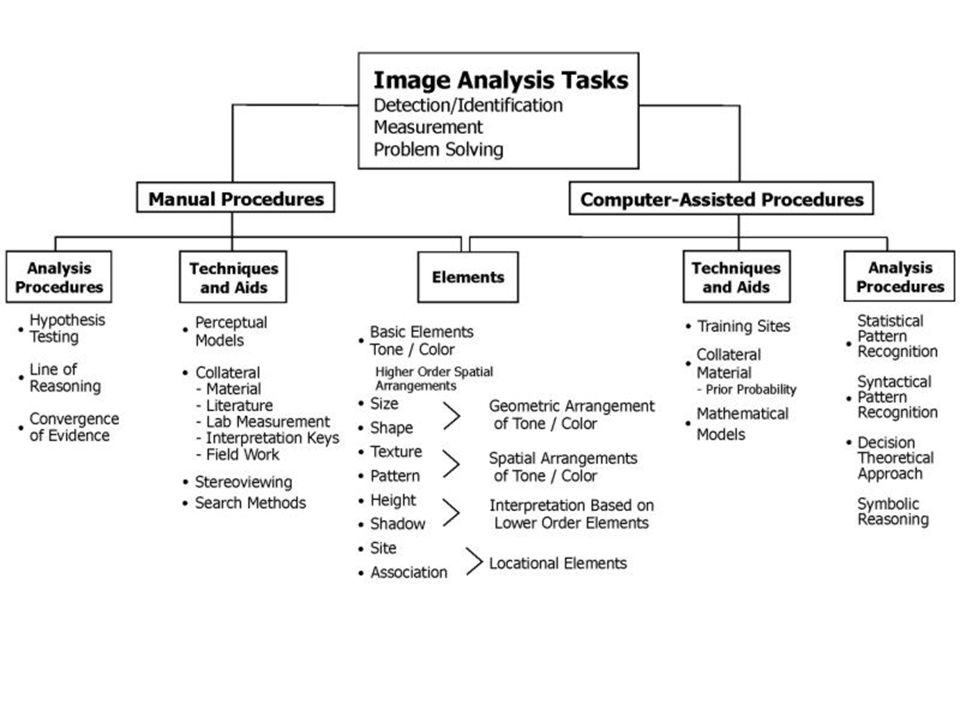
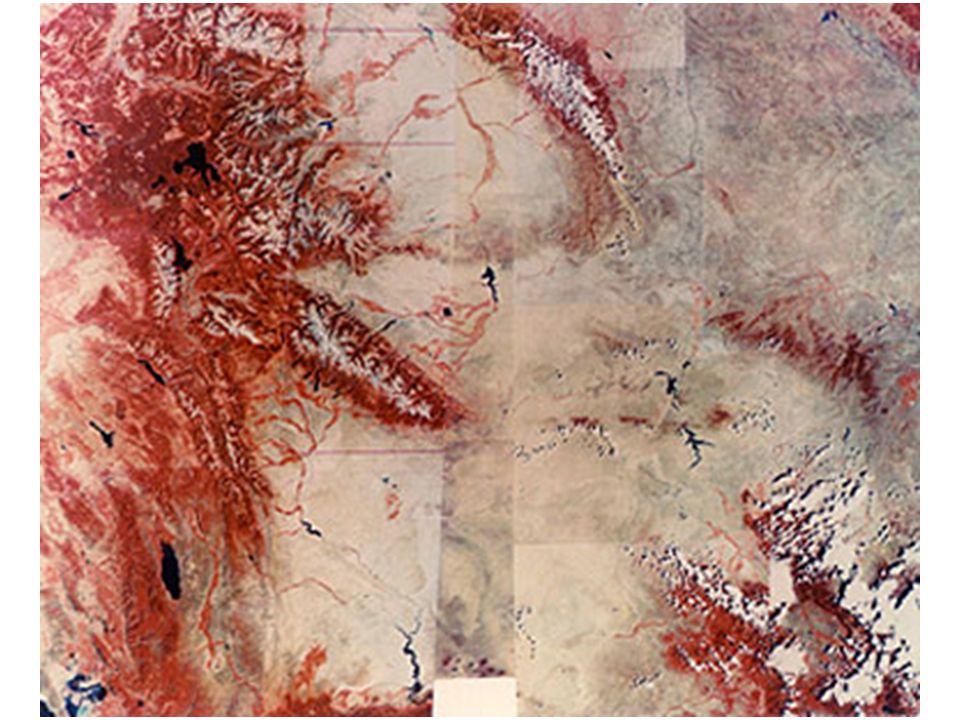
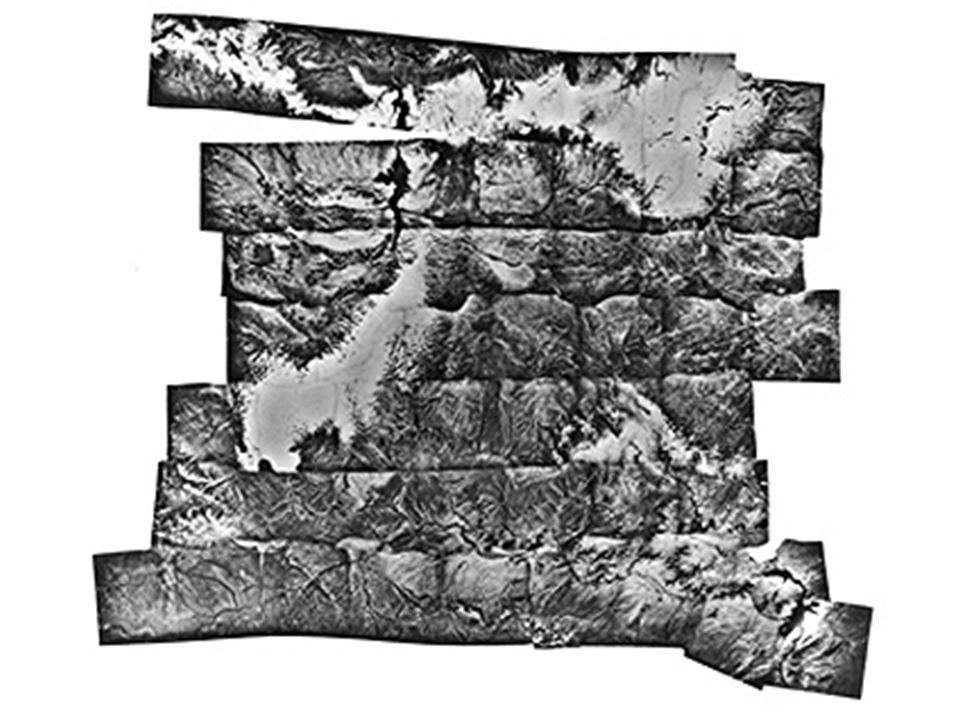
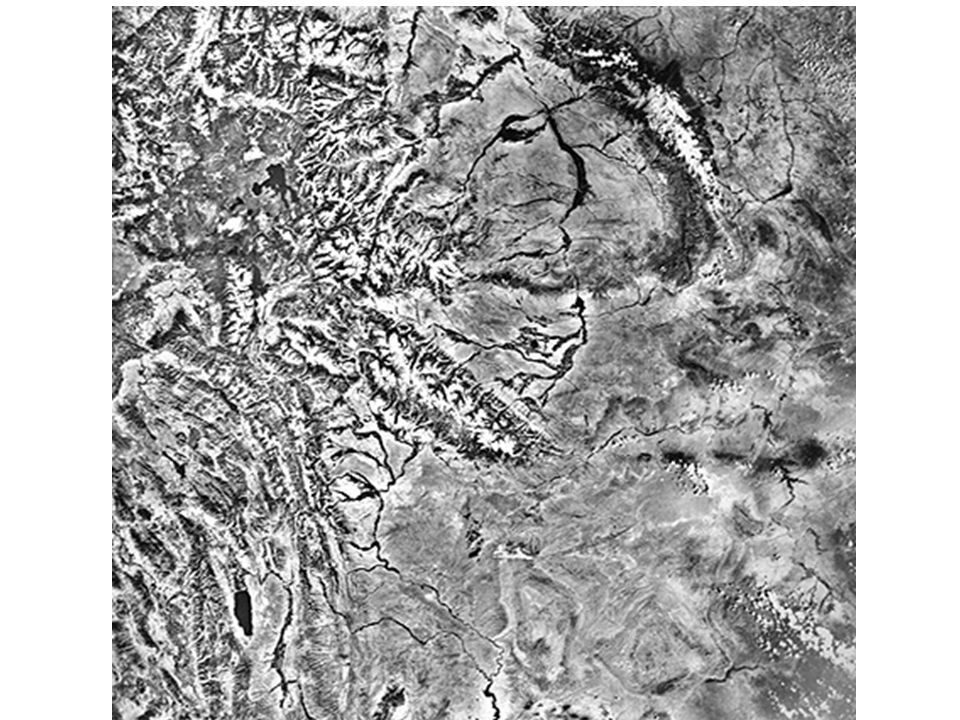
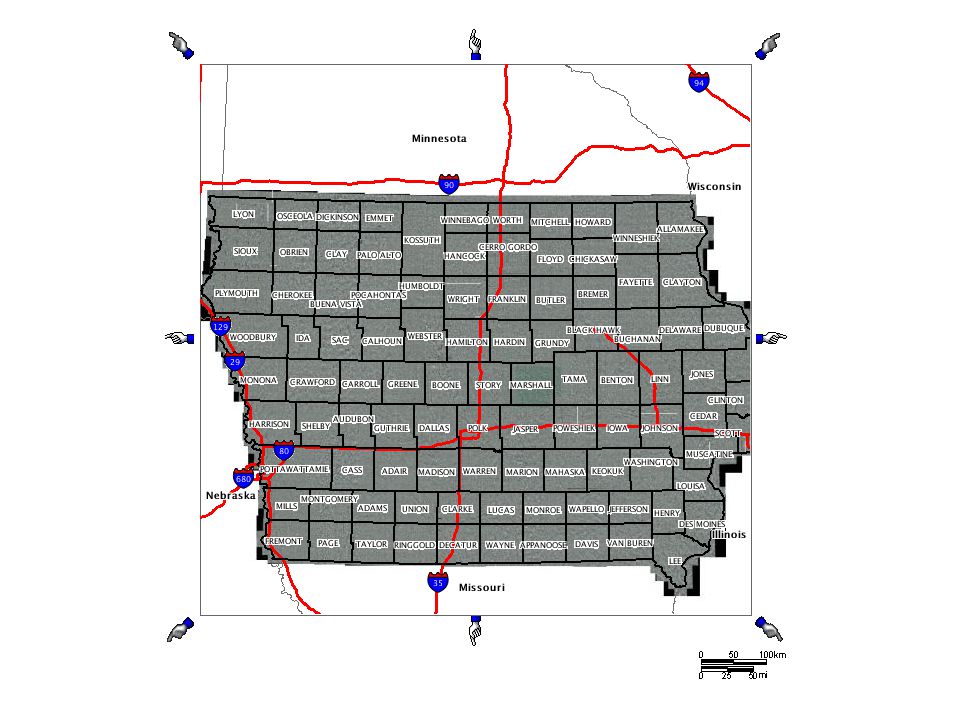
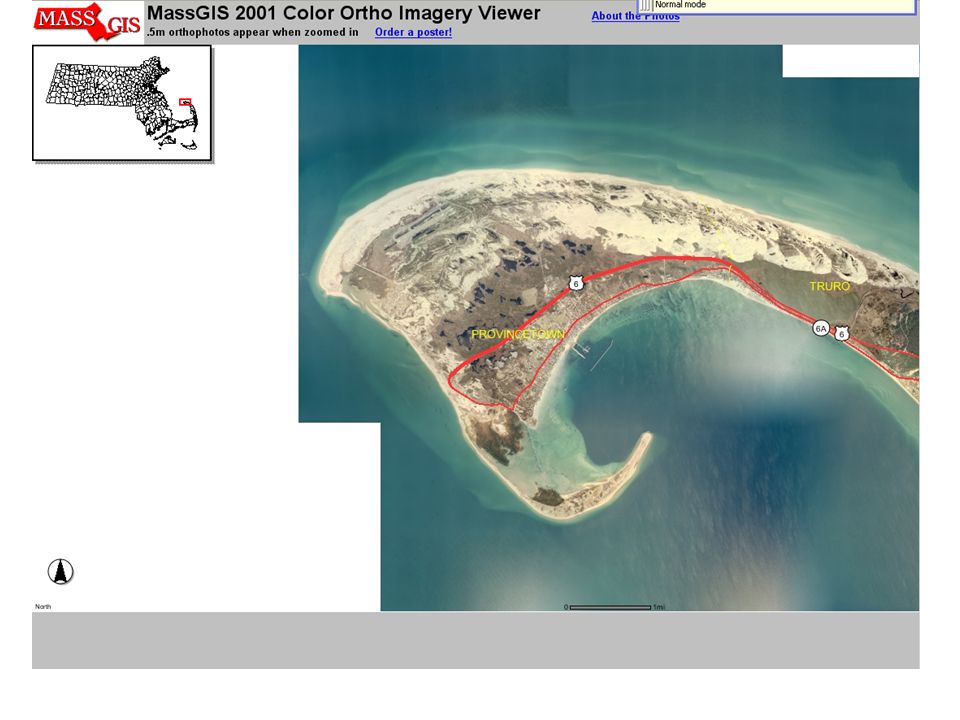

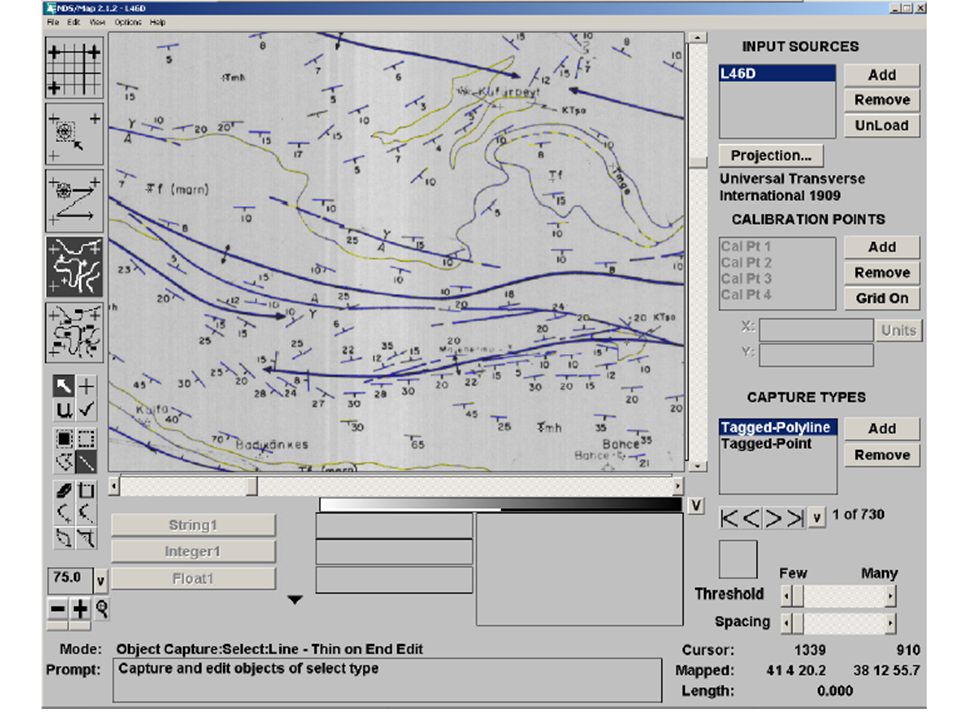
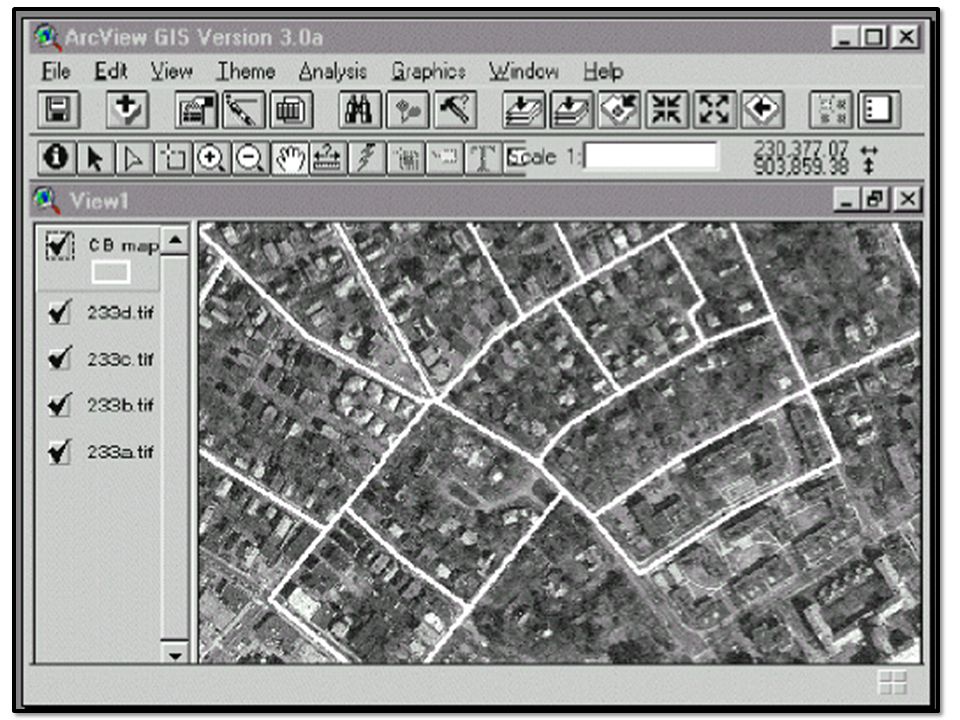
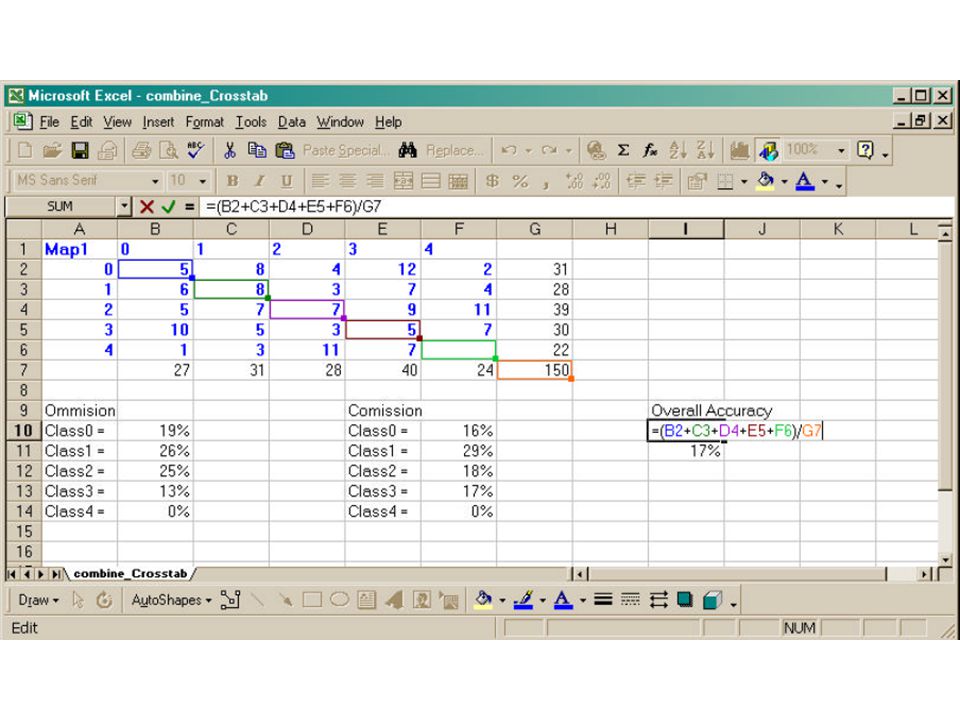
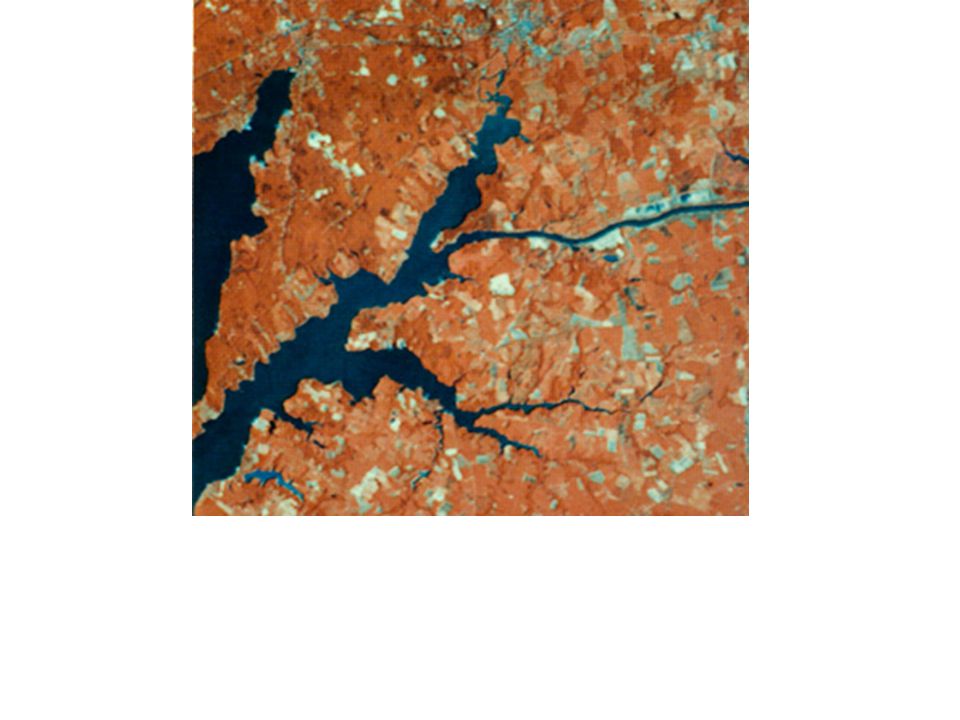
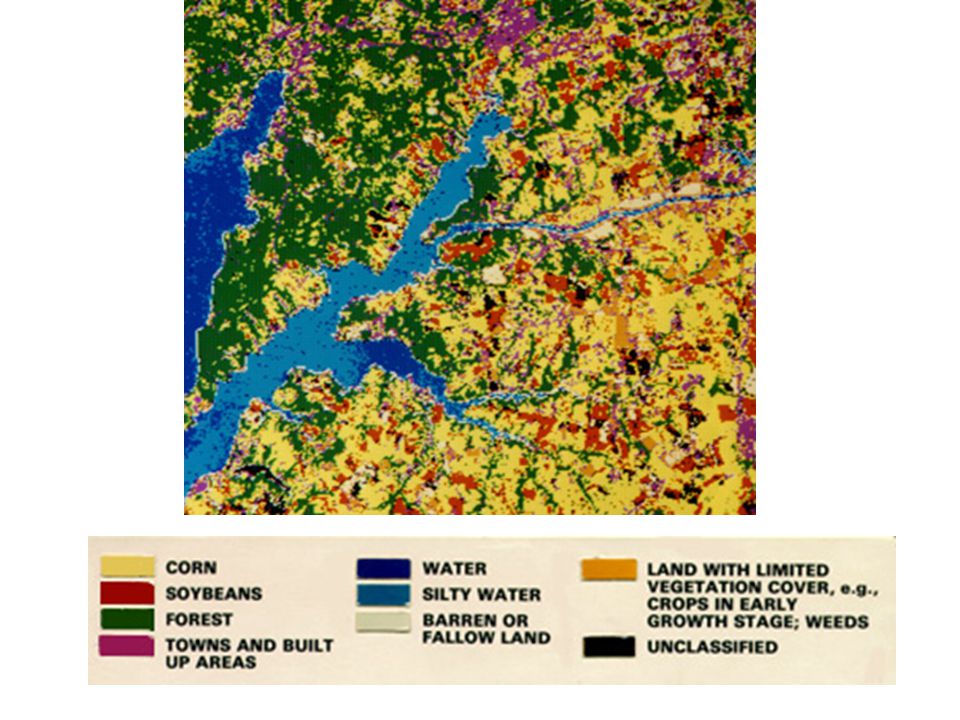
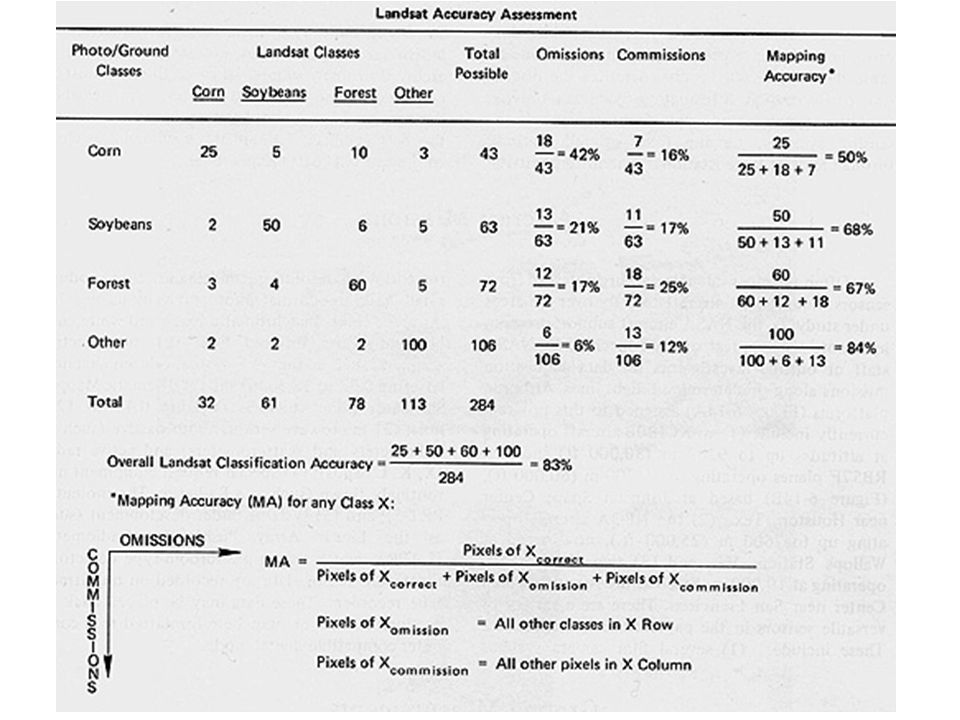


 Image Quality Assessment Radiometric Correction Geometric Correction Image Classification Introduction.>")


