Download presentation
Presentation is loading. Please wait.

1
Approximate Dynamic Programming for High-Dimensional Asset Allocation Ohio State April 16, 2004 Warren Powell CASTLE Laboratory Princeton University http://www.castlelab.princeton.edu © 2003 Warren B. Powell, Princeton University

2
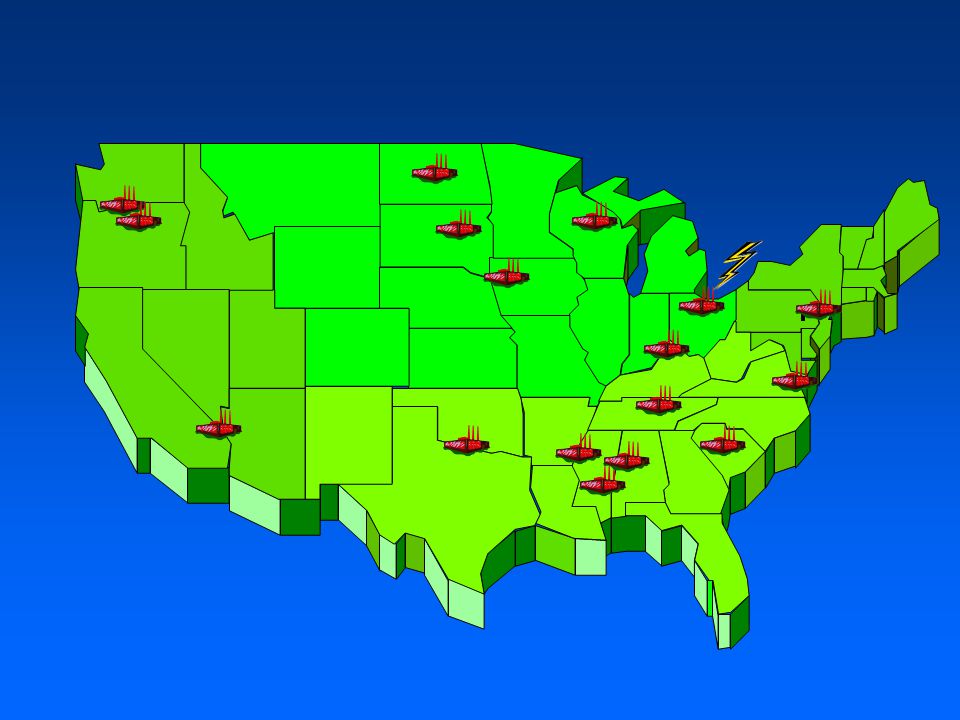
© 2004 Warren B. Powell Slide 2 Yellow Freight System © 2002 Warren B. Powell, Princeton University

3
© 2004 Warren B. Powell Slide 3

4
© 2004 Warren B. Powell Slide 4

5
© 2004 Warren B. Powell Slide 5

6
© 2004 Warren B. Powell Slide 6 Air Mobility Command Air Mobility Command Fuel Cargo Handling Ramp Space Maintenance Cargo Holding

7
© 2004 Warren B. Powell Slide 7 The optimization challenge

9
Special equipment

10
Schneider National

16
© 2004 Warren B. Powell Slide 16 Resources Tasks Time 0 The dynamic assignment problem

17
© 2004 Warren B. Powell Slide 17 Resources Tasks Time 1Time 0 The dynamic assignment problem

18
© 2004 Warren B. Powell Slide 18 Resources Tasks Time 1Time 0Time 2 The dynamic assignment problem

19
© 2004 Warren B. Powell Slide 19 Multidimensional attribute spaces decision d

20
© 2004 Warren B. Powell Slide 20 Multidimensional attribute spaces decision d’

21
© 2004 Warren B. Powell Slide 21 Multidimensional attribute spaces ? ?

22
© 2004 Warren B. Powell Slide 22 State variables Modeling the fleet management problem: »State variables: »Control variables:

23
© 2004 Warren B. Powell Slide 23 State variables We can formulate the problem of determining what to do with our truck as a dynamic program:

24
© 2004 Warren B. Powell Slide 24 Hierarchical Aggregation Attribute vectors tend to become increasingly more complex:

25
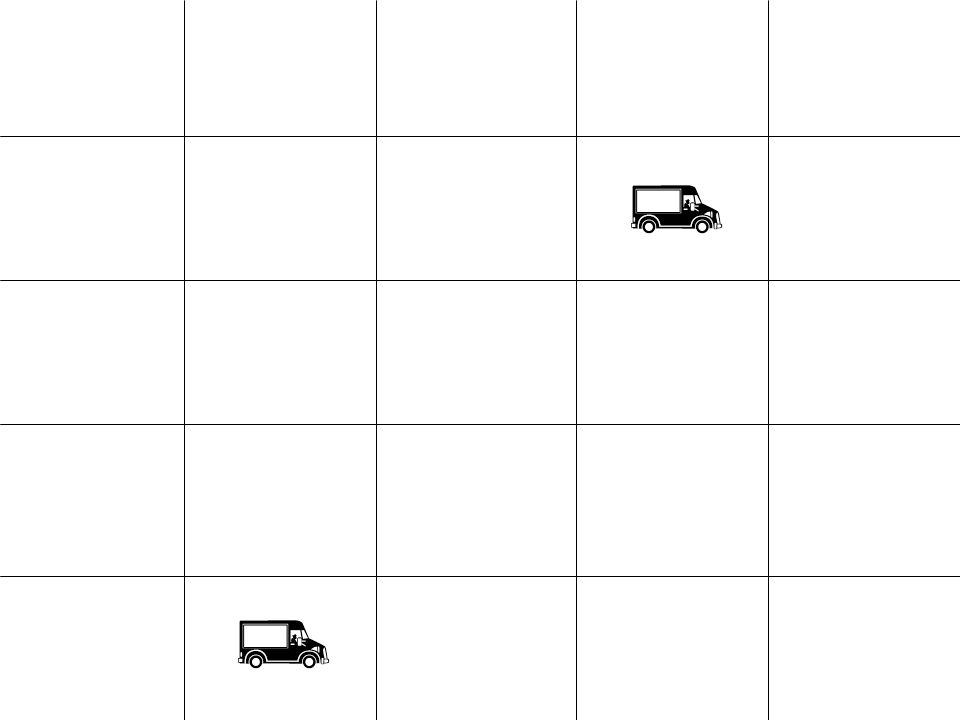
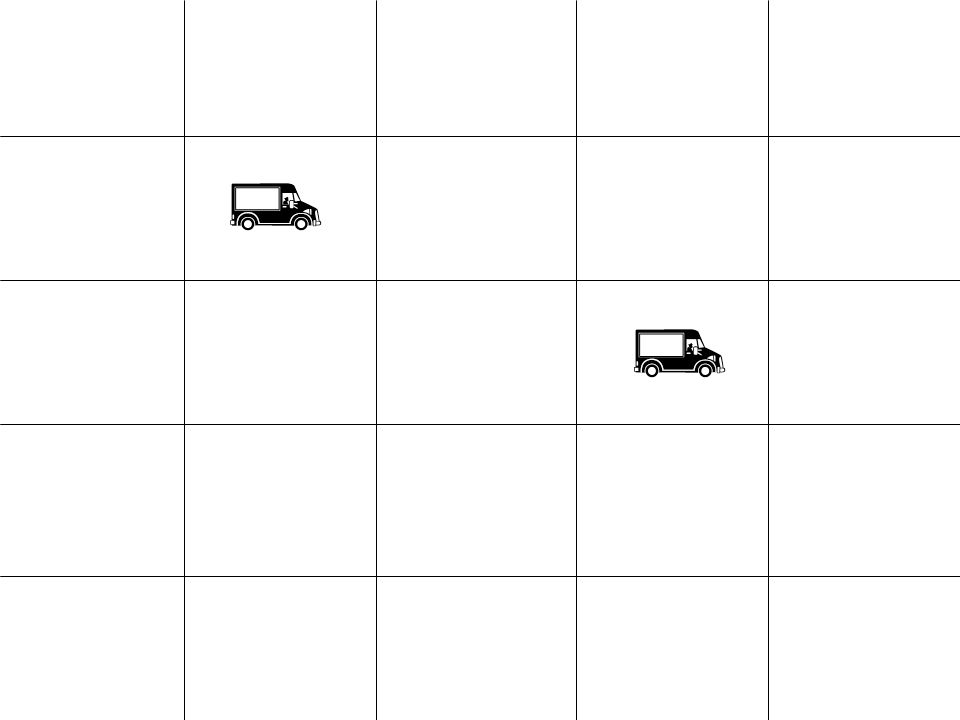
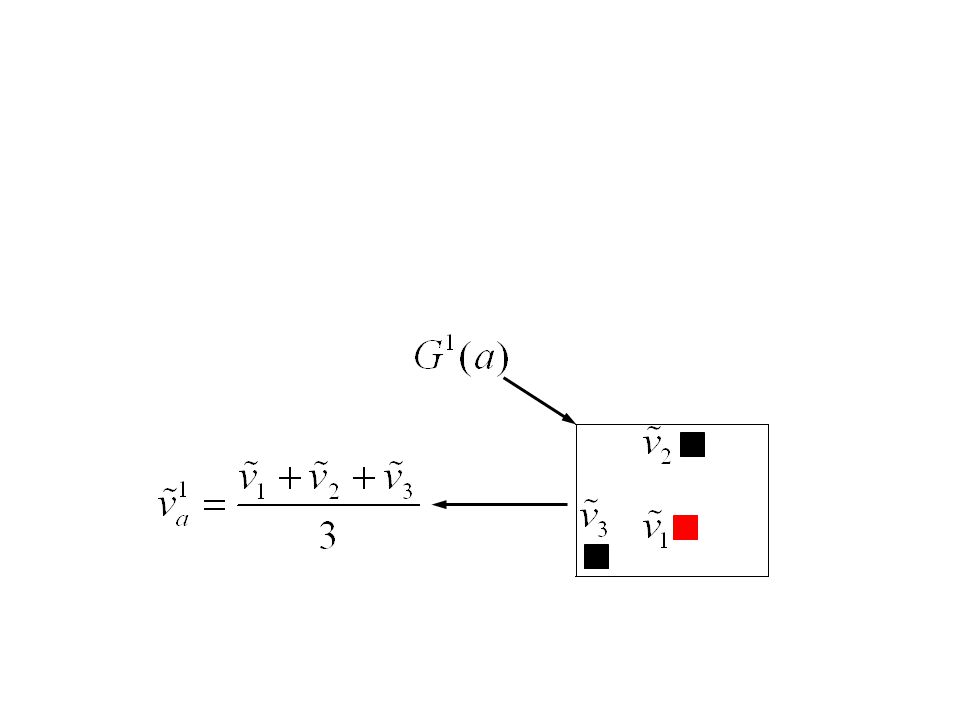
© 2004 Warren B. Powell Slide 25 State variables If we only have N=1 truck:

35
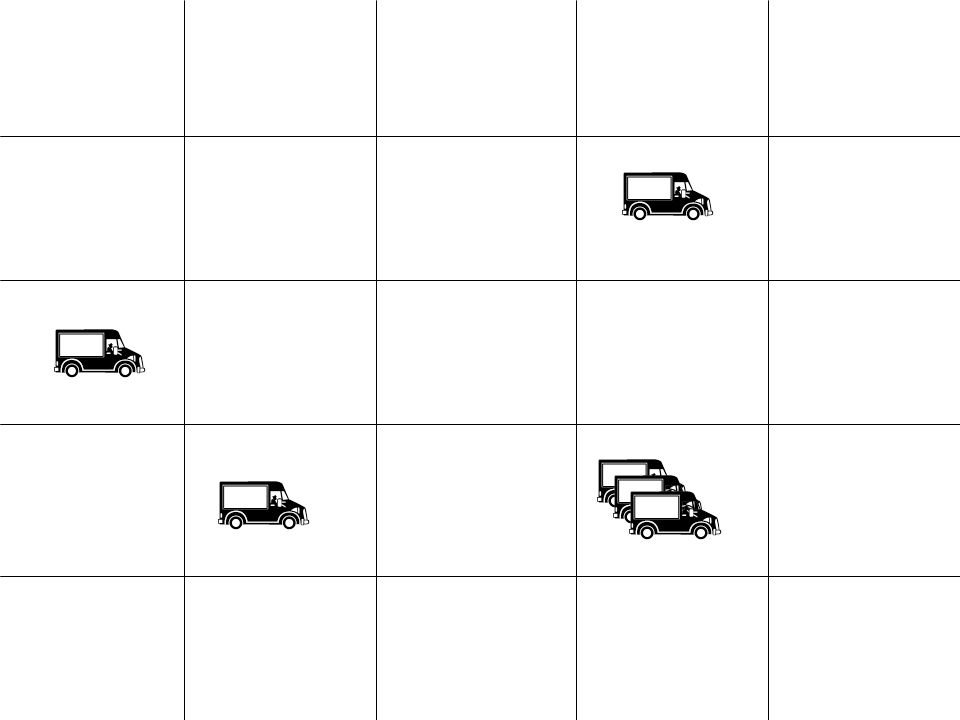
© 2004 Warren B. Powell Slide 35 State variables What if we have N > 1 trucks?

36
© 2004 Warren B. Powell Slide 36 Computational challenge A sequence of algorithmic challenges: »Step 1: Managing multiple, simple assets. »Step 2: Managing a single, complex asset »Step 3: Managing multiple, complex assets

37
Outline An algorithmic strategy for high-dimensional dynamic programs.

38
© 2004 Warren B. Powell Slide 38 Approximate dynamic programming Systems evolve through a cycle of exogenous and endogenous information Time

39
© 2004 Warren B. Powell Slide 39 Approximate dynamic programming Systems evolve through a cycle of exogenous and endogenous information Time

40
© 2004 Warren B. Powell Slide 40 Approximate dynamic programming Using this state variable, we obtain the optimality equations: Problem: Curse of dimensionality Three curses State space Outcome space Action space (feasible region)
.")
41
© 2004 Warren B. Powell Slide 41 Approximate dynamic programming The computational challenge: How do we find ? How do we compute the expectation? How do we find the optimal solution?

42
© 2004 Warren B. Powell Slide 42 Approximate dynamic programming Approximation methodology: Can’t compute this!!!Don’t know what this is!

43
© 2004 Warren B. Powell Slide 43 Adaptive dynamic programming Alternative: Change the definition of the state variable: Time

44
© 2004 Warren B. Powell Slide 44 Adaptive dynamic programming Now our optimality equation looks like: We drop the expectation and solve the conditional problem: Finally, we substitute in our approximation:

45
© 2004 Warren B. Powell Slide 45 Adaptive dynamic programming Approximating the value function: »We choose approximations of the form:

46
Outline Managing multiple, simple assets

47
© 2004 Warren B. Powell Slide 47

48
© 2004 Warren B. Powell Slide 48 Norfolk Southern

49
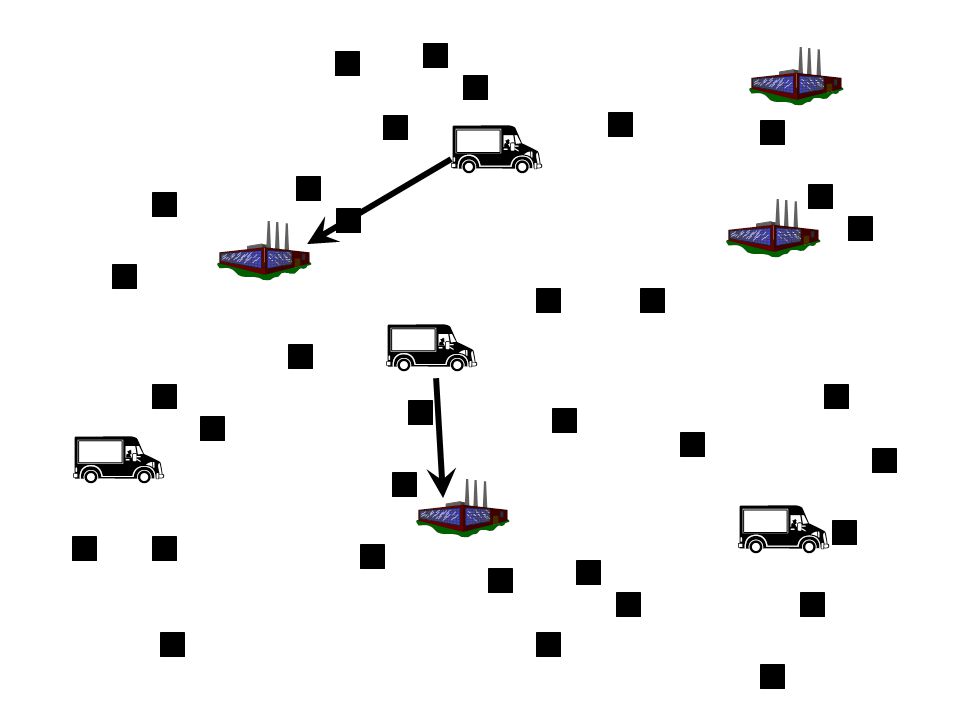
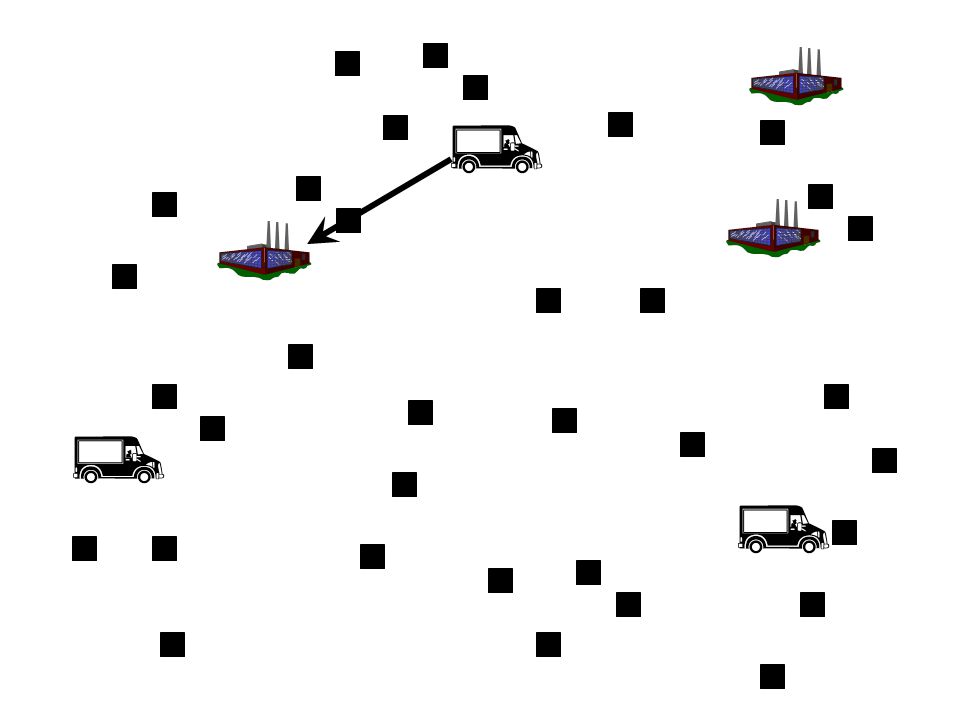
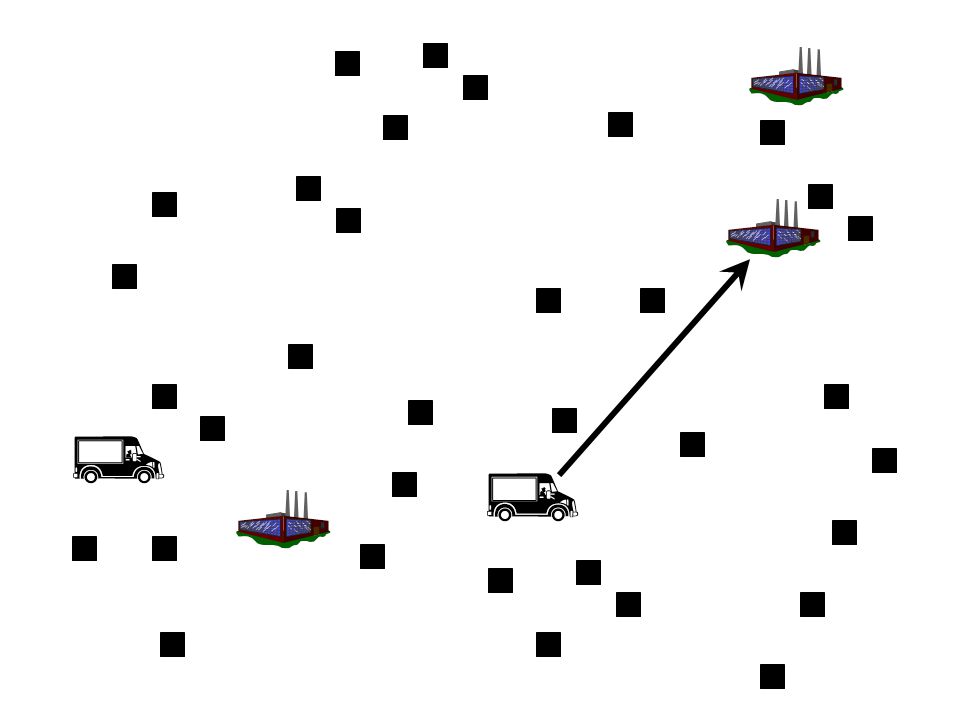
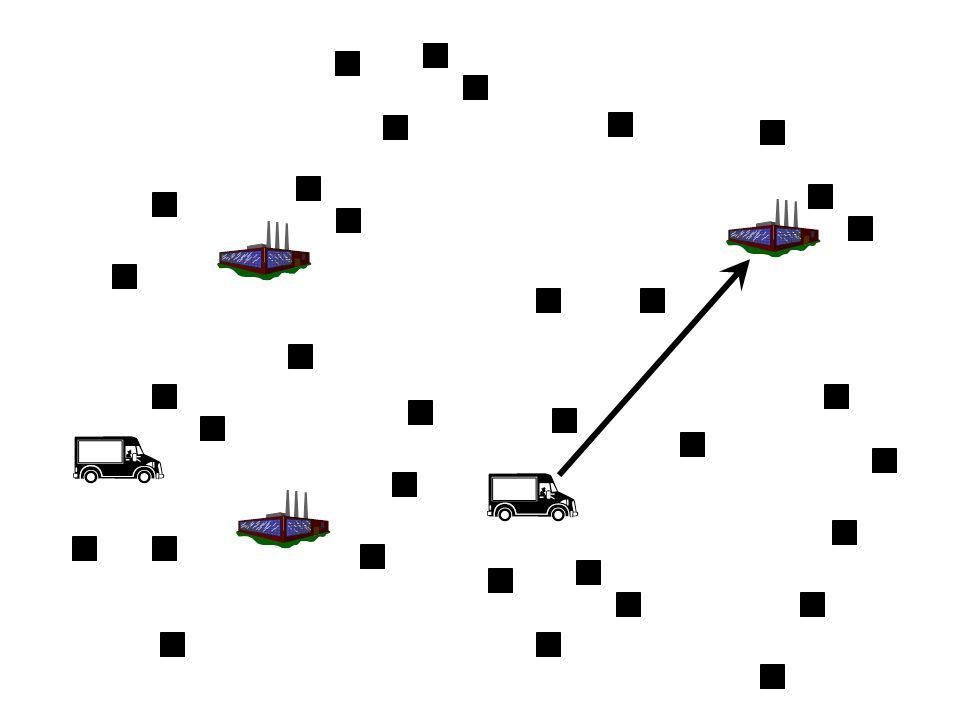
When a boxcar becomes empty, we have three options: Customers Regional depots General depots

50
Option 1: Send directly to customers

51
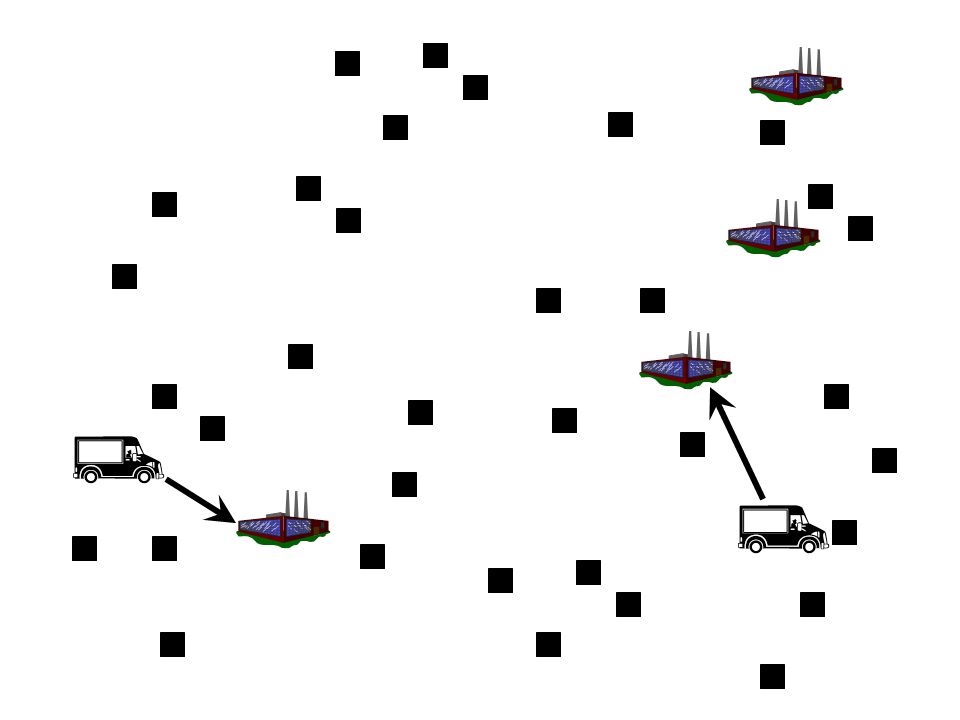
Option 2: Send to distribution areas

52
Option 1: Send directly to customers Option 2: Send to distribution areas Option 3: Send to general depots

53
© 2004 Warren B. Powell Slide 53 Forecasts of Car Demands ForecastActual

54
© 2004 Warren B. Powell Slide 54 Multiple, simple assets

55
© 2004 Warren B. Powell Slide 55 Multiple, simple assets Our basic strategy: Separable approximation 0 1 2 3 4 5

56
© 2004 Warren B. Powell Slide 56 Multiple, simple assets Two-stage resource allocation under uncertainty

57
© 2004 Warren B. Powell Slide 57 Multiple, simple assets

58
© 2004 Warren B. Powell Slide 58 Multiple, simple assets

59
© 2004 Warren B. Powell Slide 59 Multiple, simple assets

60
© 2004 Warren B. Powell Slide 60 Multiple, simple assets

61
© 2004 Warren B. Powell Slide 61 Multiple, simple assets We estimate the functions by sampling from our distributions. Marginal value:

62
© 2004 Warren B. Powell Slide 62 Two-stage problems The time t subproblem: t (i-1,t+3) (i,t+1) (i+1,t+5)
 (i,t+1) (i+1,t+5).")
63
© 2004 Warren B. Powell Slide 63 Two-stage problems Left and right gradients are found by solving flow augmenting path problems. t i (i-1,t+3) Gradients: The right derivative (the value of one more unit of that resource) is a flow augmenting path from that node to the supersink.
 Gradients: The right derivative (the value of one more unit of that resource) is a flow augmenting path from that node to the supersink..")
64
© 2004 Warren B. Powell Slide 64 Two-stage problems Left and right derivatives are used to build up a nonlinear approximation of the subproblem.

65
© 2004 Warren B. Powell Slide 65 Two-stage problems Left and right derivatives are used to build up a nonlinear approximation of the subproblem. Right derivativeLeft derivative

66
© 2004 Warren B. Powell Slide 66 Two-stage problems Each iteration adds new segments, as well as refining old ones.

67
© 2004 Warren B. Powell Slide 67 Two-stage problems Number of resources Approximate value function

68
© 2004 Warren B. Powell Slide 68 Two-stage problems It is important to maintain concavity:

69
© 2004 Warren B. Powell Slide 69 Value function A concave function… Slopes … has monotonically decreasing slopes. But updating the function with a stochastic gradient may violate this property. Two-stage problems

70
© 2004 Warren B. Powell Slide 70 A projection algorithm (SPAR)
")
71
© 2004 Warren B. Powell Slide 71 A projection algorithm (SPAR)
")
72
© 2004 Warren B. Powell Slide 72 A projection algorithm (SPAR)
")
73
© 2004 Warren B. Powell Slide 73 A projection algorithm (SPAR)
")
74
© 2004 Warren B. Powell Slide 74 A projection algorithm (SPAR)
")
75
© 2004 Warren B. Powell Slide 75 Two-stage problems Separability implies:

76
© 2004 Warren B. Powell Slide 76 Two-stage problems We only sample the points in the second stage which were optimal given the second stage approximation. A stochastic allocation problem:

77
© 2004 Warren B. Powell Slide 77 Two-stage problems

78
© 2004 Warren B. Powell Slide 78 Two-stage problems Real problems are nonseparable.

79
© 2004 Warren B. Powell Slide 79 Two-stage problems Exact solutions using Benders: “L-Shaped” decomposition (Van Slyke and Wets) Stochastic decomposition (Higle and Sen) CUPPS (Chen and Powell)
 Stochastic decomposition (Higle and Sen) CUPPS (Chen and Powell).")
80
© 2004 Warren B. Powell Slide 80 Two-stage problems Point forecast Profits Iterations

81
© 2004 Warren B. Powell Slide 81 Two-stage problems Variations on Bender’s decomposition Point forecast Profits Iterations

82
© 2004 Warren B. Powell Slide 82 Two-stage problems Variations on Bender’s decomposition SPAR algorithm Point forecast Profits Iterations

83
© 2004 Warren B. Powell Slide 83 A dynamic network: Multiple, simple assets t

84
© 2004 Warren B. Powell Slide 84 Multiple, simple assets Stepping through time:

85
© 2004 Warren B. Powell Slide 85 Multiple, simple assets Stepping through time:

86
© 2004 Warren B. Powell Slide 86

87
© 2004 Warren B. Powell Slide 87

88
© 2004 Warren B. Powell Slide 88

89
© 2004 Warren B. Powell Slide 89

90
© 2004 Warren B. Powell Slide 90 Resource State-Type Time Multistage problems

91
© 2004 Warren B. Powell Slide 91 Time Resource State-Type Multistage problems

92
© 2004 Warren B. Powell Slide 92 Time Resource State-Type Multistage problems

93
© 2004 Warren B. Powell Slide 93 Resource State-Type Time Multistage problems

94
© 2004 Warren B. Powell Slide 94 Time Resource State-Type Multistage problems

95
© 2004 Warren B. Powell Slide 95 Time Resource State-Type Multistage problems

96
© 2004 Warren B. Powell Slide 96 Backward pass

97
© 2004 Warren B. Powell Slide 97 Time Resource State-Type Backward pass

98
© 2004 Warren B. Powell Slide 98 Time Resource State-Type Backward pass

99
© 2004 Warren B. Powell Slide 99 Time Resource State-Type Backward pass

100
© 2004 Warren B. Powell Slide 100 Time Resource State-Type Backward pass

101
© 2004 Warren B. Powell Slide 101 A pure (deterministic) network: Multistage deterministic problems
 network: Multistage deterministic problems")
102
© 2004 Warren B. Powell Slide 102 The mathematical optimum Approximate dynamic programming Multistage deterministic problems

103
© 2004 Warren B. Powell Slide 103 T01 Time Evolution of Simulation TSTS 11 EE 00 EE 22 EE EE T-2 EE T-1 TT Multistage stochastic problems 33 EE Planning horizon

104
© 2004 Warren B. Powell Slide 104 Multistage stochastic problems Planning horizon Percent of posterior bound Deterministic, rolling horizon Posterior bound

105
© 2004 Warren B. Powell Slide 105 Multistage stochastic problems Planning horizon Percent of posterior bound Posterior bound Using approximate DP Deterministic, rolling horizon

106
© 2004 Warren B. Powell Slide 106 A car distribution problem For railroads, customers call in orders the week before: Requirement becomes knownRequirement becomes actionable Time

107
© 2004 Warren B. Powell Slide 107

108
© 2004 Warren B. Powell Slide 108 A car distribution problem Repositioning movements based on forecasts Assignments to booked orders. Using value function approximations, we may reposition cars before orders become known:

109
© 2004 Warren B. Powell Slide 109 A car distribution problem Profits Total revenue Empty repositioning costs Late service penalties Iterations

110
© 2004 Warren B. Powell Slide 110 A car distribution problem Empty miles as a percent of total miles History “Optimized” without adaptive learning

111
© 2004 Warren B. Powell Slide 111 A car distribution problem Empty miles as a percent of total miles History “Optimized” without adaptive learning “Optimized” with adaptive learning

112
Outline Estimating the value of a single, complex asset

113
© 2004 Warren B. Powell Slide 113 Single, complex asset A simple asset:

114
© 2004 Warren B. Powell Slide 114 Single, complex asset A complex asset:

115
© 2004 Warren B. Powell Slide 115 PA TX Single, complex asset

116
© 2004 Warren B. Powell Slide 116 Single, complex asset The attributes of a driver:

117
© 2004 Warren B. Powell Slide 117 NE region PA TX Single, complex asset

118
© 2004 Warren B. Powell Slide 118 Single, complex asset We can use a family of aggregation functions:

119
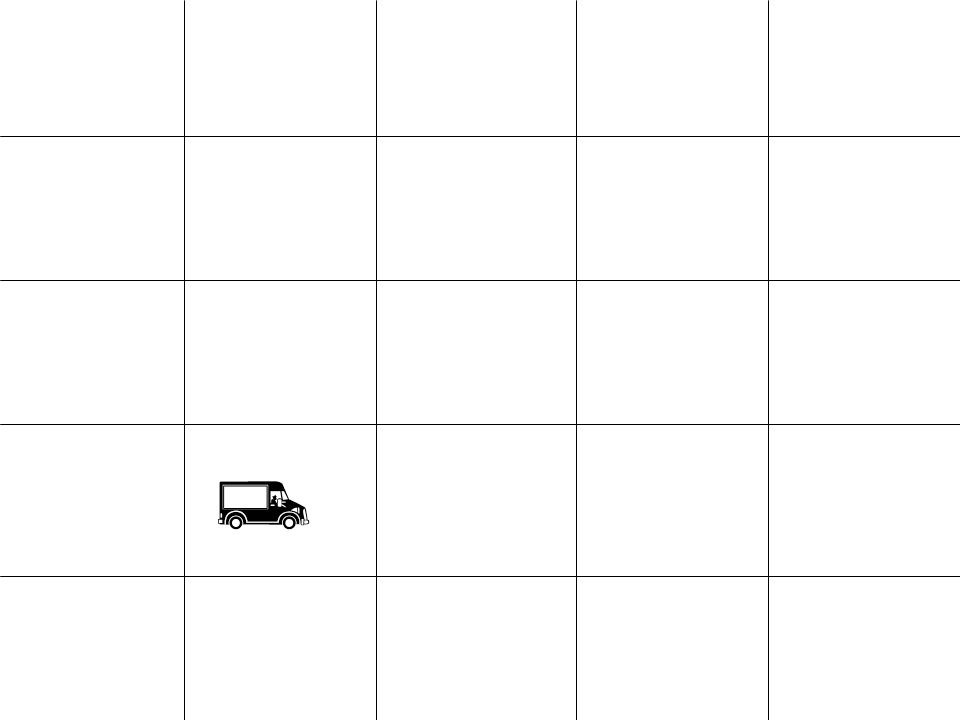
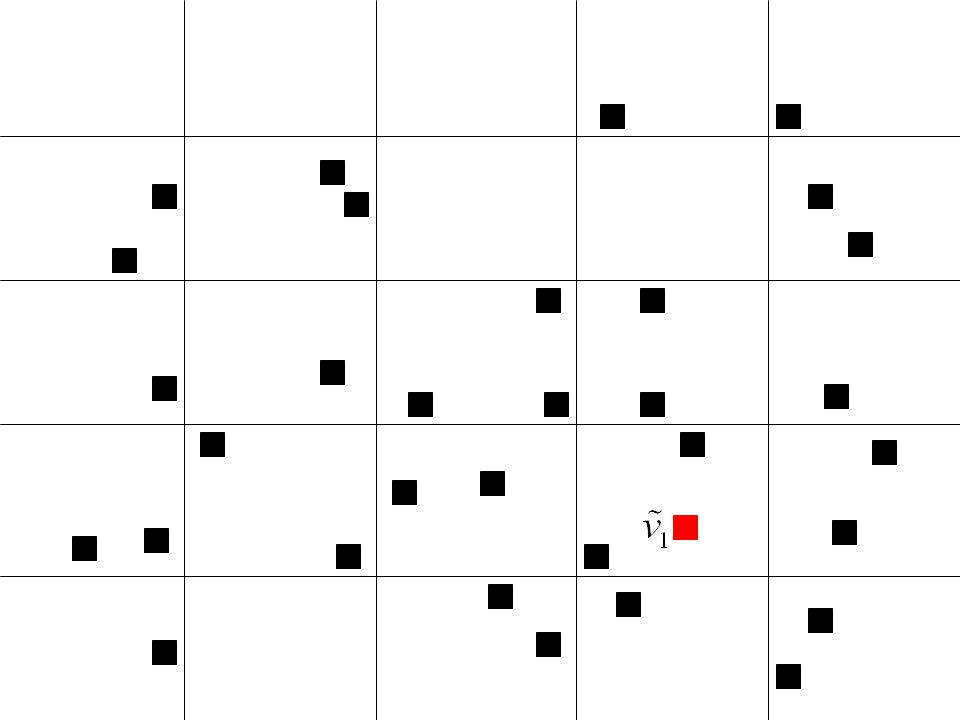
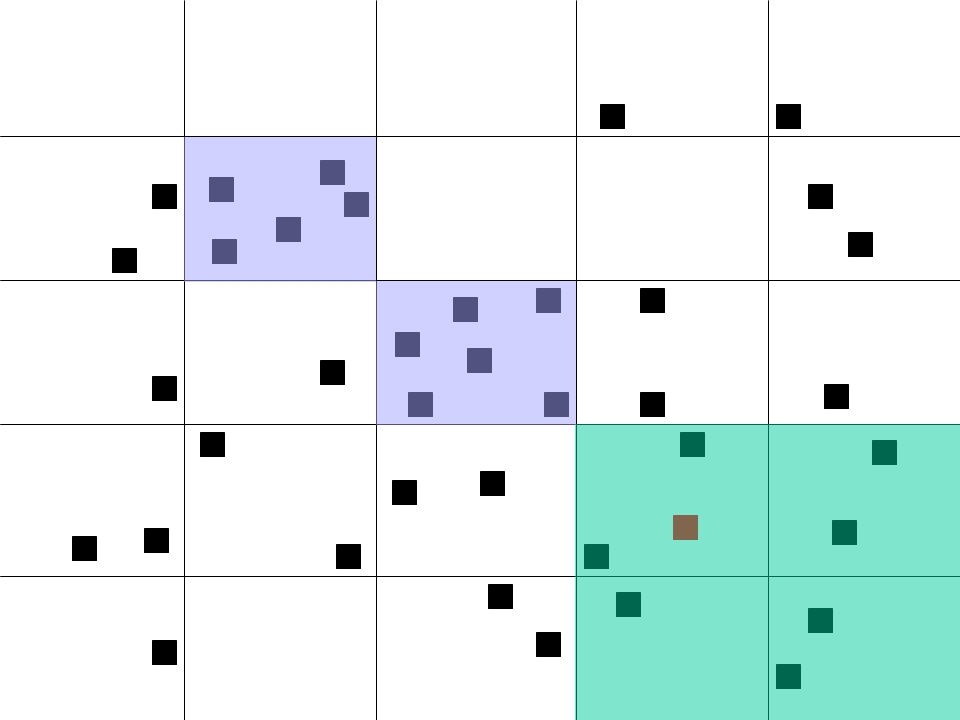
Resource attributes for which we have values New resource Time t ?

120
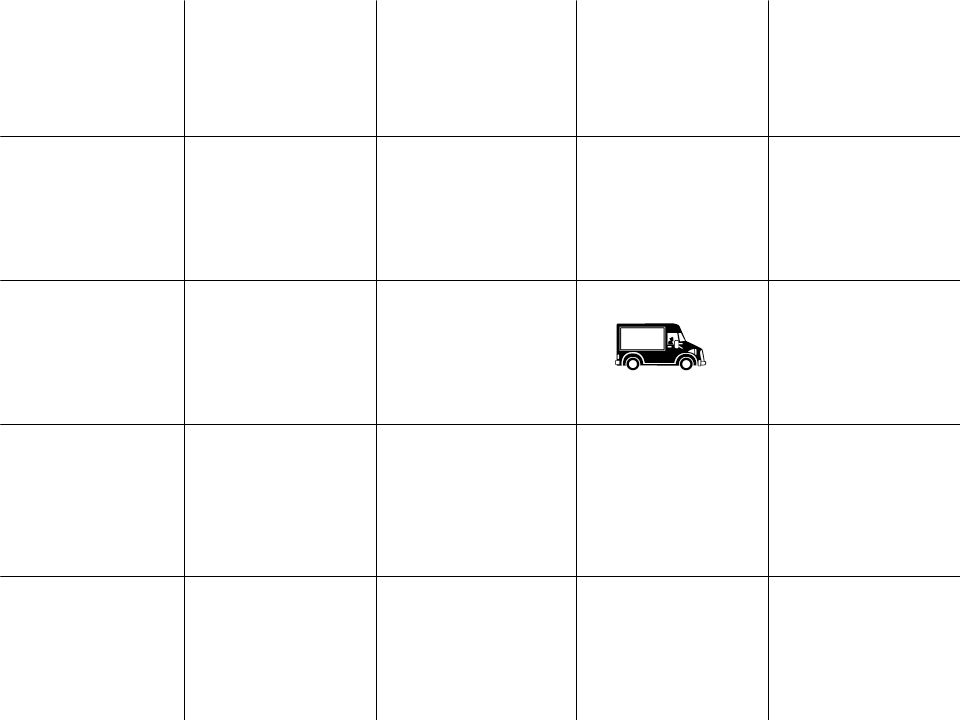
© 2004 Warren B. Powell Slide 120 An approximation strategy The value of a truck at different points in the region.

121
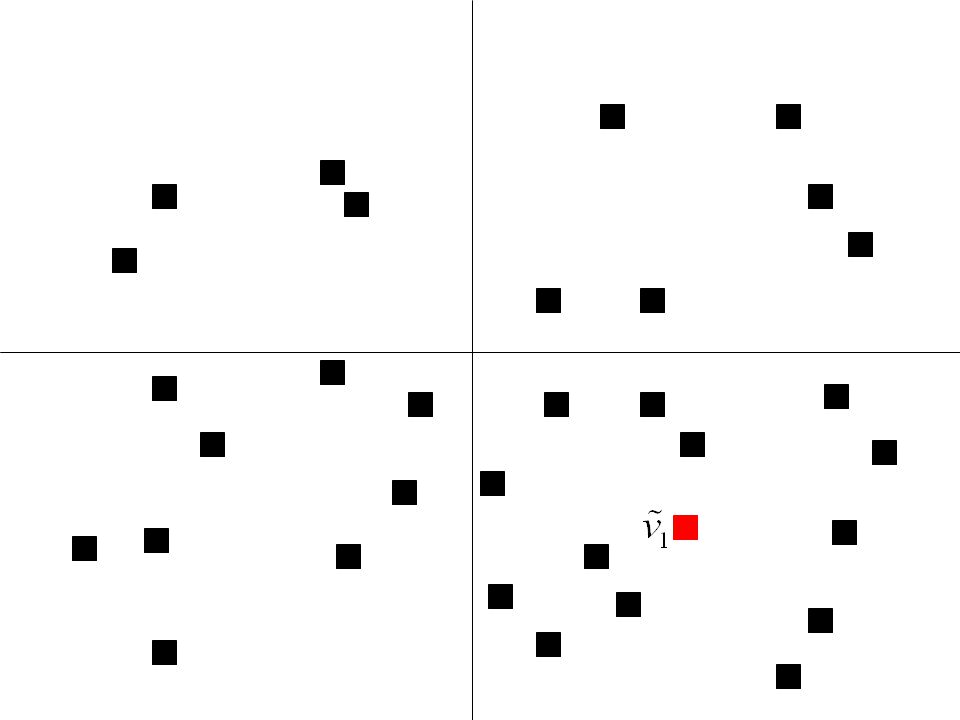
Resource attributes for which we have values New resource Time t+1

126
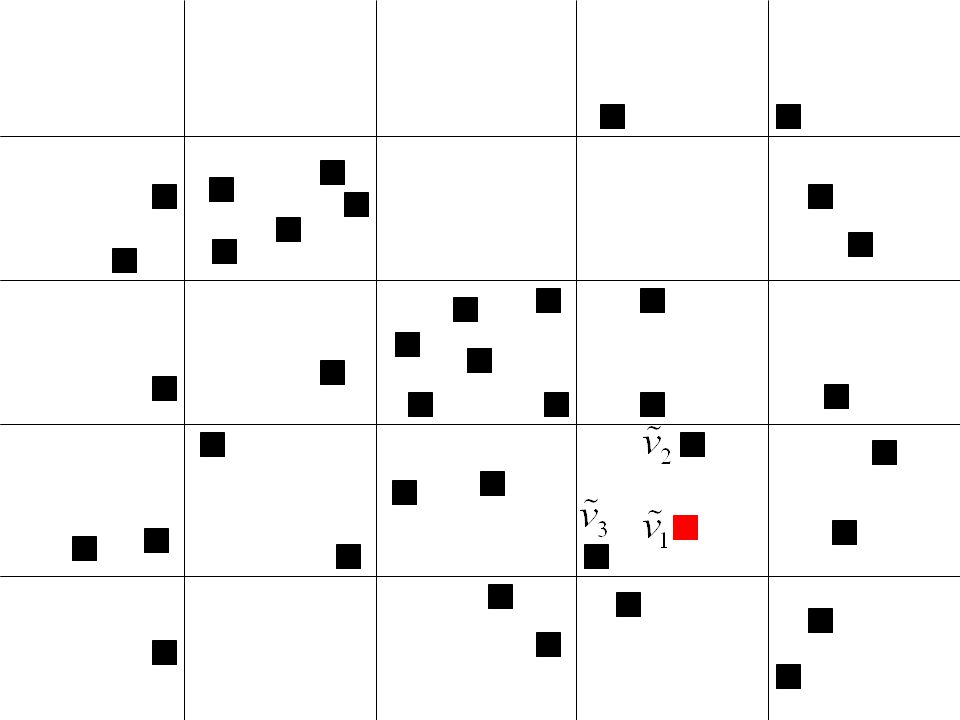
© 2004 Warren B. Powell Slide 126 An approximation strategy

127
© 2004 Warren B. Powell Slide 127 An approximation strategy

128
© 2004 Warren B. Powell Slide 128 An approximation strategy

129
© 2004 Warren B. Powell Slide 129 An approximation strategy

130
© 2004 Warren B. Powell Slide 130 An approximation strategy

134
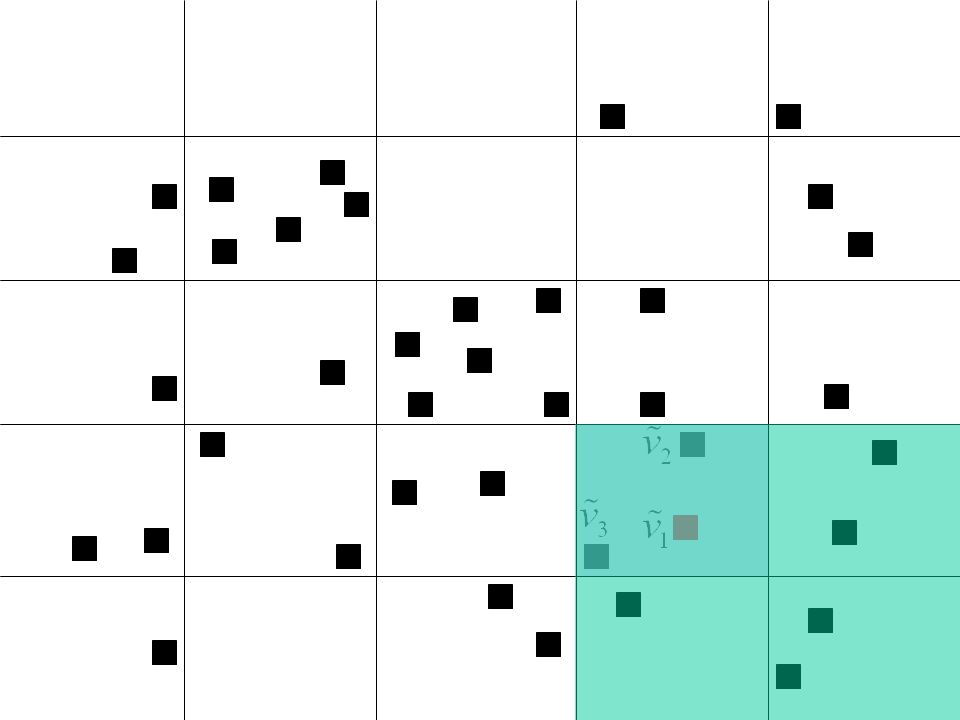
© 2004 Warren B. Powell Slide 134 An approximation strategy

135
We can use different levels of aggregation to capture the value of an asset:

136
© 2004 Warren B. Powell Slide 136 Hierarchical aggregation Alternative: »Use multiple levels of aggregation at the same time Estimate at gth level of aggregation Weight on gth level of aggregation

137
© 2004 Warren B. Powell Slide 137 x f(x) Hierarchical aggregation
 Hierarchical aggregation")
138
© 2004 Warren B. Powell Slide 138 x f(x) Hierarchical aggregation
 Hierarchical aggregation")
139
© 2004 Warren B. Powell Slide 139 x f(x) BiasNoise Hierarchical aggregation
 BiasNoise Hierarchical aggregation")
140
© 2004 Warren B. Powell Slide 140 x f(x) High bias Moderate bias Zero bias Hierarchical aggregation
 High bias Moderate bias Zero bias Hierarchical aggregation")
141
© 2004 Warren B. Powell Slide 141 Bayesian weights Optimal weights Weight on disagregate level Hierarchical weighting strategy

142
© 2004 Warren B. Powell Slide 142 Hierarchical aggregation Iterations Weights 1324513245 Aggregation level 6767 Weight on most disaggregate level Weight on most aggregate levels Optimal weights change as the algorithm progresses:

143
© 2004 Warren B. Powell Slide 143 Hierarchical aggregation Aggregate Disaggregate Weighted Combination

144
Outline Managing multiple, complex assets

145
© 2004 Warren B. Powell Slide 145 Yellow Freight System © 2002 Warren B. Powell, Princeton University

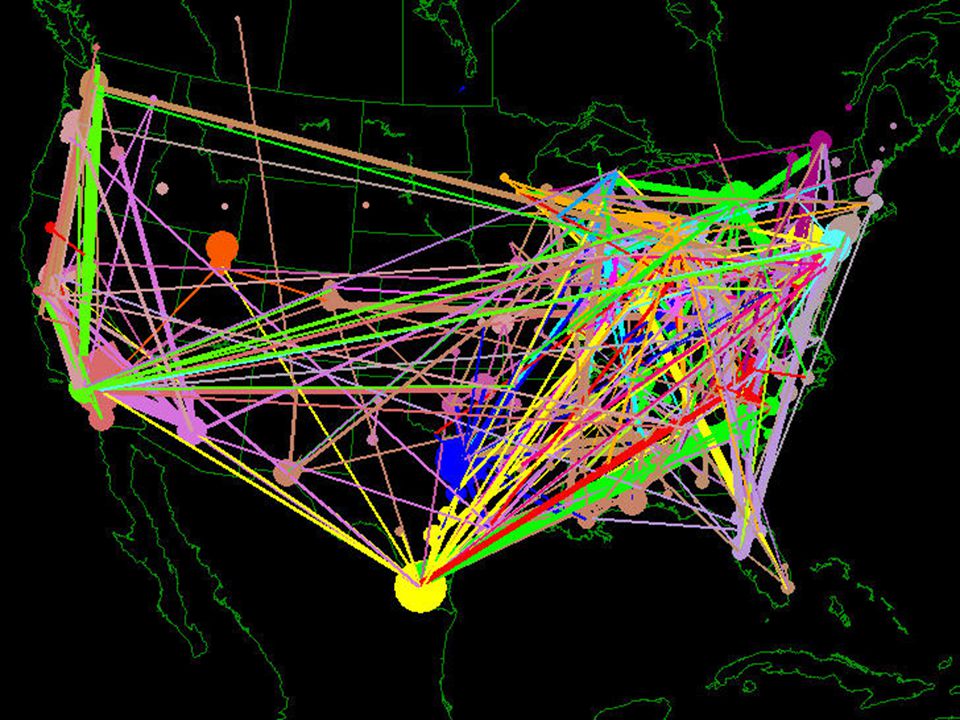
146
© 2004 Warren B. Powell Slide 146 Driver availability, colored by domicile, 24 hours from now

147
© 2004 Warren B. Powell Slide 147

148
© 2004 Warren B. Powell Slide 148

149
© 2004 Warren B. Powell Slide 149

151
© 2004 Warren B. Powell Slide 151

152
© 2004 Warren B. Powell Slide 152 Fleet management Questions: »What if we have more team drivers? »What if we hire more drivers domiciled in Texas? »What is the value of moving more freight from Chicago to Denver?

153
© 2004 Warren B. Powell Slide 153

Similar presentations


>")


