Download presentation
Presentation is loading. Please wait.

2
Rapid Pneumatic Transport of Radioactive Samples

3
Why? This system can be used to transport radioactive samples quickly and safely from an activation site to a counting station. For example: transporting neutron activated graphite discs from the reaction chamber to a counting station.

4
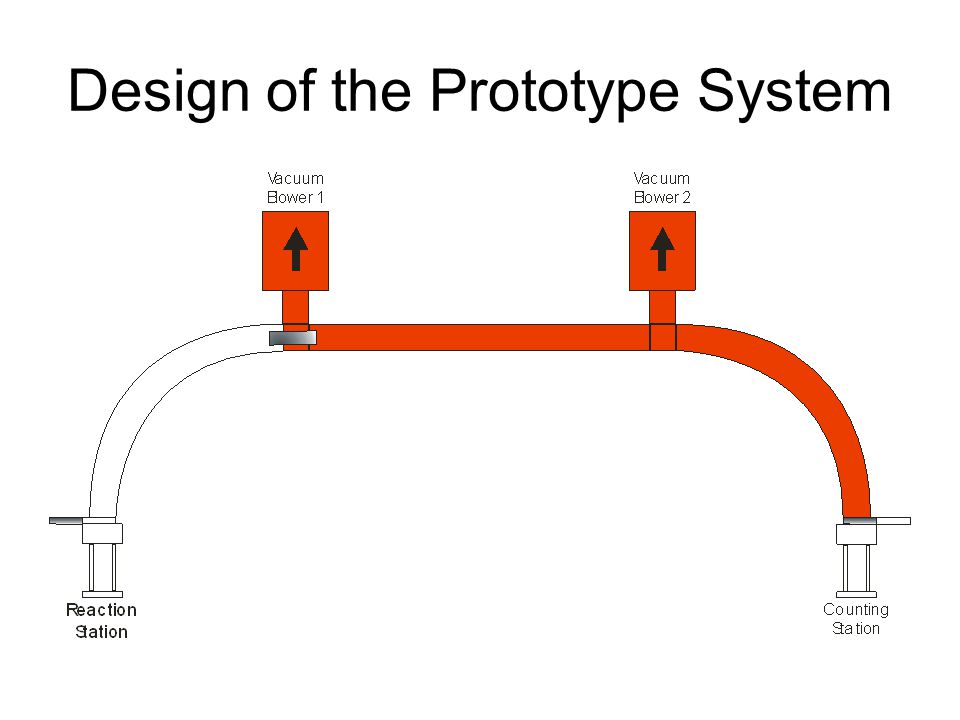
Design of the Prototype System RaPTORS version 1.0 The first design used a pull-pull vacuum system

5
Both Blowers turn on to aid in the initial lift of the carrier Design of the Prototype System

6
Carrier lifting stage Design of the Prototype System

8
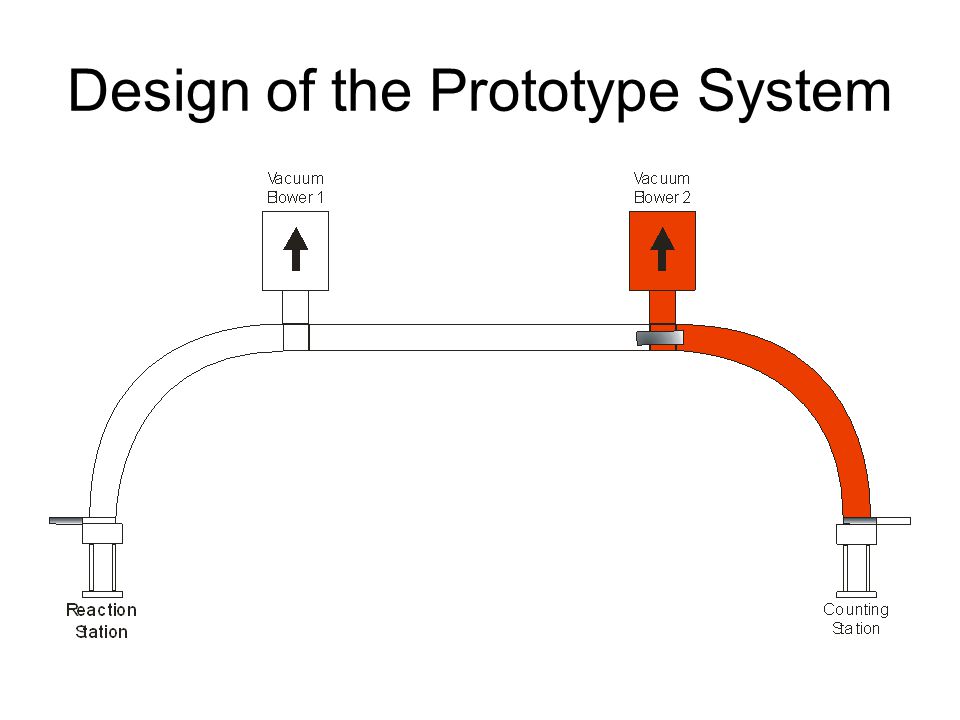
After a predetermined amount of time, the first blower turns off, allowing the second blower to pull the carrier through the rest of the system Design of the Prototype System

10
After the carrier passes the second blower there will be little to no suction on the carrier because the blower itself is open to the atmosphere Design of the Prototype System

11
As the carrier falls it is de-accelerated by compression Design of the Prototype System

12
Vacuum blower 2 turns off Design of the Prototype System

13
Valve opens, Carrier drops Design of the Prototype System

14
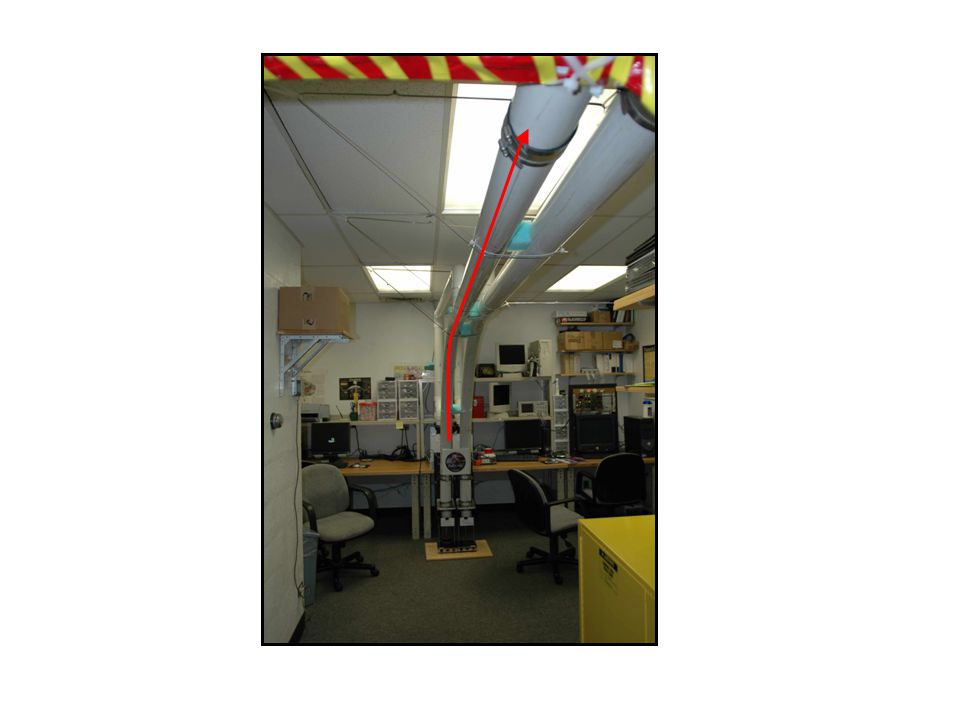
Construction of the RaPTORS Prototype System Construction during the summer of 2005

15
Construction of the RaPTORS Prototype System Construction team

16
Components 4” diameter PVC pipe 2 end stations4 vacuum-blowers Carrier

17
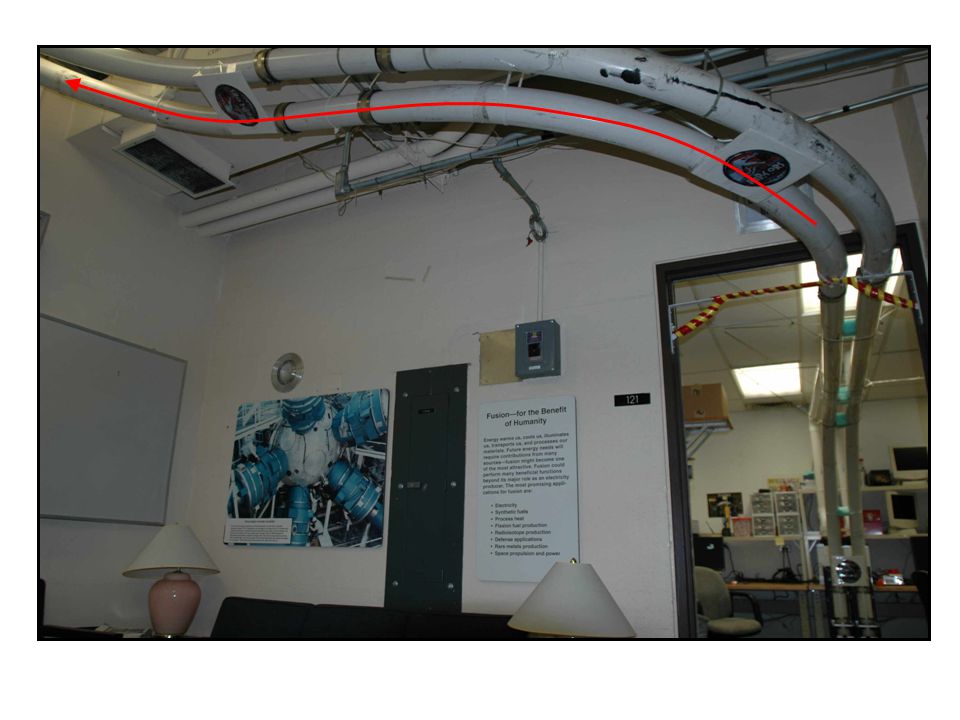
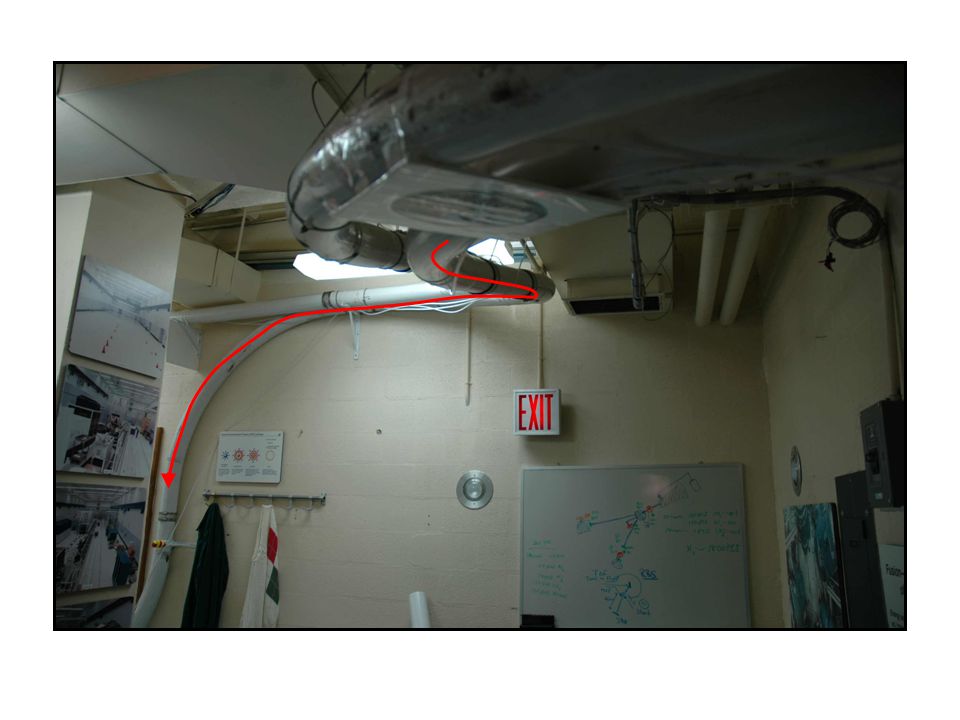
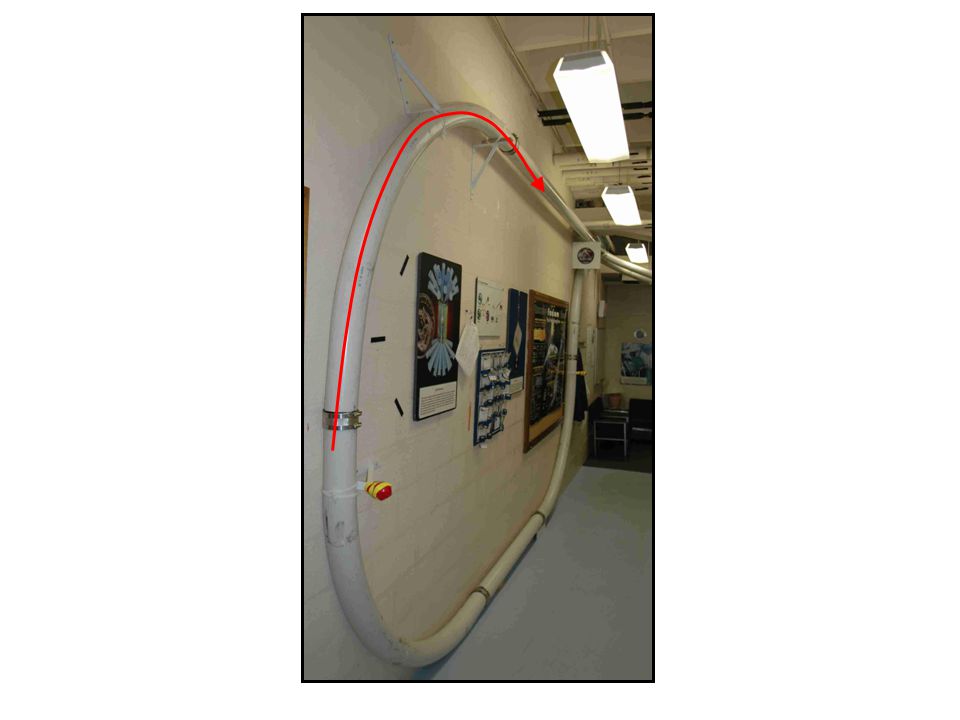
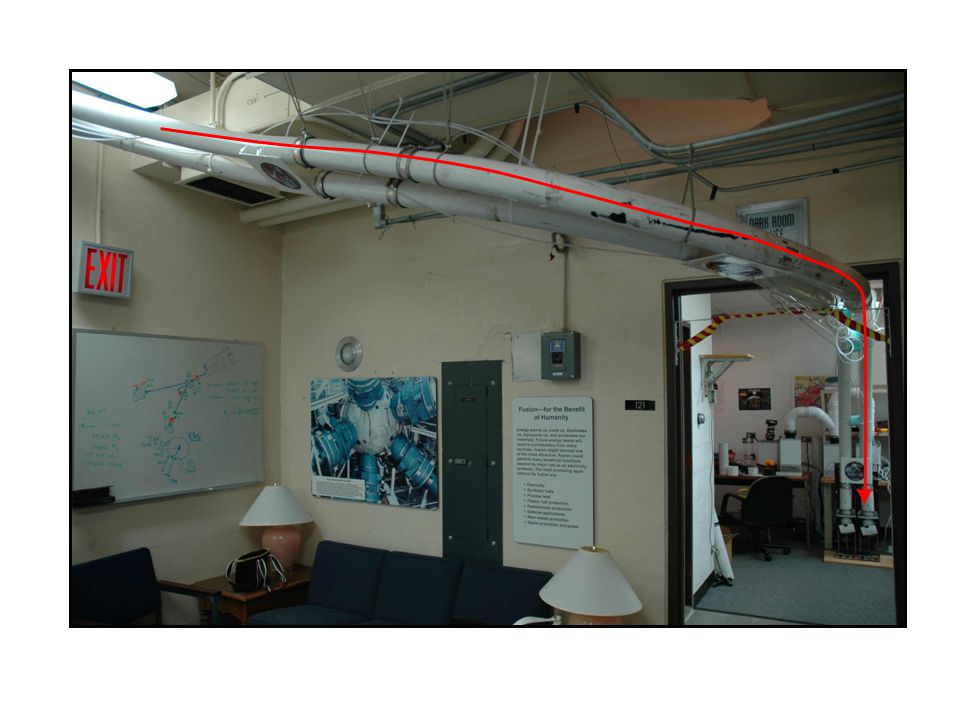
Tour Carrier starts in the activation station Vacuums turn on and carrier is propelled pneumatically into the system via 4” smooth bore PVC pipes The carrier leaves and enters the end stations

26
Reliability Tests (experiment #1)
")
27
Reliability Tests 1,100 trials in both directions ~114 ft (34.7 m) end station to end station Ten 90º turns 4 out of plane turns 250,800 feet ~ 47.5 miles were covered in tests
 end station to end station Ten 90º turns 4 out of plane turns 250,800 feet ~ 47.5 miles were covered in tests")
28
C→R = traveling from the counting station to the reaction chamber R→C = traveling from the reaction chamber to the counting station

29
System Speed Test (experiment #2) Average Speeds of System
 Average Speeds of System")
30
Ventilation At the NIF the nitrogen in the air will be activated It will be necessary to isolate the air in the system near the reaction chamber from the air in the counting station This will include venting the air inside the carrier as well Venting the carrier will be accomplished by blowing air through holes that have been placed in a standard carrier

31
Sealed vs. Vented Carrier Sealed carrier Vented Carrier with 18 holes

32
VELoCIRaPTORS 2.0 Sealed vs. Vented Carrier VELoCIRaPTORS will be the RaPTORS system with a special venting station included To prepare for VELoCIRaPTORS, various speed tests were designed to compare the speed of a sealed carrier to a vented carrier. These measurements were used to determine the degree of drag on the vented carrier. Several carrier ventilation configurations were used in these tests. VELoCI=Venting and Exhausting of Low Contaminant Internal Gasses

33
Variables to be Tested Number of holes in carrier Number of vacuum-blowers connected to system Average Speed Through System The first benchmark was to measure the time it took for a carrier to move through the whole system An average speed of travel for the entire system was derived from these times

34
Results C→R represents counting station to reaction chamber R→C represents reaction chamber to counting station

35
Results C→R represents counting station to reaction chamber R→C represents reaction chamber to counting station

36
Pressure Tests (experiment #3) Pressures in System
 Pressures in System")
37
Pressure Tests It was hypothesized that there would be a measurable pressure change as the carrier passed a gas pressure sensor while traveling through the system. If true, this would present a way to determine the position of the carrier in the system if it were to become jammed.

38
Sensor Points 1 2 3

39
Pressure Tests Plastic tube flush to the inside of the pipe Plastic tube connected to Gas Pressure Sensor Computer Johnson strip connected to ADC Program run in LabView

40
Pressure Tests Noise reduction was achieved when the sensors were placed close to the computer. This minimized the signal cable length from the sensor amplifier to the ADC. Placement of the amplifier required the use of 50 feet of polyethylene tubing.

41
Pressure Tests The following graphs were created by averaging each data point with the 5 closest points to it and then plotting the ratio of the average from one sensor to the corresponding average of one of the other sensors.

42
Each peak represents when the carrier passed by one of the sensors creating a measurable difference between the pressure at the sensor that was passed and the other sensors. Results

43
It is supposed that as the carrier travels up this vertical section of pipe, it is slowed by gravity enough that a pressure build-up occurs, which in turn draws it up the pipe, resulting in measurable changes in pressure between the sensors. When the carrier is traveling in the opposite direction, down this section of pipe, it falls freely and no measurable pressure differences arise.

44
Conclusions of Pressure Tests The carrier is believed to move through most of RaPTORS by flow, as if dropped into a river, and not by pressure changes. Tracking the pressure throughout the system would not be helpful in determining where the carrier was between the end stations.

45
Local Speed Tests (experiment #4) Point to Point Speeds
 Point to Point Speeds")
46
Further speed tests were designed to measure the speed of a carrier as it passed through certain characteristic sections of the system (e.g. 90° turns, straight aways, etc.) Photogates were used to accumulate this information. Speed Tests
 Photogates were used to accumulate this information. Speed Tests.")
47
Sensor A Sensor B Sensor C Oscilloscope A B C D Light Sensors in photo resistor circuits Circuit board LED light received by sensor until carrier passes

48
Results

50
Blower-vacuum configuration

51
Results Maximum speed achieved = 12.3 m/s ~ 28 mph Blower-vacuum configuration

52
Conclusions from Speed Tests From the speed tests preformed, it has been decided that putting a vented carrier through the system results in negligible speed loss A venting station has been designed to be used mid-journey to remove the air from the system The removal of the air will protect the lab technician operating the counting station

53
Venting Station Gate Valve

54
Components of the Station The central piece will be a 4-way pvc-pipe junction Gate valves will be used to block off sections of the pipe in order to both direct the carrier as well as air flow The carrier will compress the air in a long section of pipe that will act as a braking system for the carrier

55
VElociRaPTORS version 2.1

56
2 Vacuum Blowers for initial lift

57
VElociRaPTORS version 2.1 Carrier lift phase

58
VElociRaPTORS version 2.1

59
Blower 1 turns off

60
VElociRaPTORS version 2.1 Carrier Triggers Photogate

61
VElociRaPTORS version 2.1 Blower 3 turns off Carrier is slowed by compression

62
VElociRaPTORS version 2.1 Gate Valves reposition

63
VElociRaPTORS version 2.1 Blower 3 pulls carrier back to venting position

64
VElociRaPTORS version 2.1

65
Blowers 3 and 4 vent carrier

66
VElociRaPTORS version 2.1

67
Gates reposition again

68
VElociRaPTORS version 2.1 Blowers 2 and 4 pull and push respectively

69
VElociRaPTORS version 2.1

70
Carrier is slowed by compression

71
VElociRaPTORS version 2.1

72
Gate valve opens to allow carrier to fall

73
RaPTORS version 2.0 The new system will allow venting of air inside the carrier as well as inside the pipe A push-pull method will be implemented to increase performance RaPTORS will provide a swift, safe method for transporting radioactive samples

Similar presentations


>")


. 2.1 Displacement and Velocity Distance is a measure of the total motion of an object (how far it has traveled)>")


. Carbon sensor is activated by neutrons;>")


