Download presentation
Presentation is loading. Please wait.

2
Cosmology After WMAP David Spergel Cambridge December 17, 2007

3
NASA/GSFC Chuck Bennett (PI) -> JHU Michael Greason Bob Hill Gary Hinshaw Al Kogut Michele Limon Nils Odegard Janet Weiland Ed Wollack Princeton Chris Barnes Norm Jarosik Eiichiro Komatsu Michael Nolta UBC Mark Halpern Chicago Stephan Meyer Brown Greg Tucker UCLA Ned Wright Science Team: Wilkinson Microwave Anisotropy Probe A partnership between NASA/GSFC and Princeton Lyman Page Hiranya Peiris Rachel Bean David Spergel Olivier Dore Licia Verde Jo Dunkley
 -> JHU Michael Greason Bob Hill Gary Hinshaw Al Kogut Michele Limon Nils Odegard Janet Weiland Ed Wollack Princeton Chris Barnes Norm Jarosik Eiichiro Komatsu Michael Nolta UBC Mark Halpern Chicago Stephan Meyer Brown Greg Tucker UCLA Ned Wright Science Team: Wilkinson Microwave Anisotropy Probe A partnership between NASA/GSFC and Princeton Lyman Page Hiranya Peiris Rachel Bean David Spergel Olivier Dore Licia Verde Jo Dunkley")
4
K - 22GHz

5
Ka - 33GHz

6
Q - 41GHz

7
V - 61GHz

8
W - 94GHz

9
Q band V band W band

11
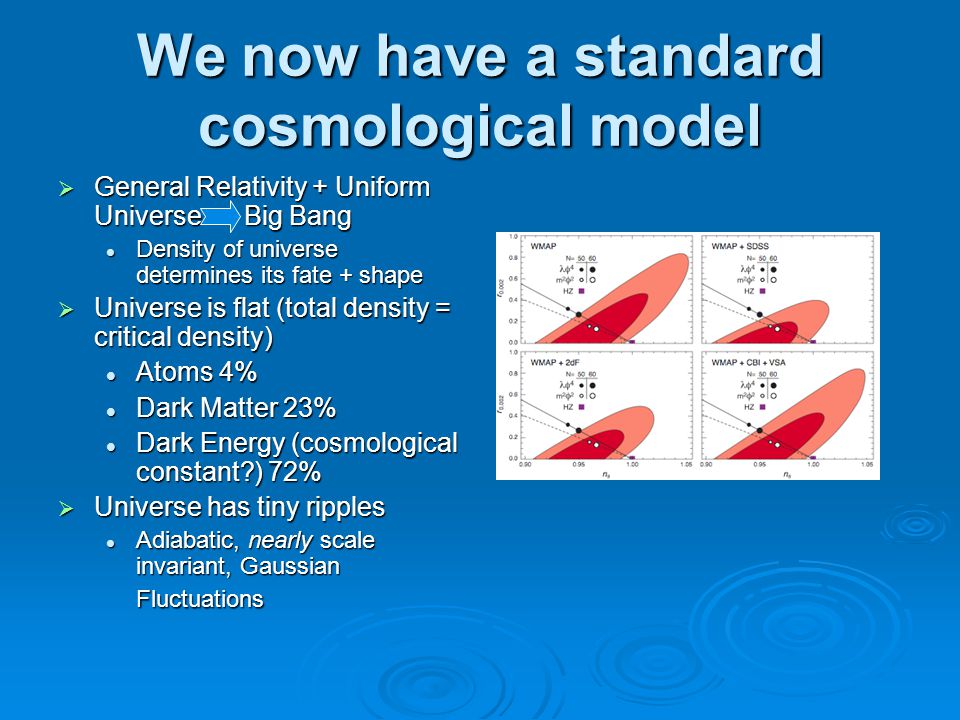
We now have a standard cosmological model General Relativity + Uniform Universe Big Bang Density of universe determines its fate + shape Density of universe determines its fate + shape Universe is flat (total density = critical density) Atoms 4% Atoms 4% Dark Matter 23% Dark Matter 23% Dark Energy (cosmological constant?) 72% Dark Energy (cosmological constant?) 72% Universe has tiny ripples Adiabatic, nearly scale invariant, Gaussian Fluctuations Adiabatic, nearly scale invariant, Gaussian Fluctuations
 Atoms 4% Atoms 4% Dark Matter 23% Dark Matter 23% Dark Energy (cosmological constant ) 72% Dark Energy (cosmological constant ) 72% Universe has tiny ripples Adiabatic, nearly scale invariant, Gaussian Fluctuations Adiabatic, nearly scale invariant, Gaussian Fluctuations")
14
Polarization measurements

15
Consistent Cosmology Large-scale structure Cluster counts Weak Lensing Strong Lensing Stellar Ages Big Bang Nuclesynthesis (Li?) Hubble Constant Velocity Fields Small-scale CMB Oguri et al. 2007 Kuo et al. 2007

17
SDSS and Baryon Wiggles Purely geometric test (SDSS + WMAP) Eisenstein et al. (2005)
 Eisenstein et al. (2005)")
18
Atacama Cosmology Telescope Operational! Scanning 200 square degrees/night Nearly 1000 working detectors, each with sensitivity greater than WMAP Currently at 145 GHz 3 frequencies in March 2008

19
Simulations of mm-wave data. Survey area High quality area 150 GHz SZ SimulationMBAC on ACT 1.7’ beam 2X noise PLANCK MAP PLANCK

20
ACT Observing Program Cover ~1000-2000 square degrees Overlap areas with significant amount of astronomical data (SDSS Stripe 82, DLS and CFHT deep fields) Cross-correlate lensing of CMB and galaxies Cross-correlate lensing of CMB and galaxies Kinetic SZ Kinetic SZ Thermal SZ Thermal SZ Understand sources Understand sources
 Cross-correlate lensing of CMB and galaxies Cross-correlate lensing of CMB and galaxies Kinetic SZ Kinetic SZ Thermal SZ Thermal SZ Understand sources Understand sources")
21
Hunting for Non- Gaussianities Axis of Evil (Land and Maguiejo) Cold Spot (Cruz et al.) Too few cold and hot spots (Larson and Wandelt) Vorticity and Shear Features in the power spectrum Bianchi VIIh models Alignment of quadrupole and octopole
 Cold Spot (Cruz et al.) Too few cold and hot spots (Larson and Wandelt) Vorticity and Shear Features in the power spectrum Bianchi VIIh models Alignment of quadrupole and octopole")
22
Fluctuations Appear to be Gaussian

23
FOREGROUND CORRECTED MAP

24
Non-Gaussianity Caveat Emptor Check for foregrounds Foregrounds dominate the full sky maps (and the ILC map in the plane is not intended for scientific analyses) Foregrounds dominate the full sky maps (and the ILC map in the plane is not intended for scientific analyses) Foregrounds are highly non-Gaussian and low level foregrounds can contaminate statistics Foregrounds are highly non-Gaussian and low level foregrounds can contaminate statistics Check statistical significance Number of tests and free parameters Number of tests and free parameters Monte-Carlo Simulations Monte-Carlo Simulations Check noise statistics
 Foregrounds dominate the full sky maps (and the ILC map in the plane is not intended for scientific analyses) Foregrounds are highly non-Gaussian and low level foregrounds can contaminate statistics Foregrounds are highly non-Gaussian and low level foregrounds can contaminate statistics Check statistical significance Number of tests and free parameters Number of tests and free parameters Monte-Carlo Simulations Monte-Carlo Simulations Check noise statistics")
25
CMB Foregrounds are significant at all frequencies Synchrotron Thermal Dust Free-Free Emission Point Sources Spinning Dust Foregrounds are dominant for polarization maps

26
Dust everywhere….

27
Primordial Skewness Komatsu and Spergel 2001 Sym terms Bispectrum changes sign as a function of l!

28
f NL in WMAP Data? Foreground contamination is very worrying! Need null tests! Detector noise Detector noise Foregrounds Foregrounds A 2 I dust ? AB I dust ?… A 2 I dust ? AB I dust ?…

29
f NL in WMAP Data? Statistical significance overestimated (choose highest amplitude cut and frequency combination) Most of the signal is coming from triangles that don’t have most of the S/N! Most of the signal is coming from triangles that don’t have most of the S/N! S/N goes up as errors goes up! Adding very noisy data increases the signal S/N goes up as errors goes up! Adding very noisy data increases the signal Minimum variance 2/3 of data 62% of data
 Most of the signal is coming from triangles that don’t have most of the S/N. Most of the signal is coming from triangles that don’t have most of the S/N. S/N goes up as errors goes up. Adding very noisy data increases the signal S/N goes up as errors goes up. Adding very noisy data increases the signal Minimum variance 2/3 of data 62% of data.")
30
f NL Conclusions Physically reasonable Yadav, Komatsu et al. estimator improves sensitivity Yadav and Wandelt claim overestimates statistical significance, however, does show intriguing hint (perhaps of foreground contamination) Predictions of bispectrum and trispectrum are interesting Can be distinguished from other forms of non- Gaussianity
 Predictions of bispectrum and trispectrum are interesting Can be distinguished from other forms of non- Gaussianity.")
31
Cosmology Now Has A Standard Model Basic parameters are accurately determined Many can be measured using multiple techniques Many can be measured using multiple techniques CMB best fit now consistent with other measurements CMB best fit now consistent with other measurements Mysteries remain: dark matter, dark energy, physics of inflation Next step: Probe Physics Beyond the Standard Model

32
THANK YOU !

Similar presentations


>")


, J. Richard Gott.>")


 Timeline June 30, 2001: launched aboard a Delta II-7425-10 launch vehicle October 1, 2001: arrival at L2 April.>")


