Download presentation
Presentation is loading. Please wait.

1
Biology-based approaches for mixture ecotoxicology Tjalling Jager

2
Contents 14:00-18:00 (coffee at 16:00) Lecture limitations of descriptive approaches framework for a process-based approach Dynamic Energy Budget (DEB) theory sub-lethal effects simplified survival modelling in more detail Practical exercise Play with a “toy model” in Excel (survival only) 18:00-18:30 Open discussion
 Lecture limitations of descriptive approaches framework for a process-based approach Dynamic Energy Budget (DEB) theory sub-lethal effects simplified survival modelling in more detail Practical exercise Play with a toy model in Excel (survival only) 18:00-18:30 Open discussion")
3
Disclaimer! Process-Based Model Process-Based Model your mixture data full data interpretation X

4
Interest in mixtures Scientific why are effects of mixtures the way they are? Practical how can we predict the environmental impact of mixtures?

5
Practical challenge Some 100,000 man-made chemicals Large range of natural toxicants For animals alone, >1 million species described Complex exposure situations

6
Typical approach AB

9
wait for 21 days …

10
Dose-response plot dose-ratio dependent deviation from CA concentration A concentration B total offspring

11
What question did we answer? “What is effect of constant exposure to this mixture on total Daphnia reproduction after 21 days under standard OECD test conditions?”

12
What question did we answer? “What is effect of constant exposure to this mixture on total Daphnia reproduction after 21 days under standard OECD test conditions?”

13
What question did we answer? “What is effect of constant exposure to this mixture on total Daphnia reproduction after 21 days under standard OECD test conditions?”

14
What question did we answer? “What is effect of constant exposure to this mixture on total Daphnia reproduction after 21 days under standard OECD test conditions?”

15
What question did we answer? “What is effect of constant exposure to this mixture on total Daphnia reproduction after 21 days under standard OECD test conditions?”

16
What question did we answer? “What is effect of constant exposure to this mixture on total Daphnia reproduction after 21 days under standard OECD test conditions?”

17
What question did we answer? “What is effect of constant exposure to this mixture on total Daphnia reproduction after 21 days under standard OECD test conditions?”

18
What question did we answer? “What is effect of constant exposure to this mixture on total Daphnia reproduction after 21 days under standard OECD test conditions?”

19
What question did we answer? “What is effect of constant exposure to this mixture on total Daphnia reproduction after 21 days under standard OECD test conditions?” Relevance for science?

20
What question did we answer? “What is effect of constant exposure to this mixture on Daphnia reproduction after 21 days under standard OECD test conditions?” Relevance for science?

21
What question did we answer? “What is effect of constant exposure to this mixture on total Daphnia reproduction after 21 days under standard OECD test conditions?” Relevance for risk assessment?

22
Better questions do we see: time patterns of effects on different endpoints …

23
0.5 1 1.5 2 2.5 05101520 0 survival body length cumul. reproduction carbendazim Alda Álvarez et al. (2006) time (days) 0246810121416 0 20 40 60 80 100 120 140 pentachlorobenzene time (days) EC10 in time
 time (days) pentachlorobenzene time (days) EC10 in time.")
24
Cd and Zn in springtails Van Gestel & Hensbergen (1997) 0 1 2 3 4 5 0123456 time (weeks) TU mixture 50% effect, internal concentration TU = 1 Reproduction Dry weight
 time (weeks) TU mixture 50% effect, internal concentration TU = 1 Reproduction Dry weight")
25
Better questions do we see: time patterns of effects on different endpoints … interactions between compounds and with environment … differences between species and between compounds … can we make useful predictions for risky situations?

26
external concentration B (in time) external concentration A (in time) effects in time Process-based causility Assumption: internal concentration is linked to the effect
 external concentration A (in time) effects in time Process-based causility Assumption: internal concentration is linked to the effect")
27
external concentration B (in time) external concentration A (in time) toxico- kinetics toxico- kinetics toxico- kinetics toxico- kinetics Process-based internal concentration A in time internal concentration B in time “toxicodynamic animal model” “toxicodynamic animal model” effects in time Assumption: internal concentration is linked to the effect
 external concentration A (in time) toxico- kinetics toxico- kinetics toxico- kinetics toxico- kinetics Process-based internal concentration A in time internal concentration B in time toxicodynamic animal model toxicodynamic animal model effects in time Assumption: internal concentration is linked to the effect")
28
Demands on toxicokinetics model Complexity should match the level of detail in data simplest: scaled one-compartment model one parameter (elimination rate) estimated from effects data only most complex: PBPK model … requires detailed measurements … toxico- kinetics toxico- kinetics
 estimated from effects data only most complex: PBPK model … requires detailed measurements … toxico- kinetics toxico- kinetics")
29
Demands on animal model Explain endpoints of interest over entire life cycle growth, start of reproduction, reproduction rate, survival, … Explain effects of toxicants on these endpoints Allow to interpret effects of multiple stressors combination of chemicals chemicals and non-chemical stressors As little chemical- and species-specific as possible comparison and extrapolation All organisms obey conservation of mass and energy! “toxicodynamic animal model” “toxicodynamic animal model”

30
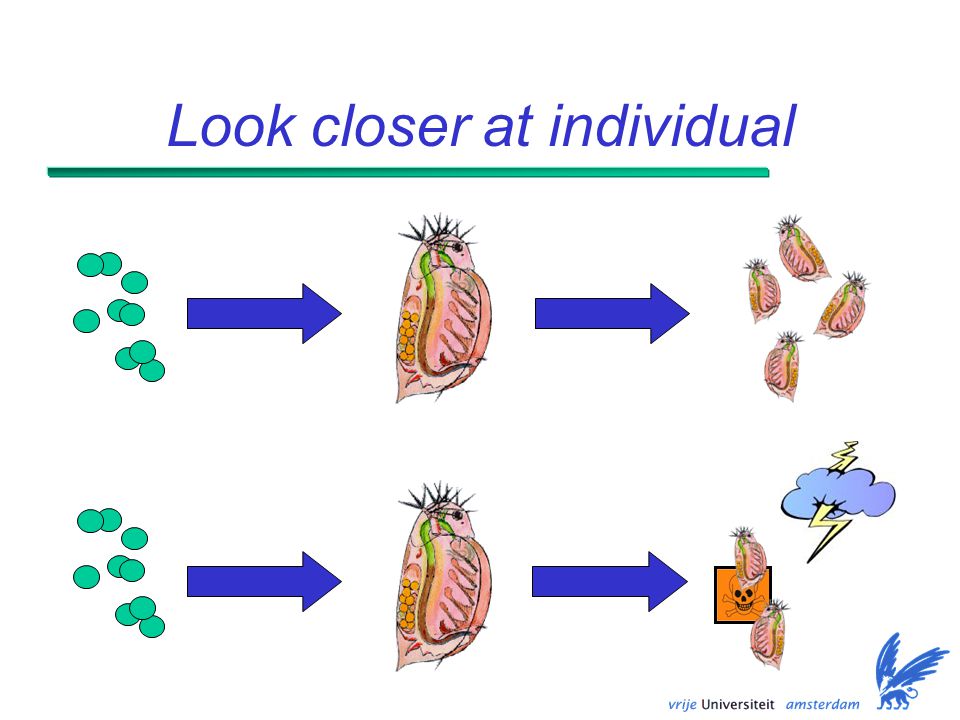
Look closer at individual

35
Natural role for energetics Understanding toxic effects on growth and reproduction requires understanding how food is acquired and used to produce traits Rules for metabolic organisation Start of Dynamic Energy Budget (DEB) theory 30 years ago
 theory 30 years ago")
36
What is DEB? Quantitative theory for metabolic organisation; ‘first principles’ time, energy and mass balance Life-cycle of the individual links levels of organisation: molecule ecosystems Fundamental; many practical applications (bio)production, (eco)toxicity, climate change, evolution … Kooijman (2000) Kooijman (2010)
production, (eco)toxicity, climate change, evolution … Kooijman (2000) Kooijman (2010).")
37
mobilisation Standard DEB animal structure somatic maintenance growth maturity maintenance 1- reproduction maturity eggs maturation p foodfeces assimilation reserve b

38
Kooijman (2000)
")
39
mobilisation Standard DEB animal foodfeces assimilation structure somatic maintenance growth maturity maintenance 1- reproduction maturity eggs maturation b p reserve

40
“toxicodynamic animal model” “toxicodynamic animal model” Toxicant effects in DEB external concentration (in time) toxico- kinetics toxico- kinetics internal concentration in time DEB parameters in time DEB model DEB model Kooijman & Bedaux (1996), Jager et al. (2006, 2010) repro growth survival feeding hatching … over entire life cycle assimilation maintenanc e maturation ….
 repro growth survival feeding hatching … over entire life cycle assimilation maintenanc e maturation …..")
41
Toxicant effects in DEB external concentration (in time) toxico- kinetics toxico- kinetics internal concentration in time DEB parameters in time DEB model DEB model Affected DEB parameter has specific consequences for life cycle repro growth survival feeding hatching …
 toxico- kinetics toxico- kinetics internal concentration in time DEB parameters in time DEB model DEB model Affected DEB parameter has specific consequences for life cycle repro growth survival feeding hatching …")
42
Ex.1: maintenance costs time cumulative offspring time body length TPT Jager et al. (2004)
")
43
Ex.2: growth costs time body length time cumulative offspring Pentachlorobenzene Alda Álvarez et al. (2006)
.")
44
Ex.3: egg costs time cumulative offspring time body length Chlorpyrifos Jager et al. (2007)
")
45
Mixture analysis external concentration A (in time) toxico- kinetics toxico- kinetics internal concentration A in time external concentration B (in time) toxico- kinetics toxico- kinetics internal concentration B in time DEB parameters in time DEB model DEB model effects on all endpoints in time theory implies interactions …
 toxico- kinetics toxico- kinetics internal concentration A in time external concentration B (in time) toxico- kinetics toxico- kinetics internal concentration B in time DEB parameters in time DEB model DEB model effects on all endpoints in time theory implies interactions …")
46
Mixture analysis external concentration A (in time) external concentration B (in time) toxico- kinetics toxico- kinetics toxico- kinetics toxico- kinetics internal concentration A in time internal concentration B in time DEB parameters in time DEB model DEB model effects on all endpoints in time theory implies interactions …
 external concentration B (in time) toxico- kinetics toxico- kinetics toxico- kinetics toxico- kinetics internal concentration A in time internal concentration B in time DEB parameters in time DEB model DEB model effects on all endpoints in time theory implies interactions …")
47
Mixture analysis external concentration A (in time) external concentration B (in time) toxico- kinetics toxico- kinetics toxico- kinetics toxico- kinetics internal concentration A in time internal concentration B in time DEB parameters in time DEB model DEB model effects on all endpoints in time theory implies interactions … growth
 external concentration B (in time) toxico- kinetics toxico- kinetics toxico- kinetics toxico- kinetics internal concentration A in time internal concentration B in time DEB parameters in time DEB model DEB model effects on all endpoints in time theory implies interactions … growth")
48
external concentration A (in time) toxico- kinetics toxico- kinetics external concentration B (in time) toxico- kinetics toxico- kinetics DEB model DEB model internal concentration A in time DEB parameters in time internal concentration B in time effects on all endpoints in time Mixture analysis
 toxico- kinetics toxico- kinetics external concentration B (in time) toxico- kinetics toxico- kinetics DEB model DEB model internal concentration A in time DEB parameters in time internal concentration B in time effects on all endpoints in time Mixture analysis")
49
Simple mixture rules compound‘target’ toxicity parameters linked (compare CA) maintenance costs ingestion rate growth costs DEB parameter …
 maintenance costs ingestion rate growth costs DEB parameter …")
50
Simple mixture rules compound‘target’ maintenance costs ingestion rate growth costs DEB parameter …

51
Simple mixture rules compound‘target’ toxicity parameters independent (compare IA) maintenance costs ingestion rate growth costs DEB parameter …
 maintenance costs ingestion rate growth costs DEB parameter …")
52
Mixture rules ‘same target’ and ‘different target’ are concepually similar to CA and IA, but: CA and IA are prescriptions for combining dose- response curves (at a single time point) here, applied at target level, yielding mixture effects on all endpoints over entire life cycle they yield deviations from standard CA and IA (apparent interactions)
 here, applied at target level, yielding mixture effects on all endpoints over entire life cycle they yield deviations from standard CA and IA (apparent interactions)")
53
Mixture effects: simulations parameters for Daphnia ‘same target’ model (ingestion) plots for 21-days exposure
 plots for 21-days exposure")
54
Contours at t=21 days 5 20 30 50 5 20 30 50 compound B sizereproduction compound A

55
50% contours in time t = 5 t = 10 t = 15 t = 21 compound A t = 5 t = 10 t = 15 t = 21 compound A compound B t = 5 t = 10 t = 15 t = 21 compound A t = 5 t = 10 t = 15 t = 21 compound A compound B sizereproduction

56
Mixture effects: simulations parameters for Daphnia ‘other target’ model (ingestion+maint.) plots for 21-days exposure
 plots for 21-days exposure")
57
sizereproduction 5 5 20 30 50 5 5 20 30 50 compound B Contours at t=21 days

58
50% contours in time t = 5 t = 10 t = 15 t = 21 compound A compound B t = 5 t = 10 t = 15 t = 21 compound A sizereproduction

59
fluoranthene pyrene PAHs in Daphnia Based on standard 21-day OECD test 10 animals per treatment length, reproduction and survival every 2 days no body residues (TK inferred from effects) Jager et al. (2010)
.")
60
costs reproduction (and costs growth) costs reproduction (and costs growth) same target
 costs reproduction (and costs growth) same target")
61
Iso-effect lines for body length <50% effect

62
Conclusions PAH mixture Mixture effect consistent with ‘same target’ as expected for these PAHs explains all three endpoints, over time Iso-effect lines are functions of time which differ between endpoints in this case: little deviation from CA Few parameters for all data in time 14 parameters (+4 Daphnia defaults) (descriptive would require >100 parameters)
 (descriptive would require >100 parameters)")
63
Disclaimer! Process-Based Model Process-Based Model your mixture data full data interpretation X

64
fit not satisfactory? fit Strategy for data analysis actual DEB model experimental data additional experiments literature educated guesses mechanistic hypothesis standard DEB model other interactions?

65
Parameter estimates external concentration A (in time) external concentration B (in time) toxico- kinetics toxico- kinetics toxico- kinetics toxico- kinetics internal concentration A in time internal concentration B in time DEB parameters in time DEB model DEB model effects on all endpoints in time TK parstox parsDEB pars
 external concentration B (in time) toxico- kinetics toxico- kinetics toxico- kinetics toxico- kinetics internal concentration A in time internal concentration B in time DEB parameters in time DEB model DEB model effects on all endpoints in time TK parstox parsDEB pars")
66
Educated extrapolation external concentration A (in time) external concentration B (in time) toxico- kinetics toxico- kinetics toxico- kinetics toxico- kinetics internal concentration A in time internal concentration B in time DEB parameters in time DEB model DEB model effects on all endpoints in time TK parstox parsDEB pars populations
 external concentration B (in time) toxico- kinetics toxico- kinetics toxico- kinetics toxico- kinetics internal concentration A in time internal concentration B in time DEB parameters in time DEB model DEB model effects on all endpoints in time TK parstox parsDEB pars populations")
67
Educated extrapolation external concentration A (in time) external concentration B (in time) toxico- kinetics toxico- kinetics toxico- kinetics toxico- kinetics internal concentration A in time internal concentration B in time DEB parameters in time DEB model DEB model effects on all endpoints in time TK parstox parsDEB pars other endpoints other, e.g., feeding respiration
 external concentration B (in time) toxico- kinetics toxico- kinetics toxico- kinetics toxico- kinetics internal concentration A in time internal concentration B in time DEB parameters in time DEB model DEB model effects on all endpoints in time TK parstox parsDEB pars other endpoints other, e.g., feeding respiration")
68
Educated extrapolation external concentration A (in time) external concentration B (in time) toxico- kinetics toxico- kinetics toxico- kinetics toxico- kinetics internal concentration A in time internal concentration B in time DEB parameters in time DEB model DEB model effects on all endpoints in time TK parstox parsDEB pars time-varying concentrations
 external concentration B (in time) toxico- kinetics toxico- kinetics toxico- kinetics toxico- kinetics internal concentration A in time internal concentration B in time DEB parameters in time DEB model DEB model effects on all endpoints in time TK parstox parsDEB pars time-varying concentrations")
69
Educated extrapolation external concentration A (in time) external concentration B (in time) toxico- kinetics toxico- kinetics toxico- kinetics toxico- kinetics internal concentration A in time internal concentration B in time DEB parameters in time DEB model DEB model effects on all endpoints in time TK parstox parsDEB pars food limitation
 external concentration B (in time) toxico- kinetics toxico- kinetics toxico- kinetics toxico- kinetics internal concentration A in time internal concentration B in time DEB parameters in time DEB model DEB model effects on all endpoints in time TK parstox parsDEB pars food limitation")
70
Educated extrapolation external concentration A (in time) external concentration B (in time) toxico- kinetics toxico- kinetics toxico- kinetics toxico- kinetics internal concentration A in time internal concentration B in time DEB parameters in time DEB model DEB model effects on all endpoints in time TK parstox parsDEB pars related compounds
 external concentration B (in time) toxico- kinetics toxico- kinetics toxico- kinetics toxico- kinetics internal concentration A in time internal concentration B in time DEB parameters in time DEB model DEB model effects on all endpoints in time TK parstox parsDEB pars related compounds")
71
Educated extrapolation external concentration A (in time) external concentration B (in time) toxico- kinetics toxico- kinetics toxico- kinetics toxico- kinetics internal concentration A in time internal concentration B in time DEB parameters in time DEB model DEB model effects on all endpoints in time TK parstox parsDEB pars other (related) species
 external concentration B (in time) toxico- kinetics toxico- kinetics toxico- kinetics toxico- kinetics internal concentration A in time internal concentration B in time DEB parameters in time DEB model DEB model effects on all endpoints in time TK parstox parsDEB pars other (related) species")
72
Final words A process-based approach is essential … to progress the science of mixture toxicity to make useful predictions for RA Key elements DEB approach one framework for all endpoints over time not specific for particular species or compounds certain interactions are unavoidable … Of course, more work is needed … validate predicted interactions and extrapolations find out if we can explain other interactions

73
Limitations A DEB-based analysis cannot be done routinely! almost every dataset requires additional hypotheses … DEB offers a framework, not a “foolproof software” Data requirements are not trivial basic life history information of the species body size and repro over a considerable part of the life cycle preferably survival, feeding rates, egg size, hatching time … For mixtures, experimental effort may rapidly become excessive

74
There is help … DEB pars depart from defaults (e.g., ‘add_my_pet’ or standard animal with ‘zoom factor’) hopefully vary little between experiments TK pars depart from QSARs … extrapolate between species or toxicants tox pars at this moment, little help … extrapolate between species or toxicants?
 hopefully vary little between experiments TK pars depart from QSARs … extrapolate between species or toxicants tox pars at this moment, little help … extrapolate between species or toxicants")
75
species specific DEB model Outlook target sitetoxicant effect on life cycle ? number of chemicals and species is very large … but number of target sites and processes is limited! Once we know the normal biological processes, all external stressors are merely perturbations of these processes (Yang et al., 2004) DEB parameters DEB theorybiochemistry
 DEB parameters DEB theorybiochemistry.")
76
In more detail: survival

77
Introduction For survival, DEB can be simplified in most acute tests, animals are not growing survival can be treated (largely) independent from metabolic organisation Simple mixture version in Excel only survival only datasets from Baas et al., 2007 no interactions
 independent from metabolic organisation Simple mixture version in Excel only survival only datasets from Baas et al., 2007 no interactions")
78
external concentration B (in time) external concentration A (in time) toxico- kinetics toxico- kinetics toxico- kinetics toxico- kinetics Process-based internal concentration A in time internal concentration B in time survival as a chance process survival as a chance process survival in time Tolerance distribution McCarty et al (1992) Lee & Landrum (2006) Stochastic death Ashauer et al. (2007) Baas et al. (2007, 2009) Tolerance distribution McCarty et al (1992) Lee & Landrum (2006) Stochastic death Ashauer et al. (2007) Baas et al. (2007, 2009)
 Baas et al. (2007, 2009) Tolerance distribution McCarty et al (1992) Lee & Landrum (2006) Stochastic death Ashauer et al. (2007) Baas et al. (2007, 2009).")
79
Mortality assumption thresholds See Newman and McClosky (2000) t x t+Δt p 1-p Tolerance distribution Stochastic death
 t x t+Δt p 1-p Tolerance distribution Stochastic death")
80
survival in time survival as a chance process Model Chain external concentration (in time) toxico- kinetics toxico- kinetics internal concentration in time Simple models information content of standard tests is low
 toxico- kinetics toxico- kinetics internal concentration in time Simple models information content of standard tests is low")
81
survival in time survival as a chance process Model Chain external concentration (in time) toxico- kinetics toxico- kinetics internal concentration in time 1-comp. uptakeelimination scaled concentration external internal time

82
survival in time survival as a chance process Model Chain external concentration (in time) toxico- kinetics internal concentration in time Assumptions: death is a chance event for the individual the probability to die depends on the internal concentration.
 toxico- kinetics internal concentration in time Assumptions: death is a chance event for the individual the probability to die depends on the internal concentration.")
83
Hazard modelling 0 2 4 6 8 10 12 02468 time (days) surviving chickens 0 cars/hr 10 cars/hr 20 cars/hr 50 cars/hr Hazard rate times Δt is the probability to get hit by a car in that interval
 surviving chickens 0 cars/hr 10 cars/hr 20 cars/hr 50 cars/hr Hazard rate times Δt is the probability to get hit by a car in that interval")
84
survival in time survival as a chance process Model Chain external concentration (in time) toxico- kinetics internal concentration in time internal concentration hazard rate NEC blank value killing rate
 toxico- kinetics internal concentration in time internal concentration hazard rate NEC blank value killing rate")
85
survival in time survival as a chance process Model Chain external concentration (in time) toxico- kinetics internal concentration in time Straightforward statistics … integrate hazard rate over time and take exponential …
 toxico- kinetics internal concentration in time Straightforward statistics … integrate hazard rate over time and take exponential …")
86
Hazard modelling time hazard rate time scaled internal concentration NEC time survival probability external concentration elimination rate NEC / killing rateintegrate

87
Minnow, hexachloroethane 01.331.843.325.819.25 020 2420 4 4820 150 7220 1920120 9620 1920100 concentration (μmol/L) time (hour) fathead minnow
 time (hour) fathead minnow")
88
Survival in time 020406080100 0 0.2 0.4 0.6 0.8 1 time (hours) fraction surviving 0 1.33 1.84 3.32 5.81 9.25 conc. μmol/L elimination rate0.141 hr -1 NEC 5.54 (5.26-5.68) μmol/L killing rate 0.0408 L/μmol/hr blank hazard0.000124 hr -1
 μmol/L killing rate L/μmol/hr blank hazard hr -1.")
89
Simple mixture rules hazard rate compound‘target’ toxicity parameters independent (compare IA) 2 elimination rates 2 NECs 2 killing rates hazard rates added 2 elimination rates 2 NECs 2 killing rates hazard rates added
 2 elimination rates 2 NECs 2 killing rates hazard rates added 2 elimination rates 2 NECs 2 killing rates hazard rates added")
90
Simple mixture rules hazard rate compound‘target’ toxicity parameters linked (compare CA) 2 elimination rates 1 NEC 1 killing rate 1 “weight factor” weighted scaled int. conc. added 2 elimination rates 1 NEC 1 killing rate 1 “weight factor” weighted scaled int. conc. added Consequence: NEC and killing rate are not independent

91
Parameter relationships Jager & Kooijman (2009)
")
92
Visual representation For binary mixture, model represents surface that changes in time … Baas et al. (2007)
.")
93
Data needs Several observations in time standard acute test protocols prescribe daily scoring Note: body residues are not needed, but can be used exposure need not be constant test setup may be non-standard when animals grow, DEB will be needed … Improvements more observations in time is always better optimal test design depends on chemical and species/size

94
An Excel exercise Disclaimer: Excel is not really suited (unless you have an ODE solver) you can only use the data from Baas et al., 2007 I only use a part of the data set (you select which part) I did not include interactions at this moment, there is no user-friendly software there is user-unfriendly software though … if you have a nice data set, contact me for collaboration!
 you can only use the data from Baas et al., 2007 I only use a part of the data set (you select which part) I did not include interactions at this moment, there is no user-friendly software there is user-unfriendly software though … if you have a nice data set, contact me for collaboration!")
95
Take home message Realise that … mixture effects change with exposure time life-history traits are not independent descriptive approaches will never explain why

96
Advertisement Vacancies PhD student in Rennes (France), Marie Curie training network (CREAM) Courses International DEB Tele Course 2011 Symposia 2nd International DEB Symposium 2011 in Lisbon More information: http://www.bio.vu.nl/thb
, Marie Curie training network (CREAM) Courses International DEB Tele Course 2011 Symposia 2nd International DEB Symposium 2011 in Lisbon More information:")
Similar presentations


 stress in DEB 2: toxicokinetics Tjalling Jager Dept. Theoretical Biology TexPoint fonts used in EMF. Read the TexPoint manual before.>")


 S. Augustine B.Gagnaire C. Adam-Guillermin.>")
 theory by Elke, Svenja and Ben.>")
 stress in DEB 1: Introduction Tjalling Jager Dept. Theoretical Biology.>")

>")


. What is cancer? Failure of the mechanisms that control growth and proliferation of the cells Uncontrolled (often rapid) growth.>")
 stress in DEB 3: the ‘target site’ and effects on survival Tjalling Jager Dept. Theoretical Biology TexPoint fonts used in EMF. Read.>")

