Download presentation
Presentation is loading. Please wait.

2
(c) Allen C. Goodman, 2006 Poverty O’S Chapter 14
 Allen C. Goodman, 2006 Poverty O’S Chapter 14")
3
Is poverty urban? In US we define a poor household as one whose total income is less than the amount required to satisfy “minimum needs.”

4
Poverty in the United States Source: http://www.census.gov/prod/2003pubs/p60-222.pdfhttp://www.census.gov/prod/2003pubs/p60-222.pdf

5
Poverty Population -- Location Not exclusively urban More in Central City than elsewhere 2001 below poverty level2002 below poverty levelChange in poverty (2002 less 2001) Characteristic Number90% CIPct.90% CINumber90% CIPct.90% CINumber90% CIPct.90% CI Inside metropolitan areas 25,44657511.10.327,09659111.60.3*1,649612*0.50.3 Inside Central Cities 13,39442716.50.513,78443316.70.53904510.20.5 Outside central cities 12,0524068.20.313,3114268.90.3*1,259436*0.70.3 Outside metropolitan areas 7,46039414.20.87,47439514.20.814415-0.8
 Characteristic Number90% CIPct.90% CINumber90% CIPct.90% CINumber90% CIPct.90% CI Inside metropolitan areas 25, , *1,649612* Inside Central Cities 13, , Outside central cities 12, , *1,259436* Outside metropolitan areas 7, ,")
6
Poverty by Race

7
At the beginning, took food budgets and multiplied by 3

9
Reasons for Poverty Unemployment -- Large proportion of poor households lack full-time workers. Low wages -- If one is working at minimum wage, it doesn’t provide enough income to lift households out of poverty.

10
Poverty and Urban Areas We are seeing that segregation occurs. With jobs moving into the suburbs, we may see a “spatial mismatch” between people and jobs. This is related to segregation. Why? Long commutes which are costly and reduce net wage. Long commutes which may lead to unemployment. Poor information about potential jobs.

11
Why segregation? Voluntary? –Evidence suggest most Blacks would prefer to live in integrated neighborhoods Lower incomes –Some explanatory power. Some studies suggest that if Black incomes were higher there would be less segregation, although it would not be eliminated.

12
Why segregation? Racial prejudice –Studies show that Whites prefer at least 80/20 –Blacks prefer 50/50. Agent discrimination –Roychoudhury and Goodman found this to be the case with housing audit data for Detroit. Discuss. Exclusionary zoning –Discriminates against Blacks.

13
Impacts of Segregation Cutler and Glaeser find: –All else equal, young black adults are worse off in more segregated cities Earn less income Have lower HS graduation rates Are more likely to become single mothers. Elas of outcome to 1% ↑ in segregation

14
Why? Fewer role models? Is it the case that the lack of contacts with positive role models much worse outcomes. Suggests for Detroit that if D = 60 rather than 80, this implies a -0.29 * (28.6%↓ in segregation) = 8.3% decrease in single motherhood. Do we believe this?
 = 8.3% decrease in single motherhood. Do we believe this .")
15
Back to spatial mismatch Is it race or space? –Ellwood felt that spatial factors were overrated since Black youths didn’t work in their own neighborhoods anyway, so the location of jobs was relatively unimportant. –Ihlandfeldt found: Inferior access to employment opportunities explains between 24 and 27% of gap between Black and White employment rates. Spatial mismatch is more important in big metro areas.

16
Education and Poverty How do firms hire workers. They demand labor. They stop if MRP equals the wage rate. Discuss Labor wage rate Demand=MRP labor L*

17
Education and Poverty More education -> greater MRP. More likely to get hired at a higher wage. Labo r wage rate Demand=MRP labor L*

19
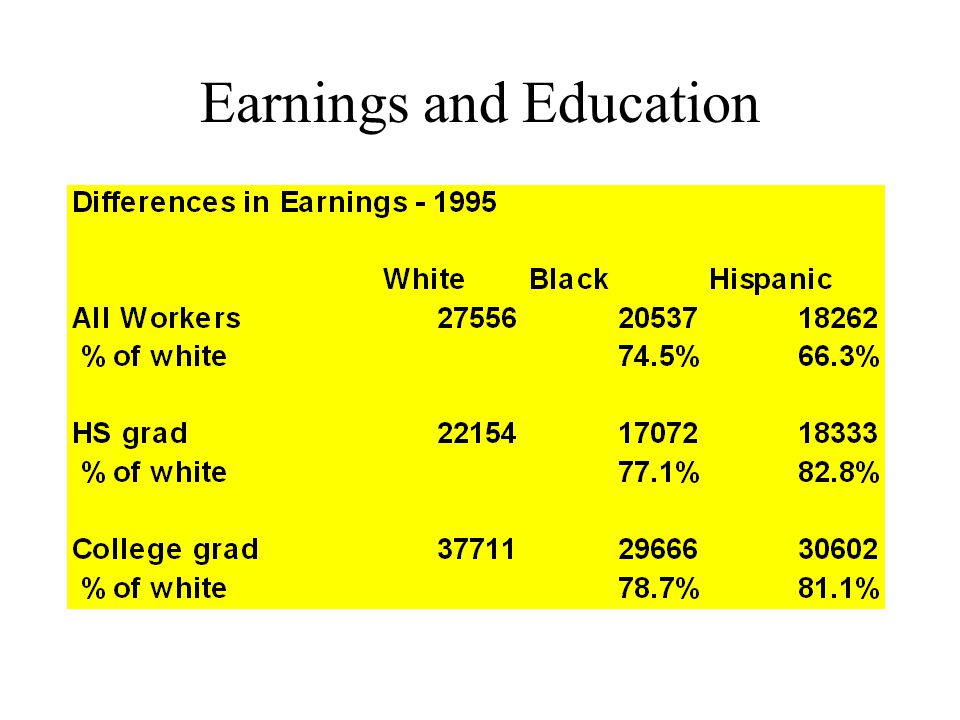
Earnings and Education

20
Race and Earnings About 3/4 of gap between White and Black earnings can be explained by differences in: –education –age –skills –location. Rest (12 – 25%) may be related to discrimination.
 may be related to discrimination..")
21
Discrimination Prejudiced firm doesn’t like to hire Blacks. Sees it as a lower MRP. Pays more to White workers Foregoes profit. Labor wage rate Demand=MRP labor L* L** Prejudiced Demand Foregone

22
Statistical Discrimination Suppose that an employer has to choose between a White or a Black applicant. Wants to hire worker with higher VMP. Believes that, on average, due to education and work experience, W is more productive than B. “Better” choice is W, based on imperfect information. It is STILL discrimination.

23
Statistical Discrimination Similar story has occurred w/ mortgage lending. Belief that, on average, due to current and future wealth (which we can’t always see), W is a better risk than B. “Better” choice is W, based on imperfect information. It is STILL discrimination.
, W is a better risk than B. Better choice is W, based on imperfect information. It is STILL discrimination..")
Similar presentations


 © Allen C. Goodman 2000.>")


 Gender and Race in Pay.>")


