Download presentation
Presentation is loading. Please wait.

1
Joint social selection and social influence models for networks: The interplay of ties and attributes. Garry Robins Michael Johnston University of Melbourne, Australia Symposium on the dynamics of networks and behavior Slovenia, May 10-11, 2004 Thanks to Pip Pattison, Tom Snijders, Henry Wong, Yuval Kalish, Antonietta Pane

2
A thought experiment: Most models that purport to explain important global network properties are homogeneous across nodes. Might a simple model of interactions between node-level and tie-level effects be sufficient to explain global properties? 1.Develop a model that incorporates both social selection and social influence processes. 2.Which global properties of networks are important? 3.Simulate the model to see whether the these properties can be reproduced in a substantial proportion of graphs?

3
1. Develop a model incorporating both social selection and social influence effects

4
Simple random graph models For a fixed n nodes, edges are added between pairs of nodes independently and with fixed probability p (Erdös & Renyi, 1959) Bernoulli random graph distribution: X is a set of random binary network variables [X ij ]; X ij = 1 when an edge is observed, = 0 otherwise; x is a graph realization; θ is an edge parameter. an exponential random graph (p*) model. a homogeneous model – (node homogeneity) p and θ are independent of node labels
![Simple random graph models For a fixed n nodes, edges are added between pairs of nodes independently and with fixed probability p (Erdös & Renyi, 1959) Bernoulli random graph distribution: X is a set of random binary network variables [X ij ]; X ij = 1 when an edge is observed, = 0 otherwise; x is a graph realization; θ is an edge parameter.](http://images.slideplayer.com/16/5011158/slides/slide_4.jpg "an exponential random graph (p*) model. a homogeneous model – (node homogeneity) p and θ are independent of node labels.")
5
A Bernoulli random graph model will not fit this network well

6
In this example, actor attributes are important to tie formation Social selection

7
Yellow: Jewish Blue: Arab (Kalish, 2003) Exogenous attributes affect network ties In this example, actor attributes are important to tie formation Social selection
 Exogenous attributes affect network ties In this example, actor attributes are important to tie formation Social selection")
8
Binary variables: X ij network ties Z i actor attributes Exogenous attributes affect network ties ZiZi ZjZj X ij Robins, Elliott & Pattison, 2001

9
Effects in the model Baseline edge effect irrespective of attributes Propensity for actors with attribute z=1 to have more partners Propensity for ties to form between actors who both have attribute z=1 Equivalent (blockmodel) parameterization:
 parameterization:")
10
Social influence: Are actor attributes influenced by fixed network structure? Robins, Pattison & Elliott, 2001

11
Social influence: Are actor attributes influenced by fixed network structure?

12
A cutpoint Social influence: Are actor attributes influenced by fixed network structure? Exogenous network ties affect attributes

13
Binary variables: X ij network ties Z i actor attributes Exogenous network ties affect attributes ZiZi ZjZj X ij

14
Effects in the model Baseline effect for number of attributed nodes (z=1) Propensity for attributed nodes to have more partners No effect for an actor being influenced by a network partner need to introduce dependencies among attribute variables
 Propensity for attributed nodes to have more partners No effect for an actor being influenced by a network partner need to introduce dependencies among attribute variables")
15
Assume attribute variables are dependent if the actors are tied partial conditional dependence (Pattison & Robins, 2002) ZiZi ZjZj X ij
 ZiZi ZjZj X ij")
16
Effects in the model Baseline effect for number of attributed nodes (z=1) Propensity for attributed nodes to have more partners Propensity for attributed nodes to be connected
 Propensity for attributed nodes to have more partners Propensity for attributed nodes to be connected")
17
Friendship network for training squad in 12 th week of training (Pane, 2003) Green: detached Yellow: team oriented Red: positive Why should attributes or ties be exogenous?
 Green: detached Yellow: team oriented Red: positive Why should attributes or ties be exogenous")
18
Models for joint social selection/social influence ZiZi ZkZk X ik X ij ZjZj

19
Effects in the model Quadratic effect in no. of attributed nodes Propensity for attributed nodes to have more partners Propensity for attributed nodes to be connected Baseline effect for no. of edges Equivalent (blockmodel) parameterization:
 parameterization:.")
20
Change statistics Conditional log-odds for a tie to be observed: Conditional log-odds for an attribute to be observed:

21
2. Which global network properties are important ? –Small worlds Short average geodesics High clustering –Skewed degree distributions –Regions of higher density among nodes cohesive subsets, “community structures”

22
Confiding (trust) network (Pane, 2003) An example network (without attributes)
 network (Pane, 2003) An example network (without attributes)")
23
Many observed networks have short average geodesics – small worlds The confiding network has a median geodesic (G50) of 2: not extreme compared to a distribution of Bernoulli graphs The confiding network has a third quartile geodesic (G75) of 2: also not extreme compared to a distribution of Bernoulli graphs. Observed networks: Path lengths

24
Many observed networks have high clustering – small worlds Observed networks: Clustering Global Clustering coefficient: 3 × (no. of triangles in graph) / (no. of 2-paths in graph) = 3T / S 2 The confiding network has a global clustering coefficient of 0.41: a comparable Bernoulli graph sample has a mean clustering coefficient of 0.25 (sd=0.03)
 / (no. of 2-paths in graph) = 3T / S 2 The confiding network has a global clustering coefficient of 0.41: a comparable Bernoulli graph sample has a mean clustering coefficient of 0.25 (sd=0.03).")
25
Many observed networks have high clustering – small worlds Observed networks: Clustering Local Clustering coefficient: For each node i, compute density among nodes adjacent to i. Average across the entire graph. The confiding network has a local clustering coefficient of 0.58: a comparable Bernoulli graph sample has a mean clustering coefficient of 0.25 (sd=0.04)
.")
26
Many observed networks have high clustering – small worlds The confiding network has a global clustering coefficient of 0.41 The confiding network has a local clustering coefficient of 0.58 Observed networks: Clustering

27
Many observed networks have skewed degree distributions as is the case for the confiding network Observed networks: Degree distribution

28
Observed networks: Higher order clustering k-triangles (Snijders, Pattison, Robins & Handcock, 2004) Alternating k-triangles 1-triangle 2-triangle 3-triangle Permits modeling of (semi) cohesive subsets of nodes (cf community structures)
 Alternating k-triangles 1-triangle 2-triangle 3-triangle Permits modeling of (semi) cohesive subsets of nodes (cf community structures)")
29
Observed networks: Higher order clustering Observed networks often exhibit regions (subsets of nodes) with higher density In which case, we will see an alternating k-triangle statistic higher than for Bernoulli graphs The k-triangle statistic is not simply equivalent to global clustering
 with higher density In which case, we will see an alternating k-triangle statistic higher than for Bernoulli graphs The k-triangle statistic is not simply equivalent to global clustering")
30
Short median geodesics (G50) Short third quartile geodesics (G75) – perhaps? High clustering High k-triangle statistics Skewed degree distributions Bernoulli distributions tend to have short median geodesics, low clustering and low k-triangles Hence a basis for comparison Summary Some global features not uncommon in observed networks

31
3. Simulate the model to see whether global properties can be reproduced

32
Use the Metropolis algorithm – procedure similar to Robins, Pattison & Woolcock (in press) Typically 300,000 iterations reject initial simulations for burnin Sample every 1000 th graph Inspect degree distributions across sample Compare each graph in sample with a Bernoulli graph distribution with same expected density Hence can determine if graph - has short G50, G75 - highly clustered; high k-triangles Define highly clustered and short G50 as SW50 (small world) Similarly define SW75 Simulation of the model
 Typically 300,000 iterations reject initial simulations for burnin Sample every 1000 th graph Inspect degree distributions across sample Compare each graph in sample with a Bernoulli graph distribution with same expected density Hence can determine if graph - has short G50, G75 - highly clustered; high k-triangles Define highly clustered and short G50 as SW50 (small world) Similarly define SW75 Simulation of the model")
33
Quadratic effect in no. of attributed nodes Propensity for attributed nodes to have more partners Propensity for attributed nodes to be connected Baseline effect for no. of edges First simulation series: 30 node graphs

34
Change statistics Conditional log-odds for a tie to be observed: Expect density to be same among: non-attributed nodes (z i = z j = 0) attributed nodes (z i = z j = 1)
 attributed nodes (z i = z j = 1)")
35
Numbers of edges and attributed nodes

36
Assortative and dissasortative mixing

37
Acceptance rates

38
Clustering

39
k- triangles

40
Geodesics and clustering

41
Small worlds

42
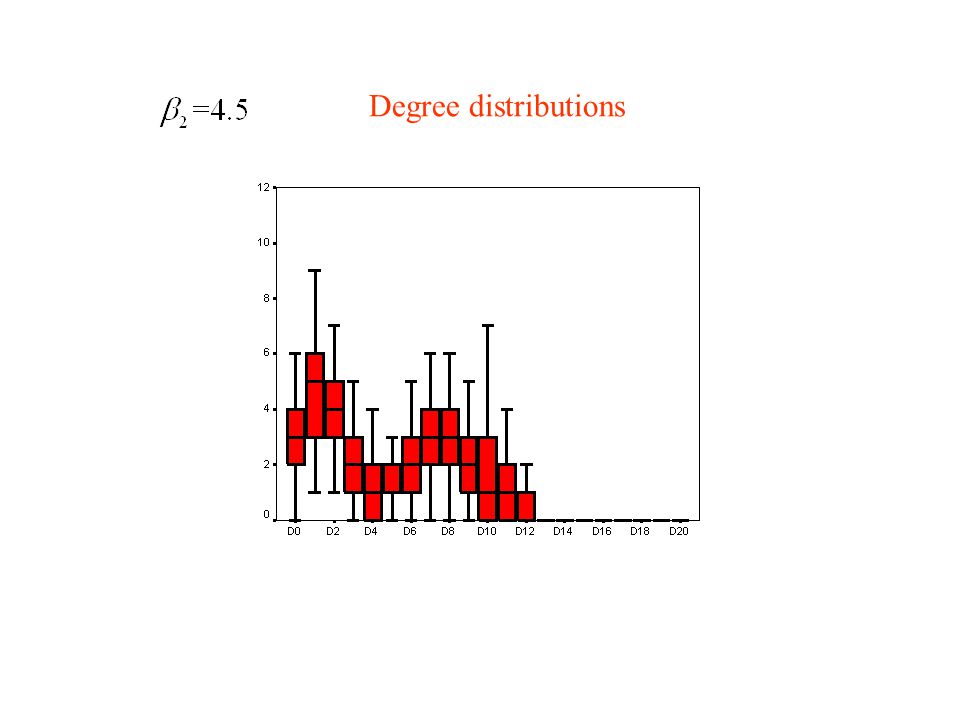
Degree distributions

43
Graph is SW50 (but not SW75) t-statistic for k-triangles (relative to Bernoulli) = 2.02
 t-statistic for k-triangles (relative to Bernoulli) = 2.02")
44
The graph also has a skewed degree distribution: Although unusual for graphs in this distribution

45
Conclusions for this series of simulations The parameter estimates results in approximately equal numbers of attributed and non-attributed nodes –Density within the two sets of nodes are similar and high. As the “attribute expansiveness” (β 1 ) parameter becomes more negative, and the “attribute connection” (β 2 ) parameter more positive: –acceptance rate for attributes decreases, –clustering and community structure increases, 3 rd quartile geodesics decrease, but median geodesic remain relatively short Graphs with “small world” features, but not with skewed degree distributions, are common within a medium range of the “attribute expansiveness” parameter.
 parameter becomes more negative, and the attribute connection (β 2 ) parameter more positive: –acceptance rate for attributes decreases, –clustering and community structure increases, 3 rd quartile geodesics decrease, but median geodesic remain relatively short Graphs with small world features, but not with skewed degree distributions, are common within a medium range of the attribute expansiveness parameter..")
46
Quadratic effect in no. of attributed nodes Propensity for attributed nodes to have more partners Propensity for attributed nodes to be connected Baseline effect for no. of edges Second simulation series: 30 node graphs

47
Numbers of edges and attributed nodes

48
Assortative and dissasortative mixing

49
Acceptance rates

50
Clustering

51
k- triangles

52
Geodesics and clustering

53
Small worlds

54
Degree distributions

57
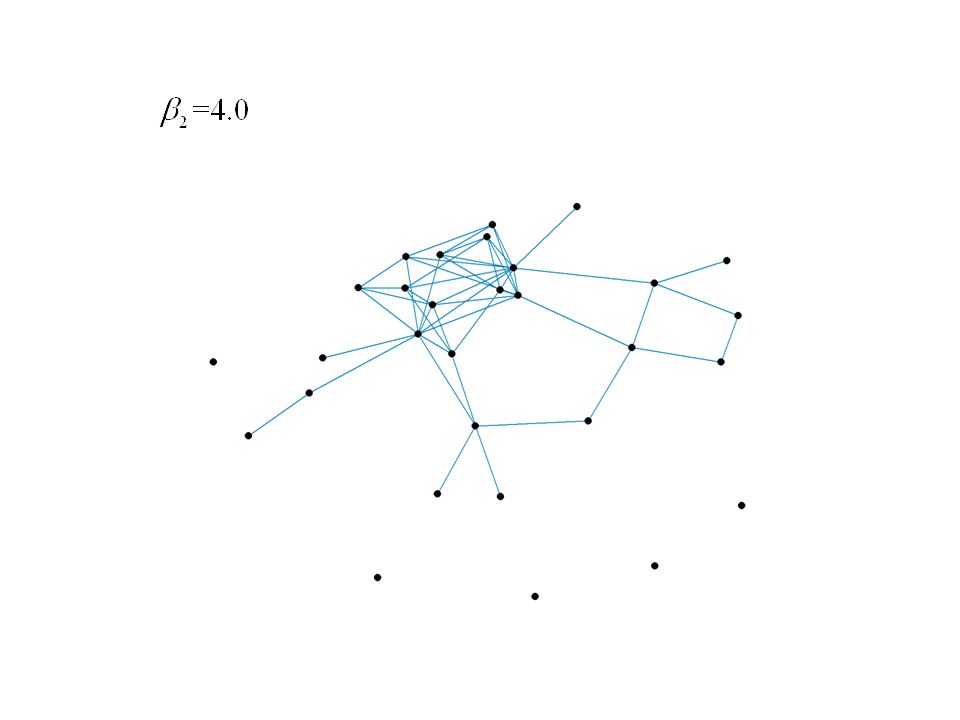
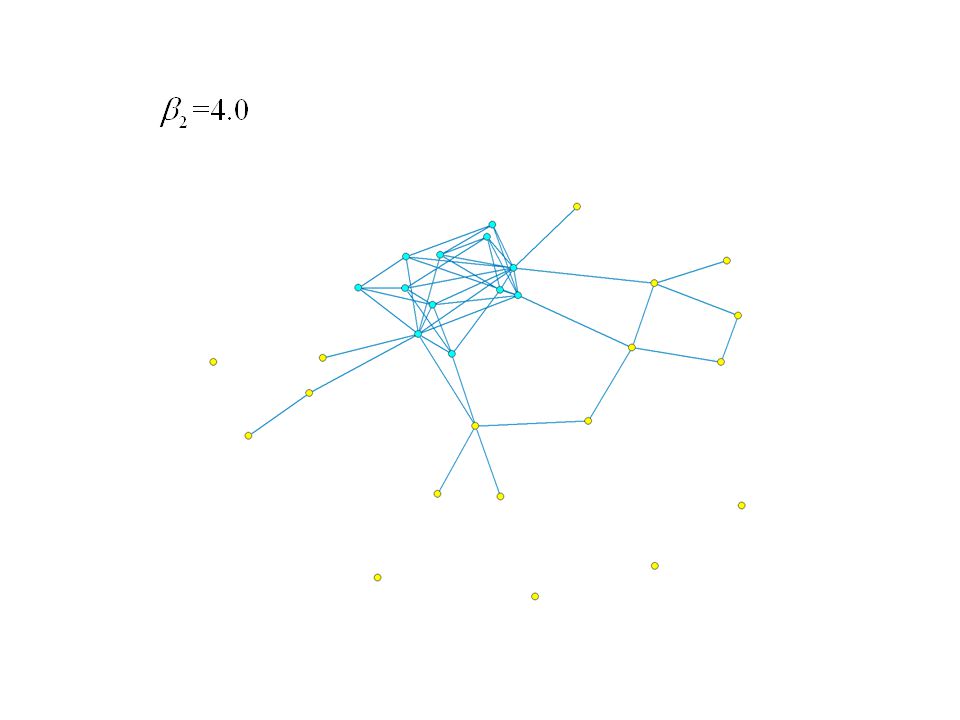
Graph is SW50 (but not SW75) t-statistic for k-triangles (relative to Bernoulli) = 3.98
 t-statistic for k-triangles (relative to Bernoulli) = 3.98")
58
Graph is SW50 (but not SW75) t-statistic for k-triangles (relative to Bernoulli) = 3.98 And with skewed degree distribution
 t-statistic for k-triangles (relative to Bernoulli) = 3.98 And with skewed degree distribution")
61
Conclusions for the second series of simulations The parameter estimates result in a minority of attributed nodes with high internal density, and a majority of non- attributed nodes with lower density. As the “attribute connection” (β 2 ) parameter increases, no of edges and attributes increase somewhat, and acceptance rate for attributes decreases, –clustering and community structure increases, 3 rd quartile and median geodesic become longer. –Degree distributions become skewed, and then bimodal Graphs with “small world” features, and with skewed degree distributions, make up a sizeable proportion of distributions with large “attribute similarity” parameter.
 parameter increases, no of edges and attributes increase somewhat, and acceptance rate for attributes decreases, –clustering and community structure increases, 3 rd quartile and median geodesic become longer. –Degree distributions become skewed, and then bimodal Graphs with small world features, and with skewed degree distributions, make up a sizeable proportion of distributions with large attribute similarity parameter..")
62
Some final comments This “thought experiment” demonstrates that several important global features of social networks may be emergent from attribute-based processes of mutually interacting social influence and social selection: –Short average paths –High clustering –Small world properties –Community structures –Skewed degree distribution Moreover, the models do not presume fixed attributes –although the structural properties begin to emerge as attributes become “sticky” (changing more slowly)
")
63
Some final comments Network models typically assume homogeneity across graphs. –This assumption may not be appropriate to the actual processes that are generating the network. –One way that homogeneity may break down is through attribute-based processes. –Other possibilities include: social settings; geographic proximity Network studies may require a careful conceptualisation of “process” to ensure that models are properly specified. –Because process is (usually) local, with global implications, the possibility of node-level effects should not be excluded.
 local, with global implications, the possibility of node-level effects should not be excluded..")
Similar presentations

 2.Divide the range of possible values for the test.>")


 models for social networks Workshop Harvard University February 2002 Philippa Pattison Garry Robins Department of Psychology.>")


