Download presentation
Presentation is loading. Please wait.

1
GIS, Spatial Analysis and Remote Sensing

2
Teachers, Students HMDC Staff, Planners and administrators Rutgers Researchers, Other Scientists Storage Systems and Databases Web Server & GIS Server Ground Monitoring Station Remote Sensors Reports, maps and publications Ecosystem and sediment chemical data Information Flow

3
Query of Satellite Image Database Landsat Image

5
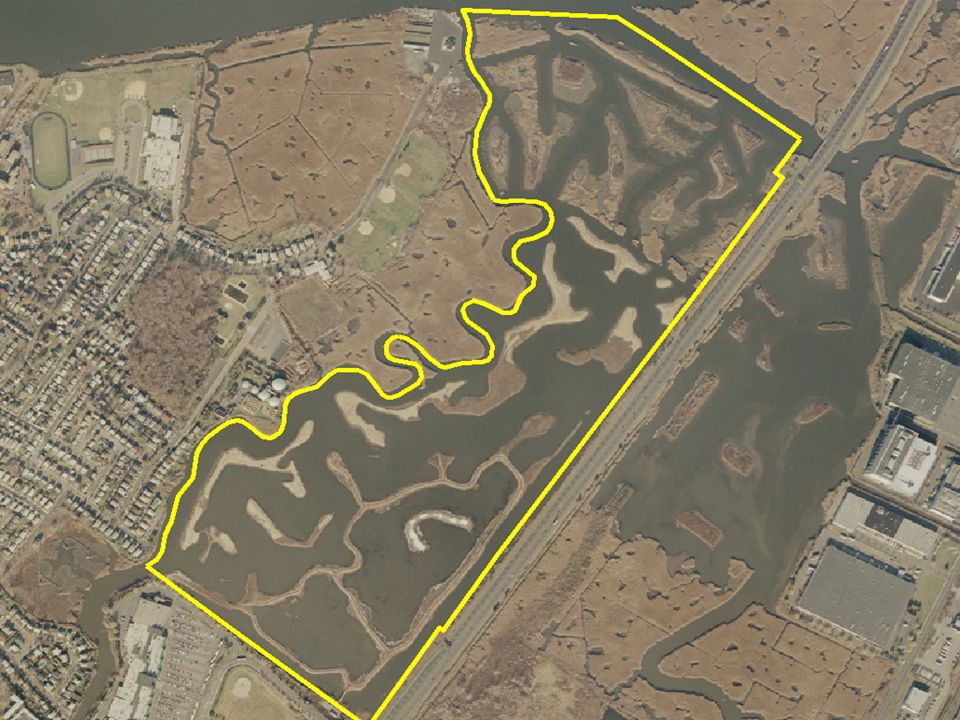
Invasive species How to monitor 8500 acres

6
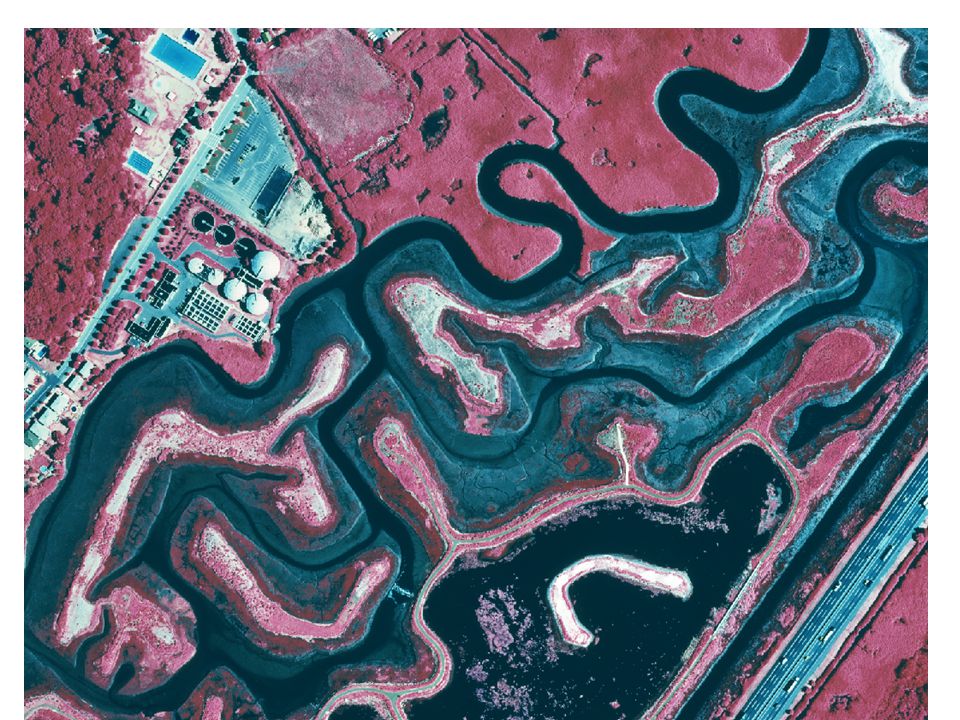
Ponding vigorous spartina Vigorous phragmites Airplane hyperspectral False Color Composit Bands 3, 15, 28 Channels

9
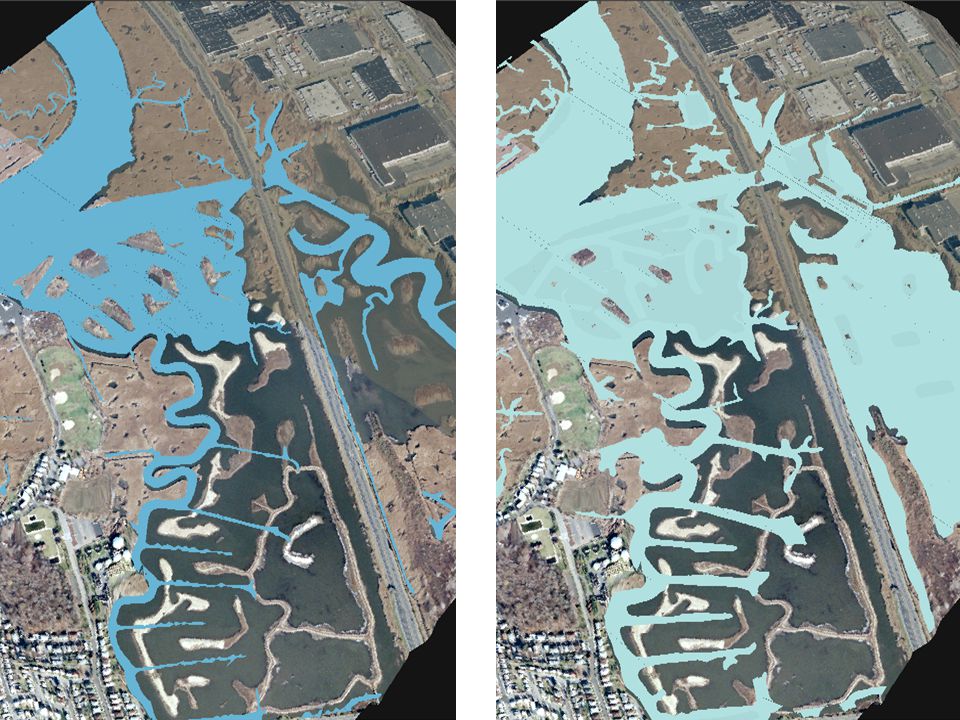
Map of Duration of Flooding in Oritani Marsh darker blue means flooded more hours per day … likely correlated with benthic diversity

10
Model of the salinity gradient in the Hackensack River. Mean of more than 300 measurements between 1989- 2002 (surface derived from Kriging) Intensity of red color indicates salinity concentration. Salinity decreases from the mouth of the river inland
 Intensity of red color indicates salinity concentration. Salinity decreases from the mouth of the river inland.")
11
Wire frame diagram of Hackensack River salinity data

12
12-18 inches 6-12 inches 0-6 inches Example of visualization of sediment chemistry variation with depth Green = low concentration ; Red = high concentration

13
Web-based GIS Interactive Maps

14
How GIS Works A GIS stores information about the world as a collection of thematic layers that can be linked together by geography

15
Overlay parcel map

18
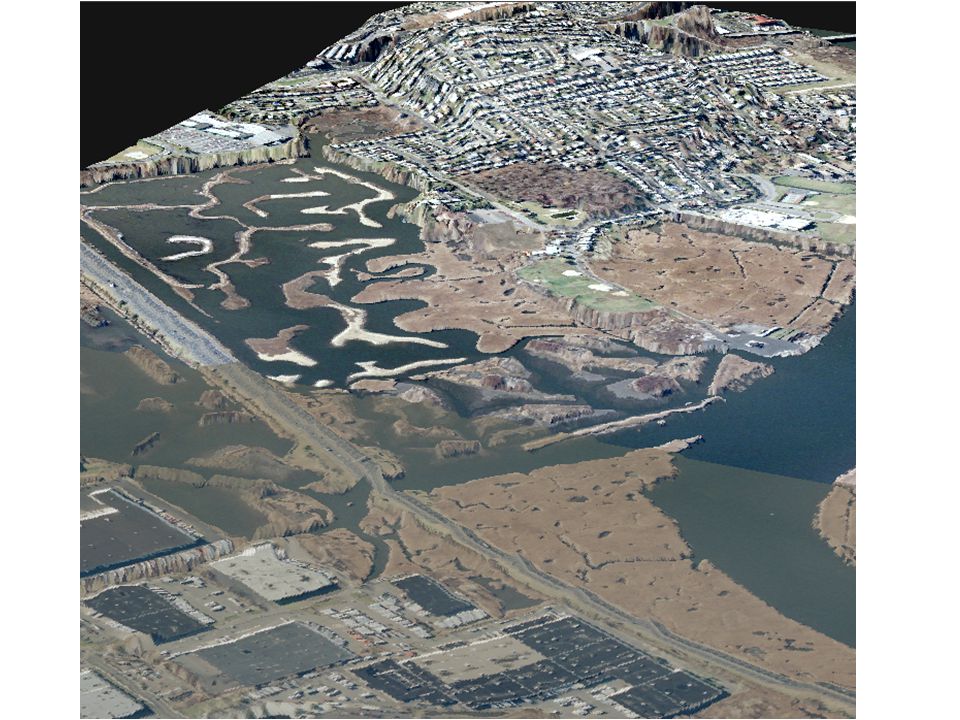
Digital Elevation Model with 1 m resolution aerial photo Mill Creek Site

20
Asthma study Newark NJ

21
1997 data K=15 Clusters tend to align with neighborhood boundaries H UMDNJ Hospital H

22
Intersection of census tract information and asthma cases

23
Less than half on PAV Half on PA More than half on PA Cluster Centers 1997 Cases in terms of Public Assistance

24
Low pop. density Medium pop. density High pop. density Cluster Centers 1998 cases in terms of population density

25
Urban Landscape Texture High density housing Low density housing South Orange Ave.

26
Sick Streets 1997 Yellow 1998 Green H UMDNJ Hospital S. Orange Ave. H Fairmount Cemetery S. 11 th St.

27
Diesel fume sources Asthma case

28
Newark Urban Heat Islands Landsat 5 Thermal Ground level ozone is a photo chemical reaction Greater ozone levels are expected in hotter areas of the city

29
Newark Urban Heat Islands 1998 asthma cases correlated against urban heat islands

30
Newark Urban Heat Islands

Similar presentations


 Pacific Disaster Center.>")


 Researcher ($23,000-$80,000) Planner ($31,000-$77,000) Marketing.>")