Download presentation
Presentation is loading. Please wait.

1
Determining the Local Implications of Global Warming Clifford Mass and Eric Salathe, Patrick Zahn, Richard Steed University of Washington

2
Project Support King County Seattle City Light EPA STAR Program Climate Impacts Group

3
Questions What are the implications of global warming for the Northwest? How will our mountains and land-water contrasts alter the story? Do global models tell us the full story?

4
Regional Climate Prediction To understand the impact of global warming, one starts with general circulation models (GCMs) that provide a view of the global evolution of the atmosphere. GCMs are essentially the same as global weather prediction models but are run with much coarser resolution and allow the composition of the atmosphere to vary in time (e.g., more CO2) Even leading GCMs only describe features of roughly 500 km or larger in scale.
 Even leading GCMs only describe features of roughly 500 km or larger in scale..")
5
Northwest weather is dominated by terrain and land-water contrasts of much smaller scale. In order to understand the implications of global changes on our weather, downscaling of the GCM predictions considering our local terrain and land use is required.

7
Model Topography and Resolution MM5 Topo (15 km)ECHAM5 Topo (150km)
ECHAM5 Topo (150km)")
8
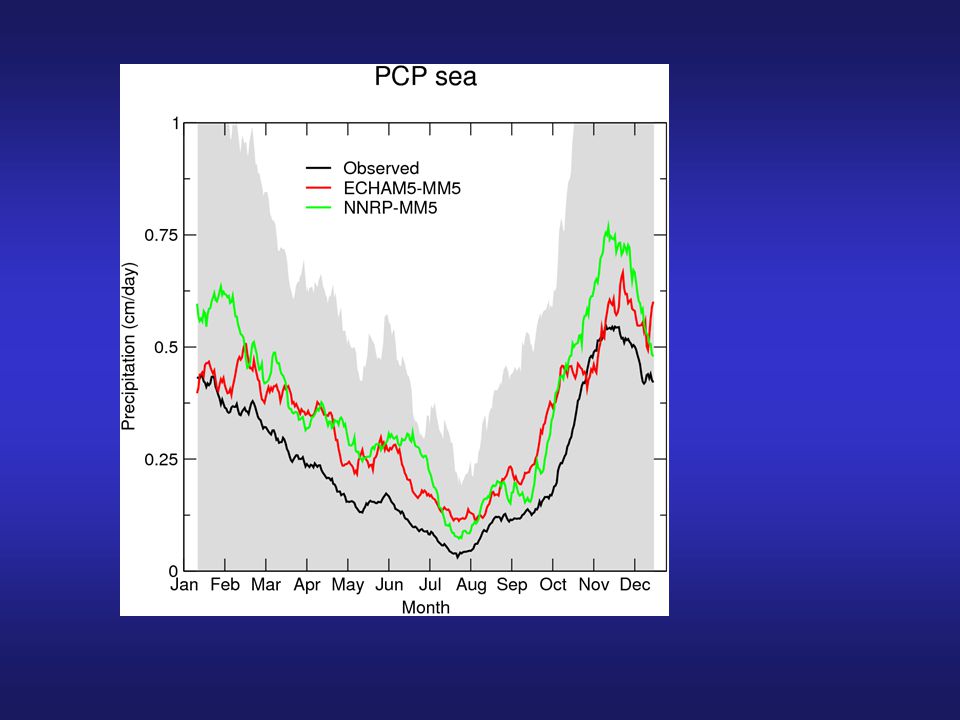
Annual Precipitation

9
Downscaling

10
The traditional approach to use GCM output is through statistical downscaling, which finds the statistical relationship between large-scale atmospheric structures and local weather. Statistical downscaling either assumes current relationships will hold or makes simplifying assumptions on how local weather works.

11
Downscaling Such statistical approaches may be a reasonable start, but may give deceptive or wrong answers… since the relationships between the large scale atmospheric flow and local weather might change in the future.

12
Downscaling There is only one way to do this right… running full weather forecasting models at high resolution over extended periods, with the large scale conditions being provided by the GCMs….this is called dynamical downscaling. Such weather prediction models have very complete physics and high resolution, so they are capable of handling any “surprises”

13
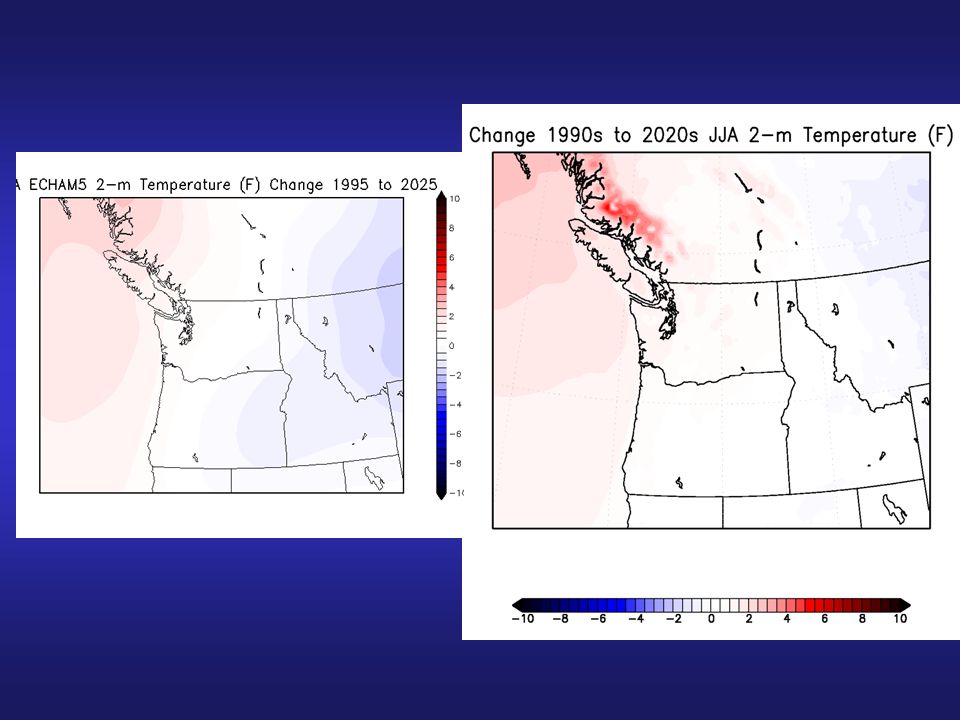
Example of Potential Surprises Might western Washington be colder during the summer under global warming? –Reason: interior heats up, pressure falls, marine air pushes in from the ocean Might the summers be wetter? –Why? More thunderstorms due to greater surface heating.

14
Downscaling Computer power and modeling approaches are now powerful enough to make dynamical downscaling realistic. Takes advantage of the decade-long work at the UW to optimize weather prediction for our region.

15
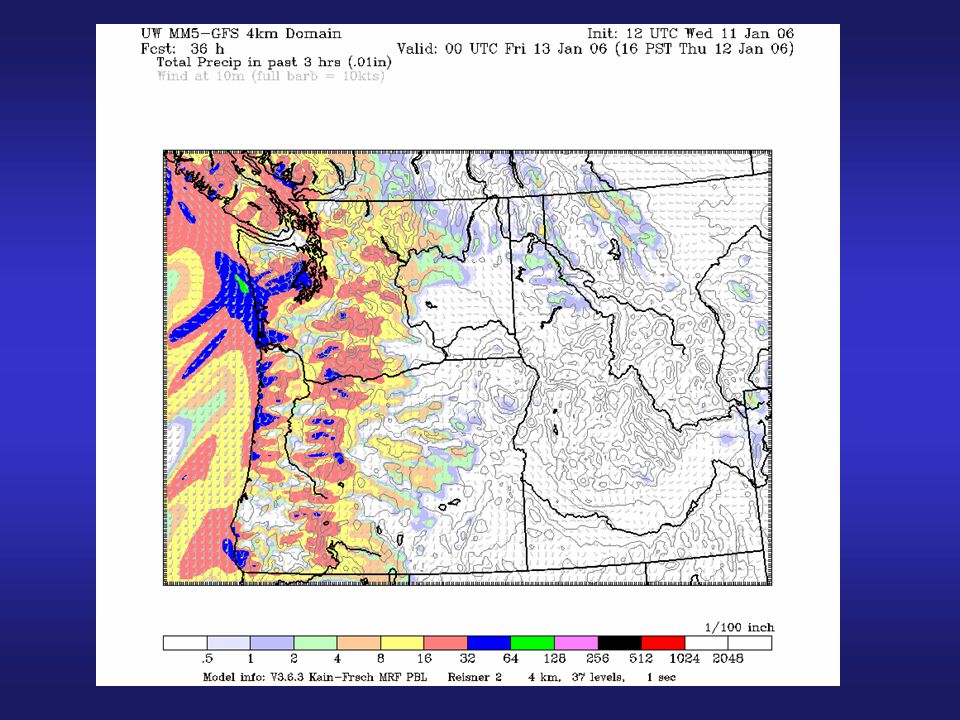
UW Regional Climate Simulations Makes use of the same weather prediction model that we have optimized for local weather prediction: the MM5. 10-year MM5 model runs nested in the German GCM (ECHAM). MM5 nests at 135 km, 45 km, and 15 km model grid spacing.
. MM5 nests at 135 km, 45 km, and 15 km model grid spacing..")
16
MM5 Model Nesting 135, 45, 15 km MM5 domains Need 15 km grid spacing to model local weather features.

17
Regional Modeling Ran this configuration over several ten-year periods: 1990-2000-to see how well the system is working 2020-2030, 2045-2055, 2090- 2100

18
Details on Current Study: GCM European ECHAM model with resolution roughly equivalent to having grid points spaced ~ 150 km apart. Can resolve features of roughly 600 km size or more. IPCC climate change scenario A2 -- aggressive CO 2 increase (doubling by 2050) IPCC Report, 2001
 IPCC Report,")
19
Global Forcing: Surface Temperature

20
First things first But to make this project a reality we needed to conquer some significant technical hurtles. Example: diagnosing and predicting future deep soil temperatures Example: requirements for acquiring GCM output every 6 h and storing massive amounts of output. Evaluating the 1990-2000 simulations

21
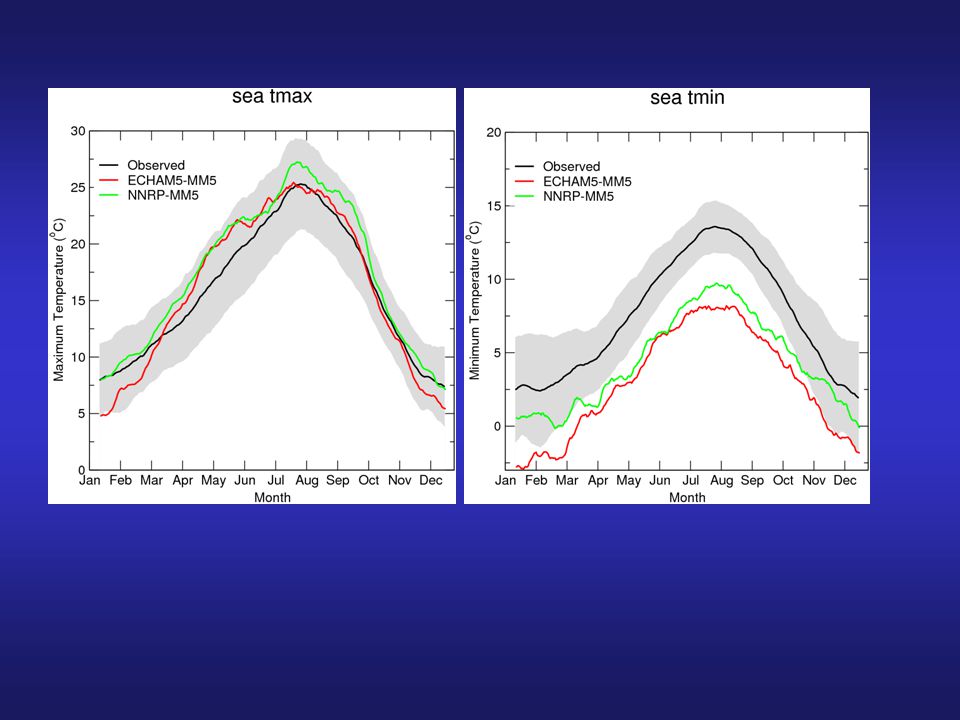
Evaluating of Model Fidelity We have carefully evaluated how well the GCM and the MM5 duplicated the 1990-2000 period. We previously had run the system using another GCM…the Parallel Climate Model…with unsatisfactory results….crazy cold waves during the winter. ECHAM Model appears far better…but not perfect.

23
Too Cold Cold episodes occurred 1-2 times per winter with temperature getting unrealistically cold (below 10F) in Puget Sound: Also a general cold bias to minima Better than previous attempts.
 in Puget Sound: Also a general cold bias to minima Better than previous attempts.")
24
Why Cold Outbreaks? Widespread surges of arctic air originate in ECHAM5, likely owing to poorly-resolved terrain (Cascades and Rockies). Extreme cold air inherited by MM5. Results from previous experiments with lower- resolution (T42) GCM indicate that higher resolution reduces frequency and severity of unrealistic cold events. Also problem in model physics--probably more important
. Extreme cold air inherited by MM5. Results from previous experiments with lower- resolution (T42) GCM indicate that higher resolution reduces frequency and severity of unrealistic cold events. Also problem in model physics--probably more important.")
25
The Fix Our research during the past few months suggests the problem was a bug in the land surface model. Fixed in the current version and will be used in next production runs.

26
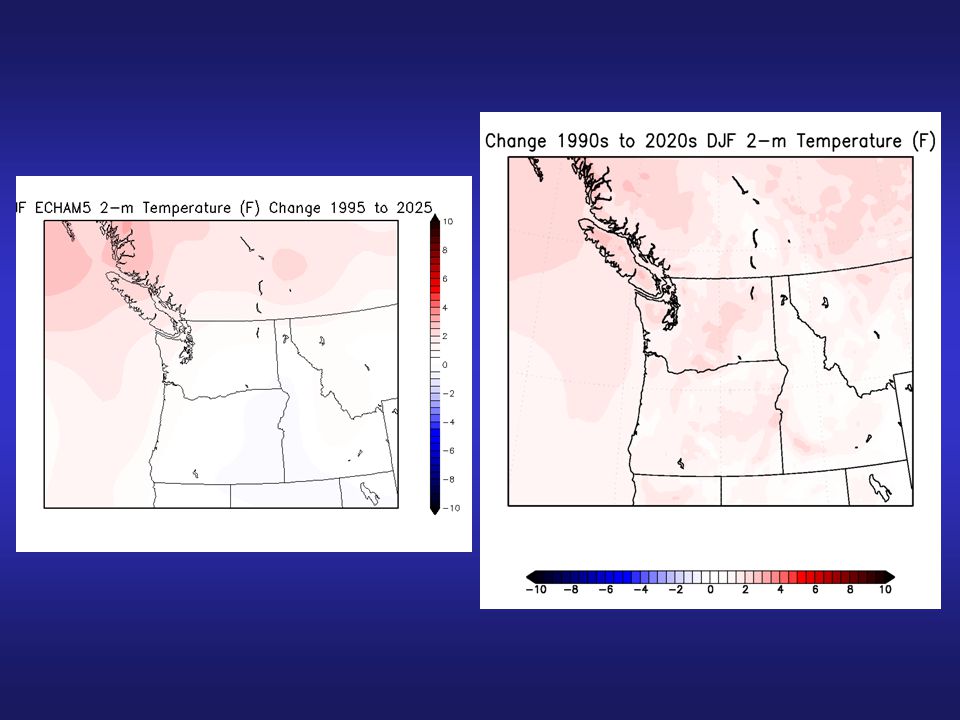
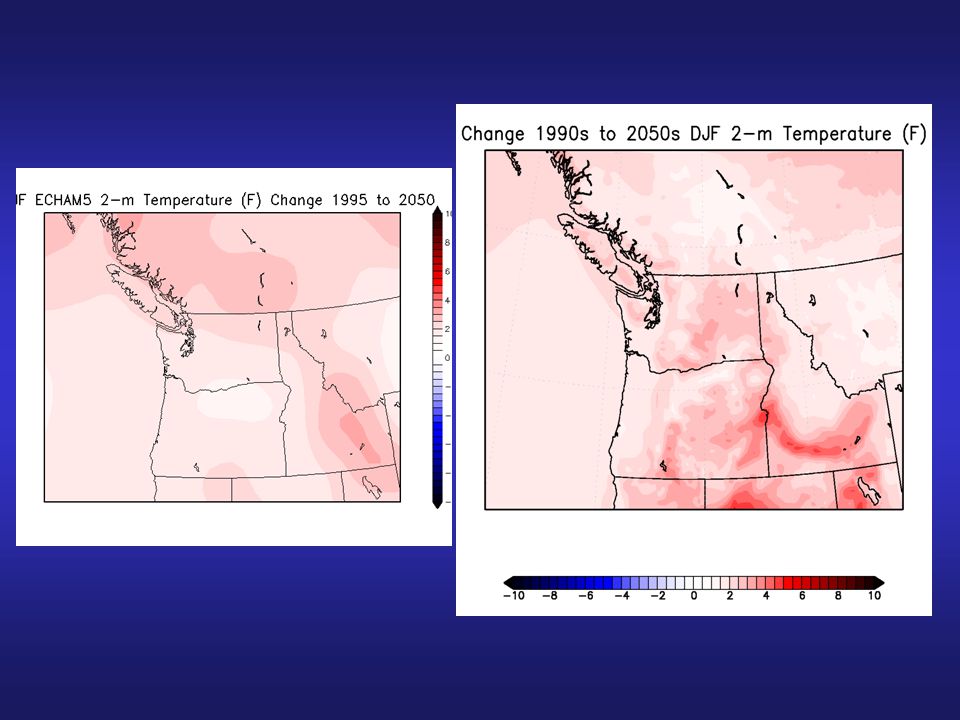
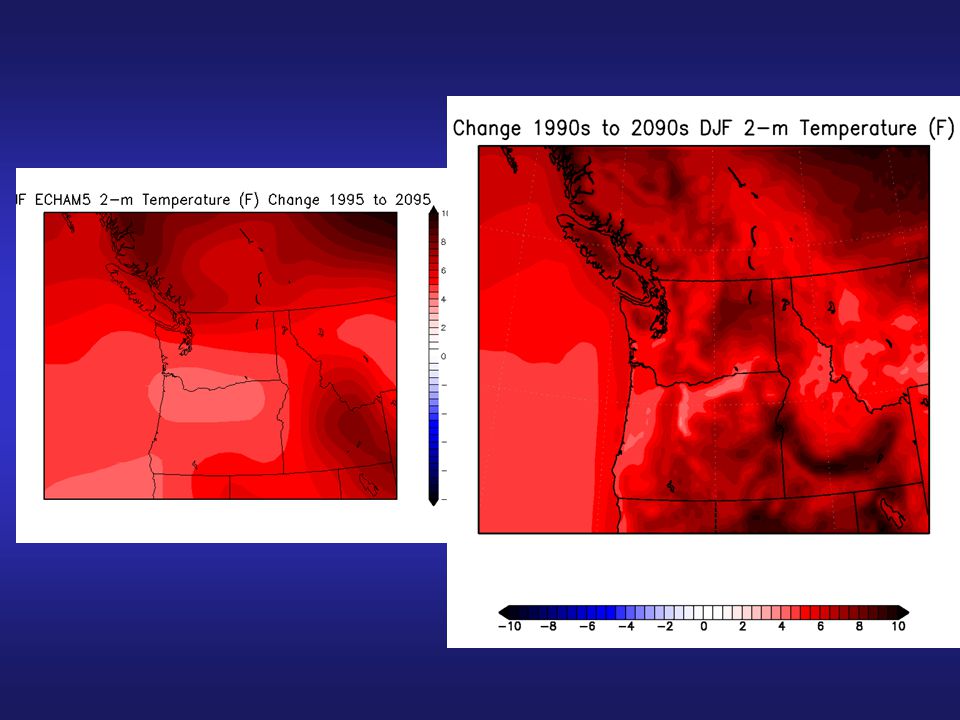
Evaluation of Future Runs Because there are some biases in the GCM runs, results for future decades (2020s, 2040s, and 2090s) will be evaluated against the ECHAM5-MM5 1990-2000 baseline
 will be evaluated against the ECHAM5-MM baseline")
27
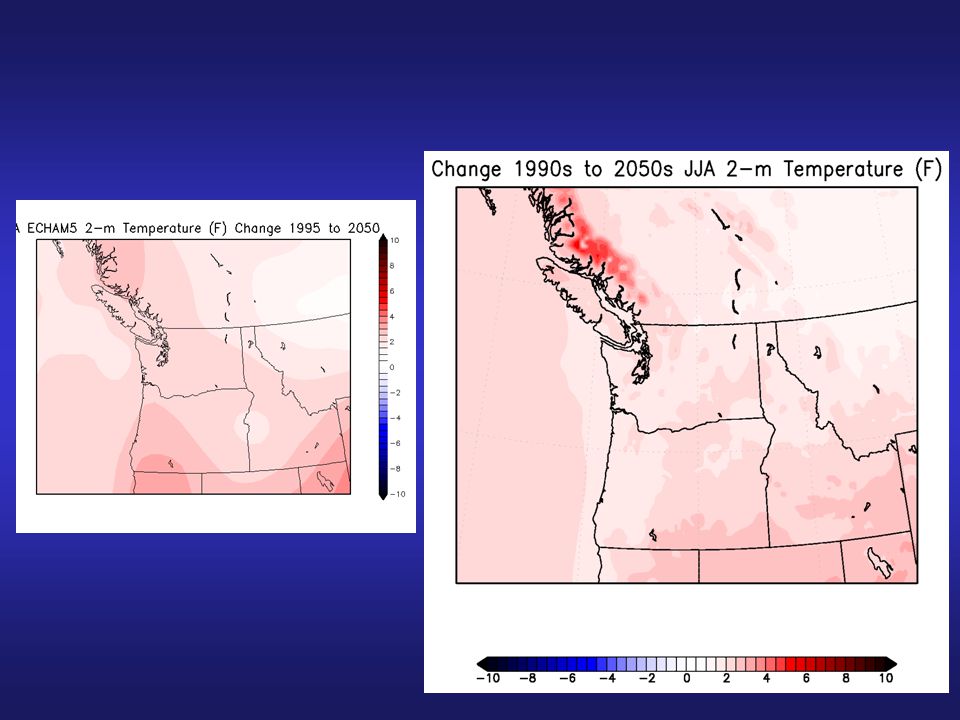
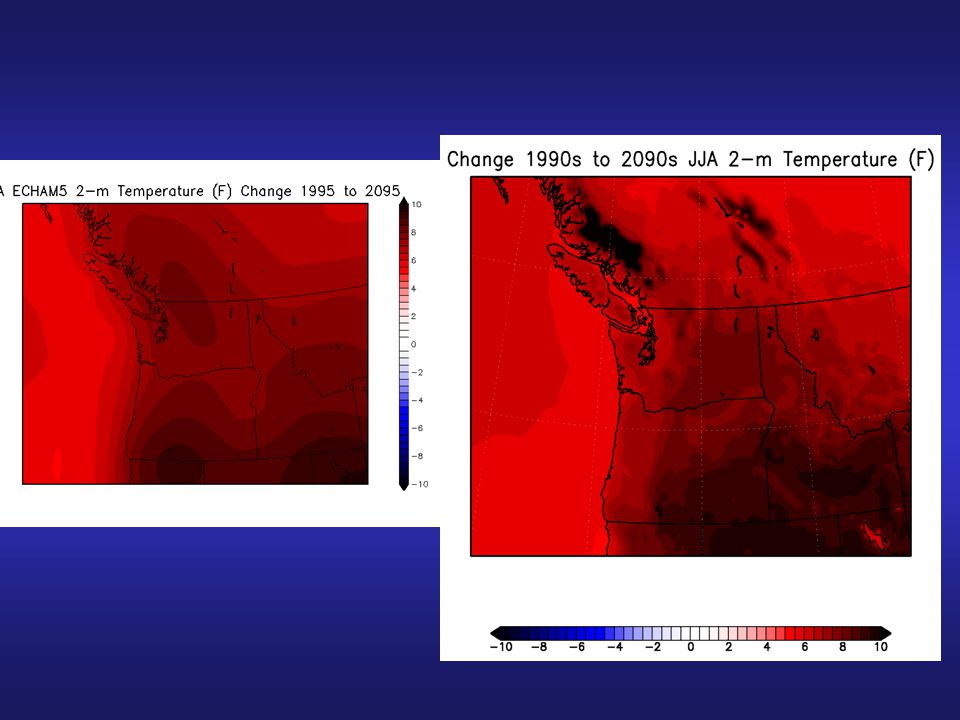
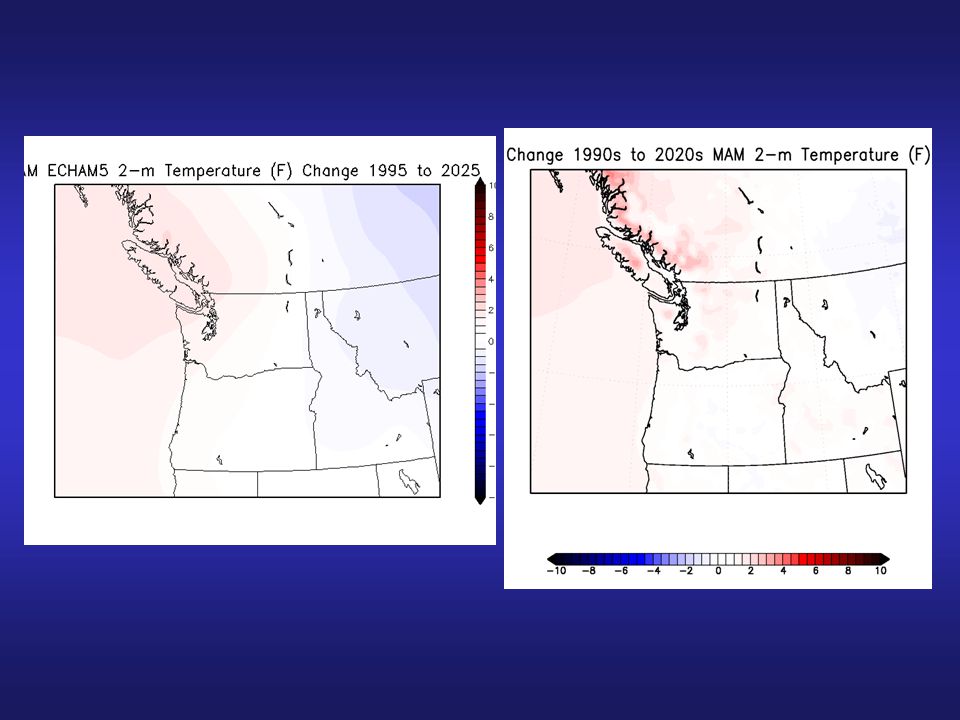
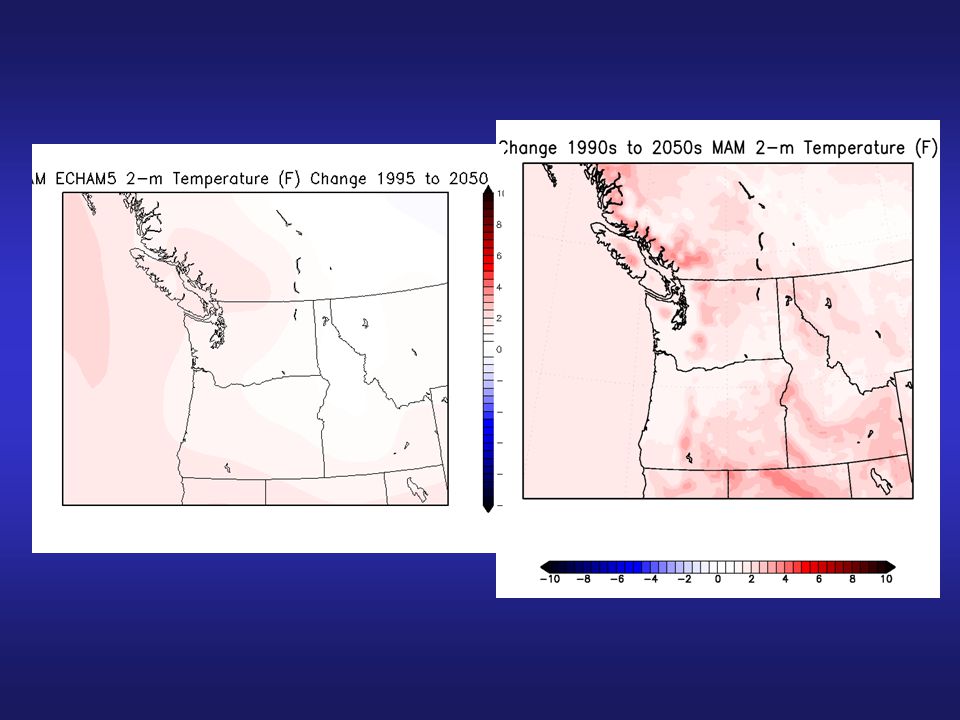
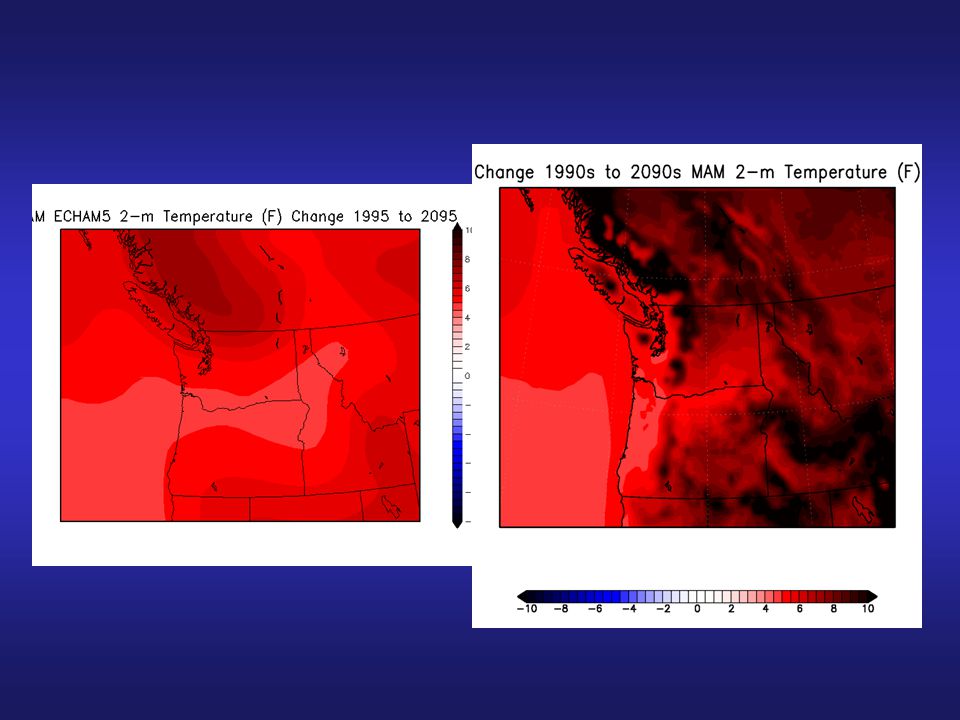
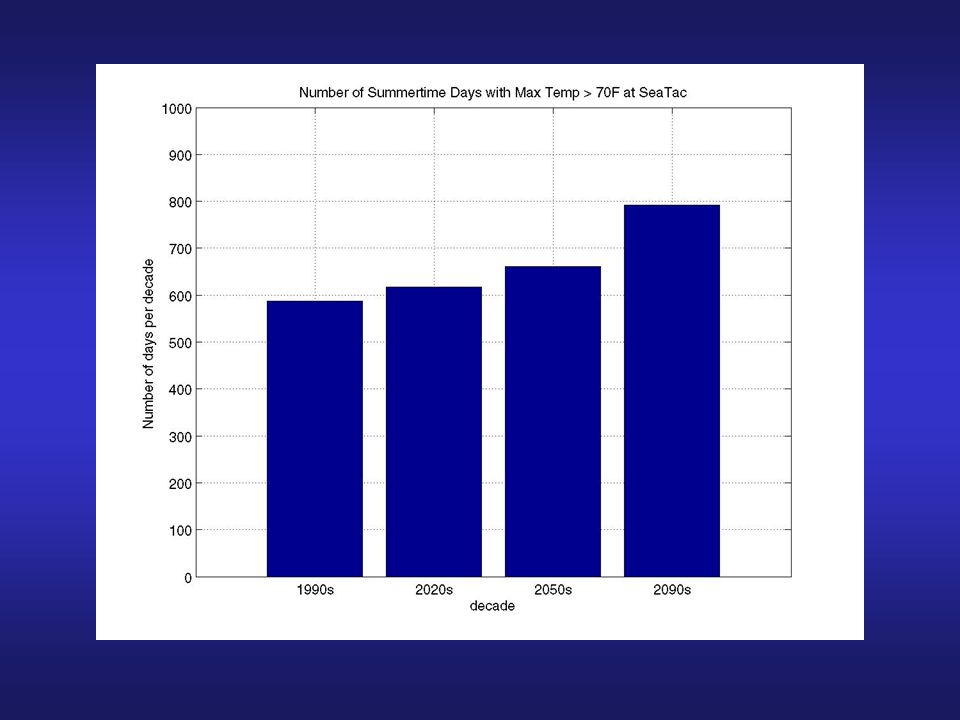
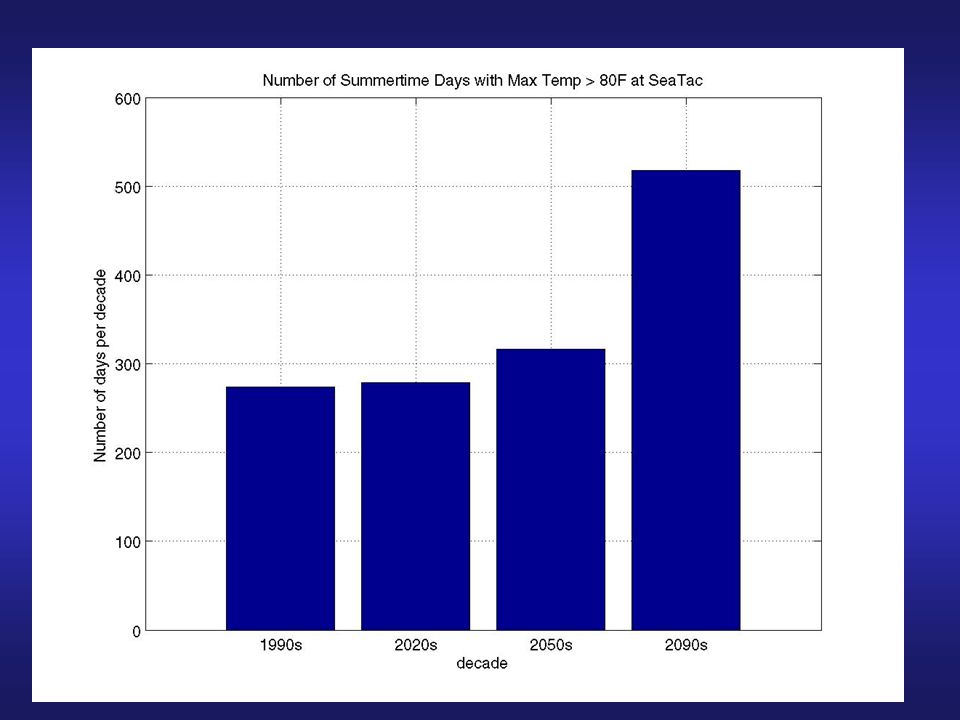
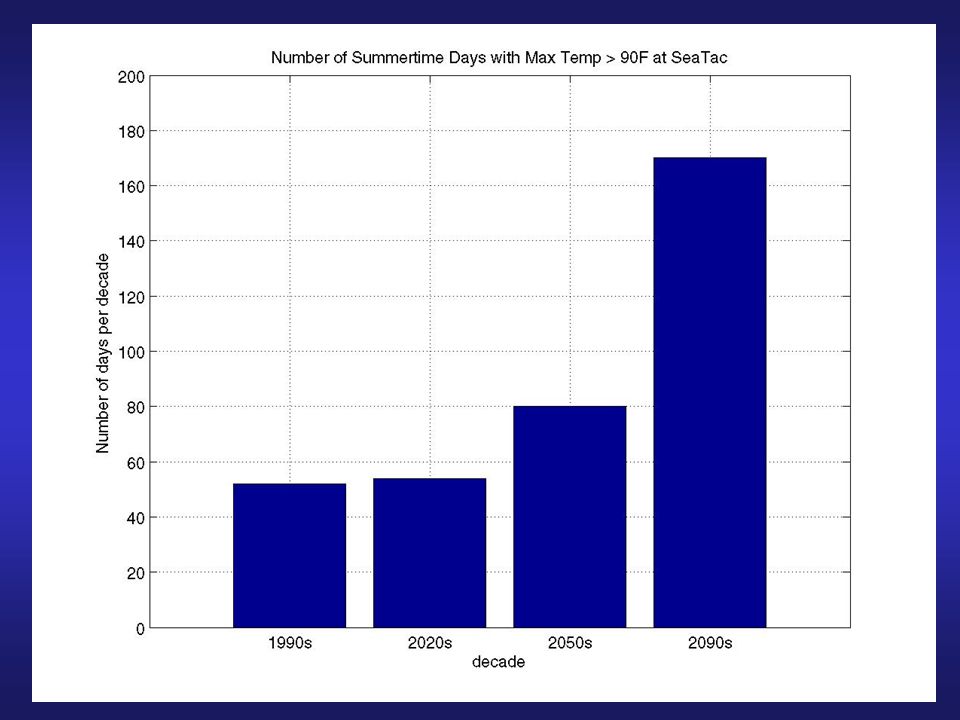
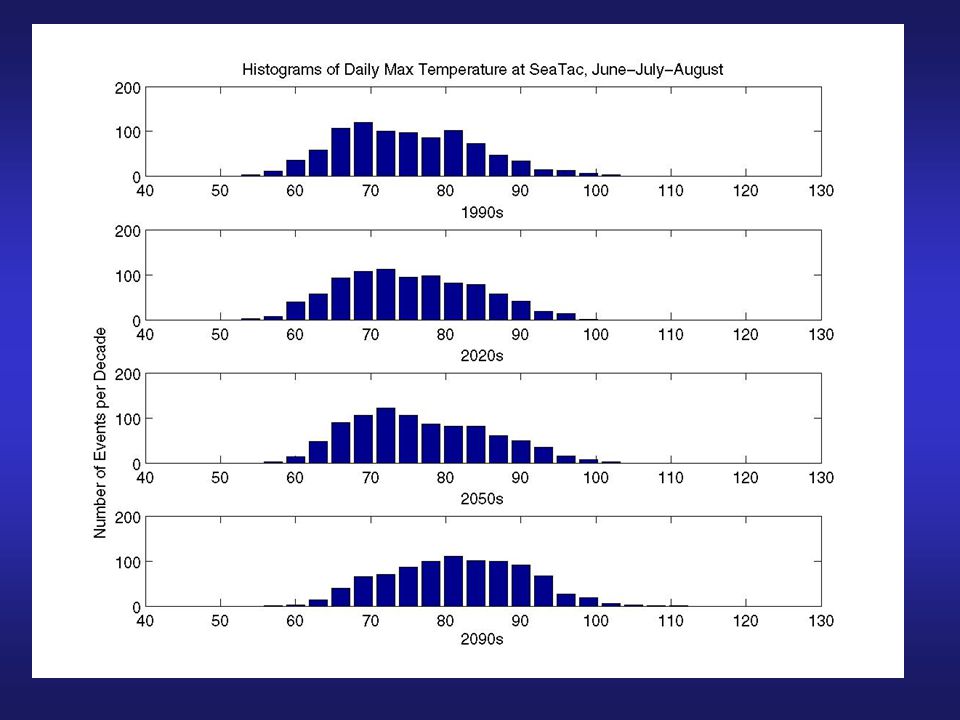
Now, The Future

37
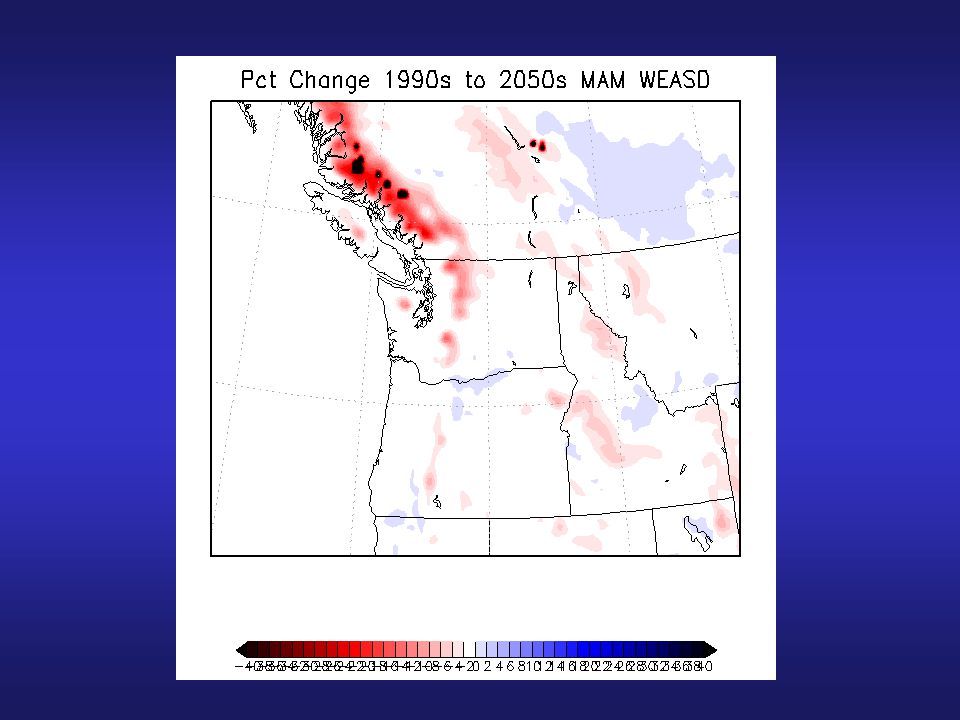
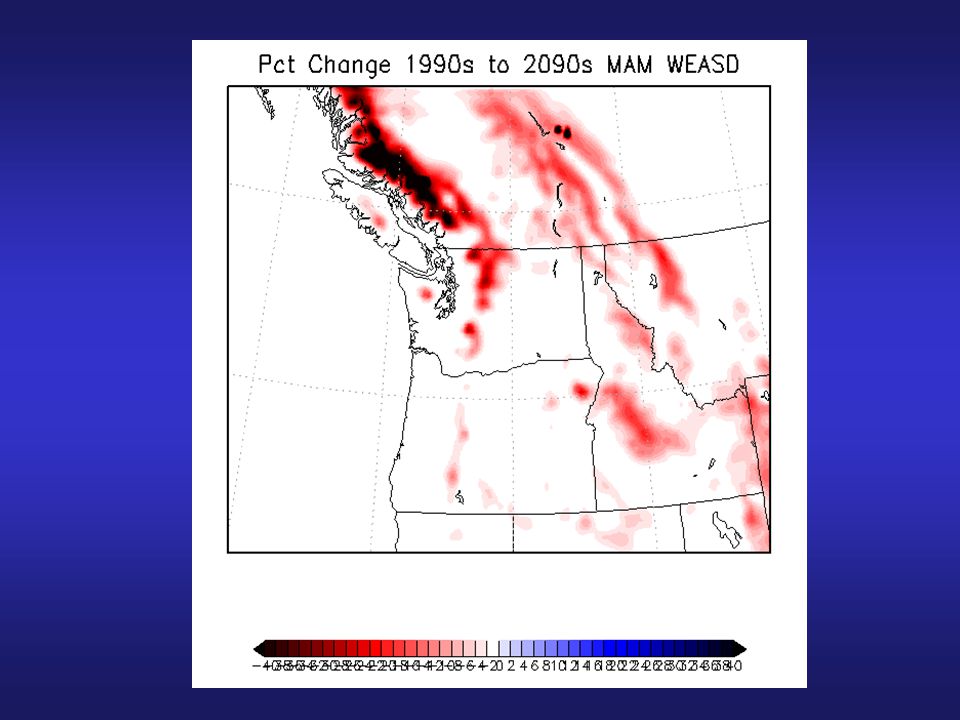
Why Such Strong Warming on Mountain Slopes..Particularly in Spring? Probable Answer: Snow melt resulting in more solar heating.

38
Change in Water Of Snowpack (%)
")
41
Solar Radiation Snow and Ice Reflect Much of The Incoming Solar Radiation Now

42
Solar Radiation Global Warming Causes Snow level to Rise Resulting In Absorption of Solar Energy on Melted Slopes =WARMING Future

44
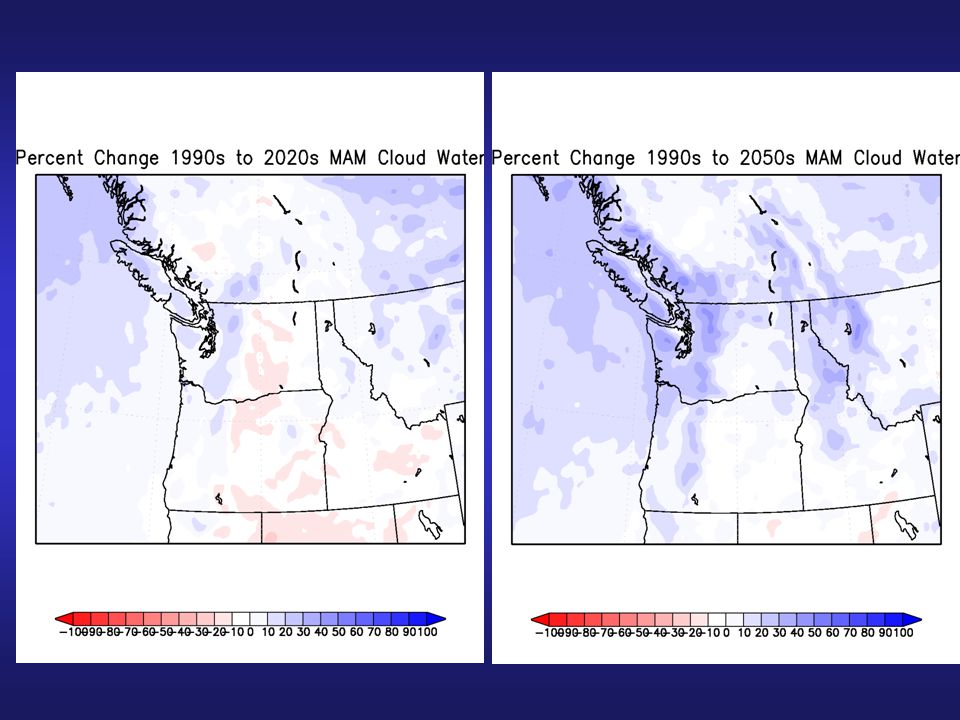
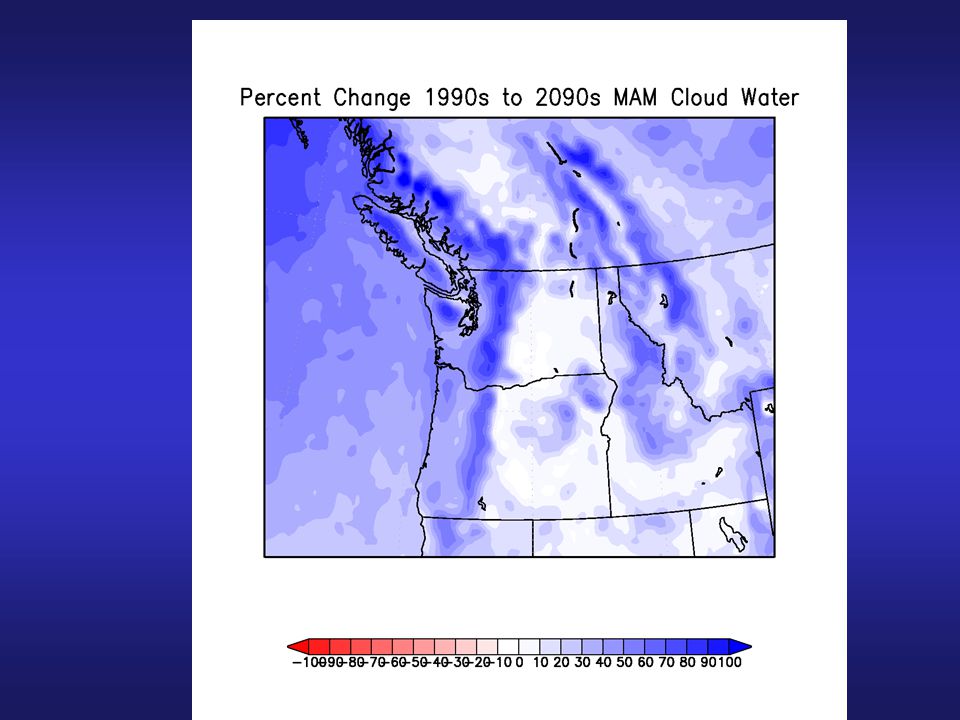
Why Cooling West of Cascades in Spring? Low clouds due to more onshore flow from off the cool, cloud Pacific. The Montereyization of the western lowlands!

52
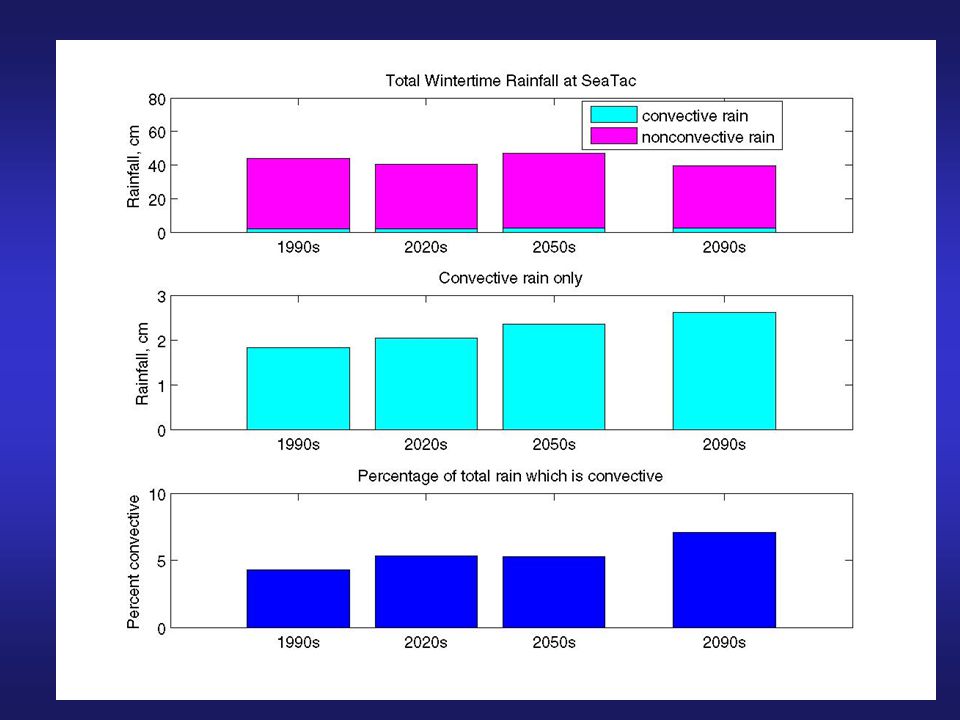
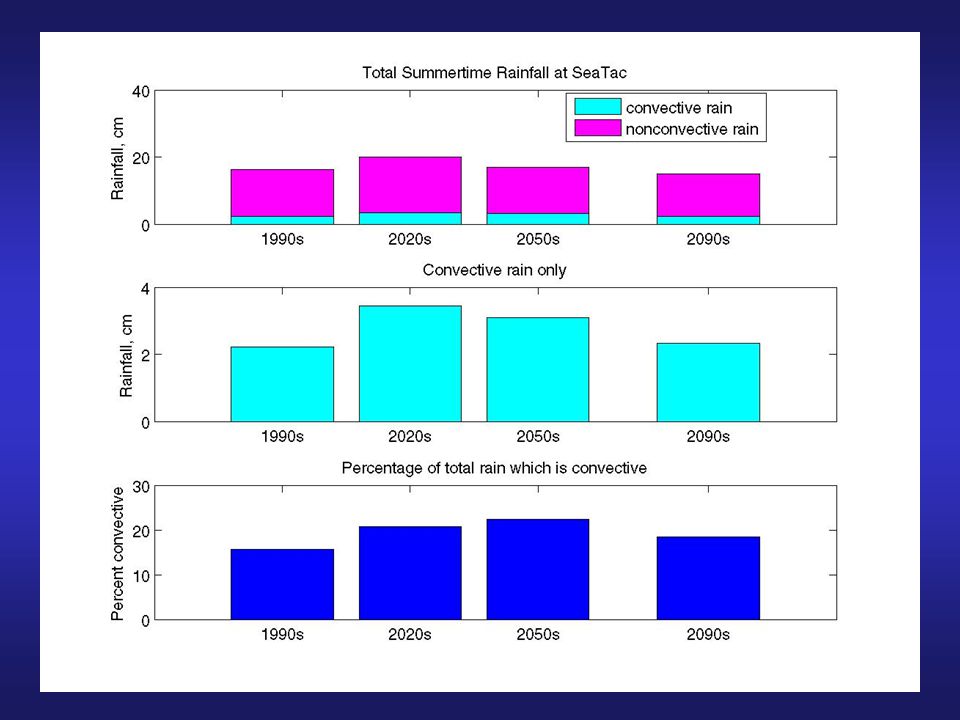
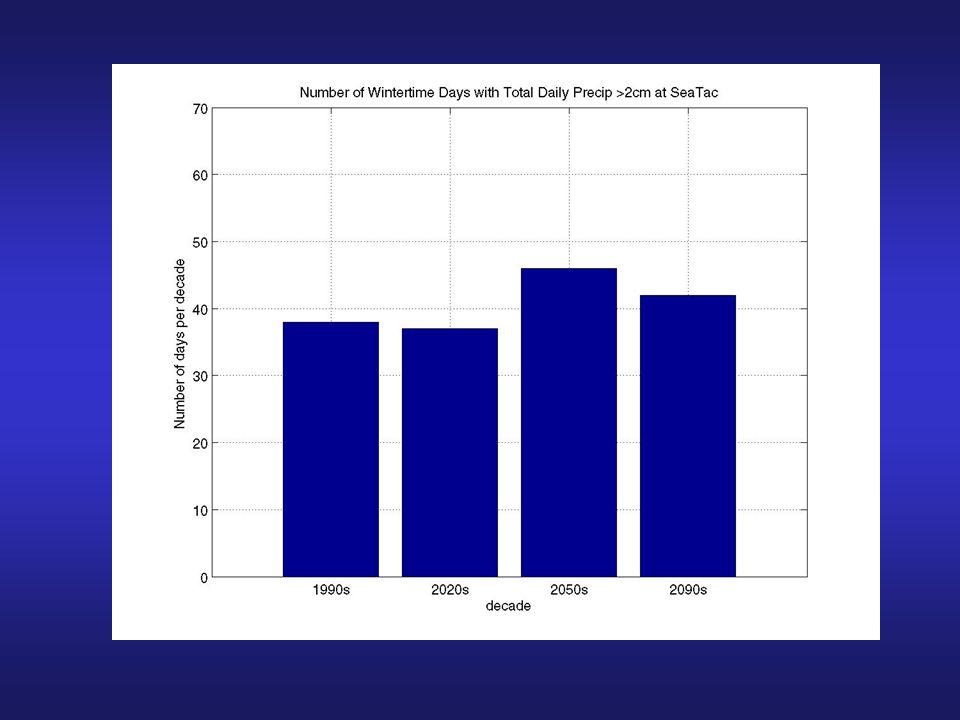
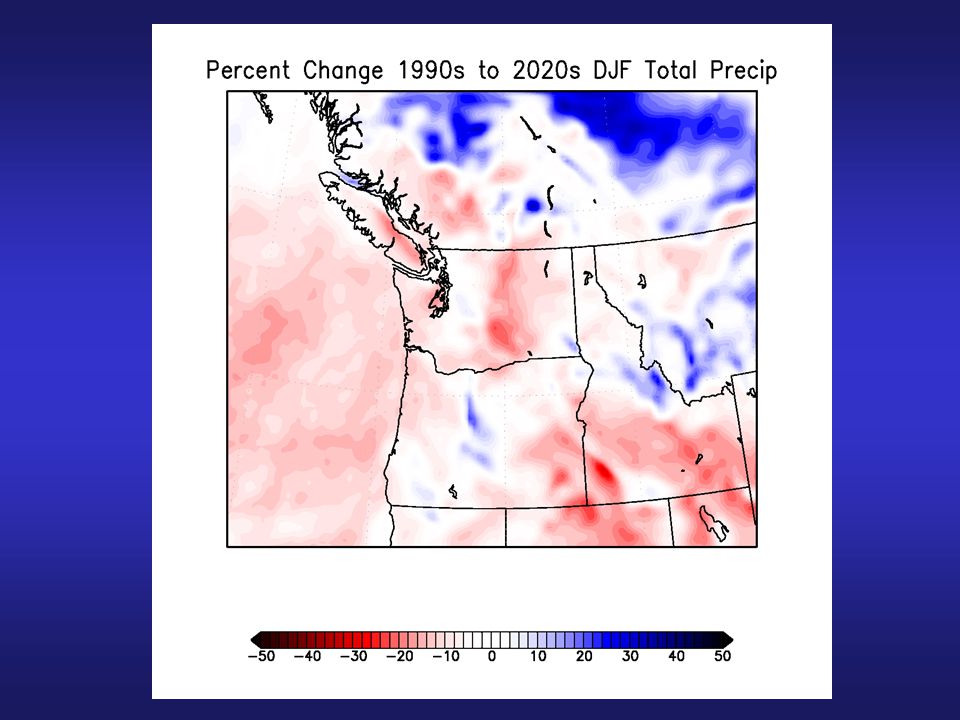
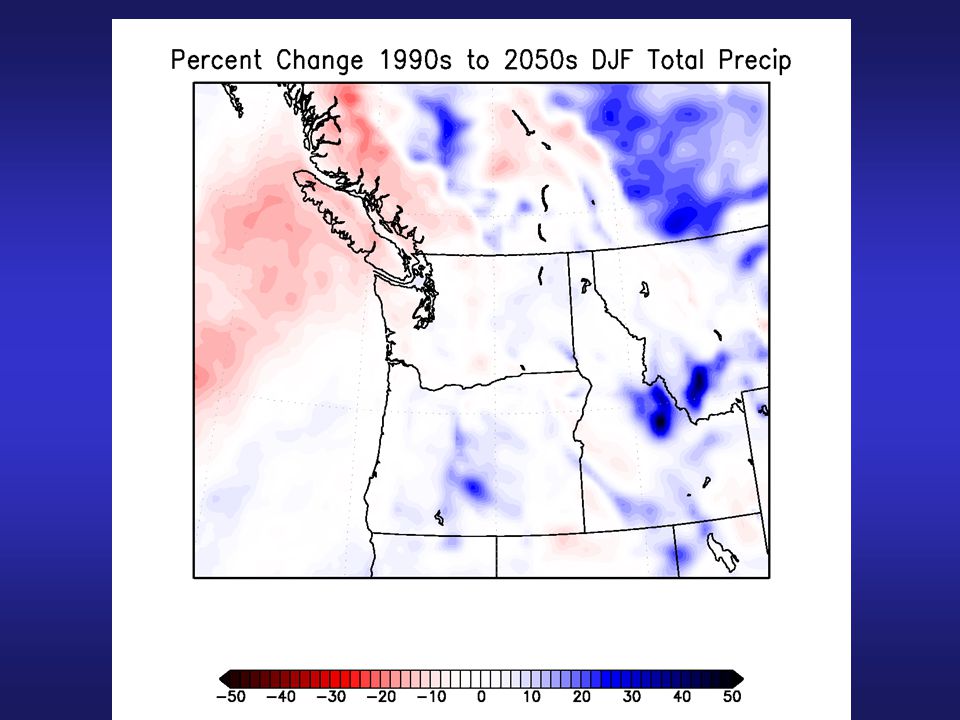
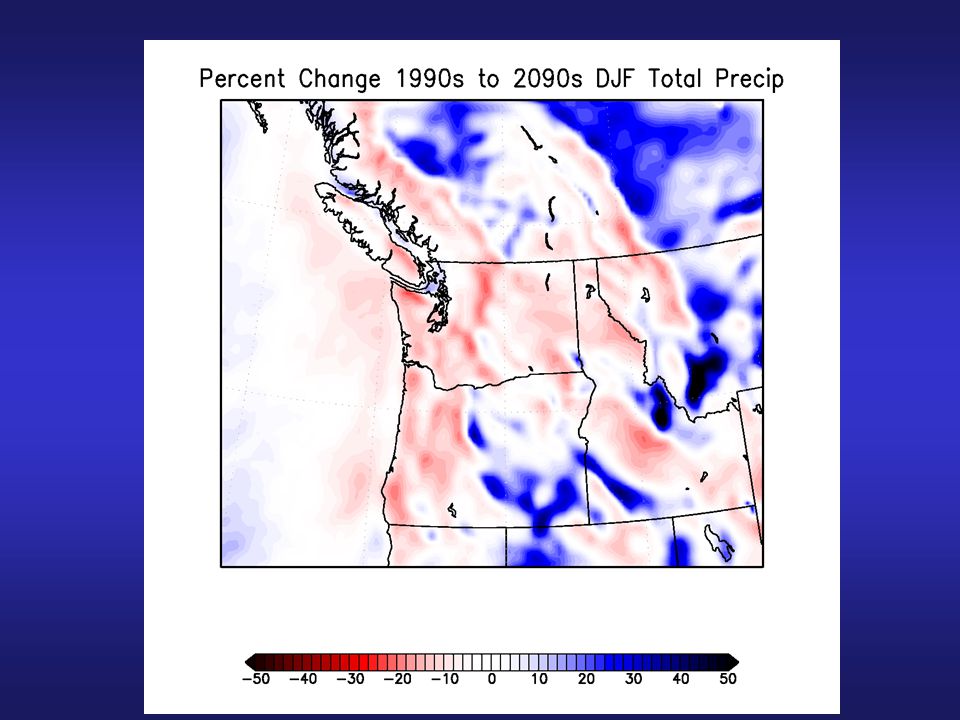
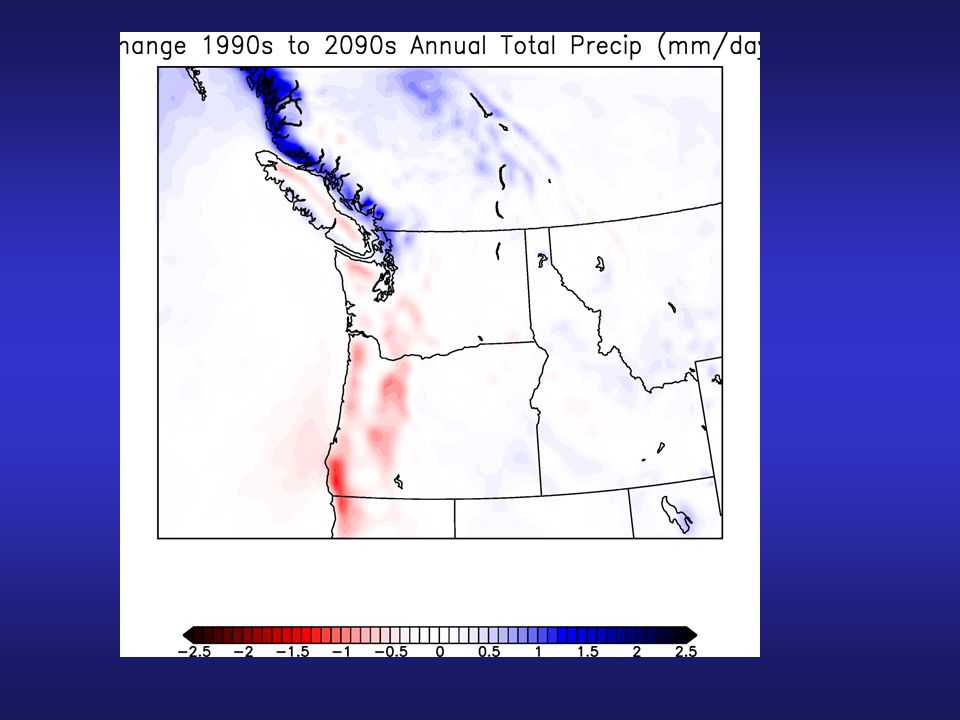
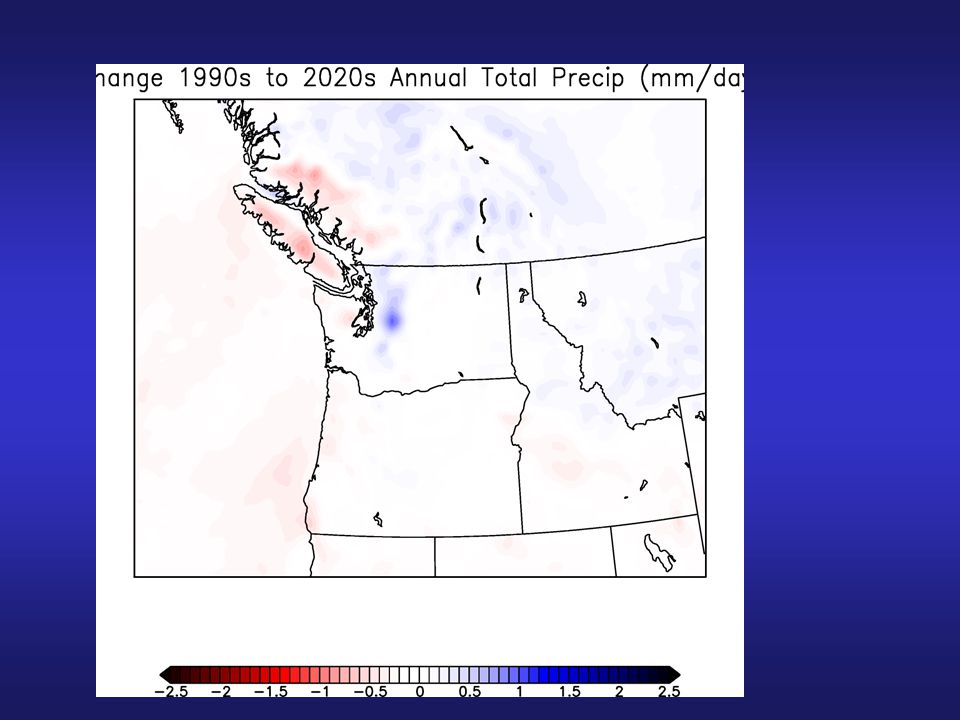
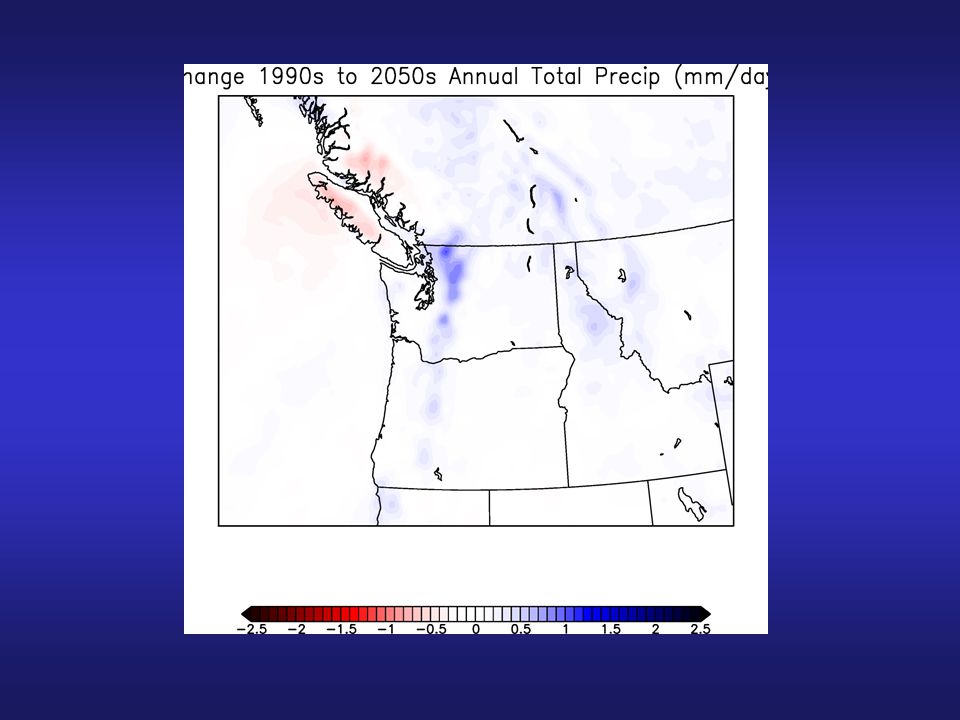
Precipitation Bottom Line: No Large Regional Trends

59
Summary The viability of the approach…using high resolution numerical prediction models forced by large-scale general circulation climate models (GCMs)… has been demonstrated. Careful evaluation of the GCM output is required…there are deficiencies. Although there is general warming over the region for all seasons, the terrain and land water contrasts of the region enhance or weaken the warming in certain areas.

60
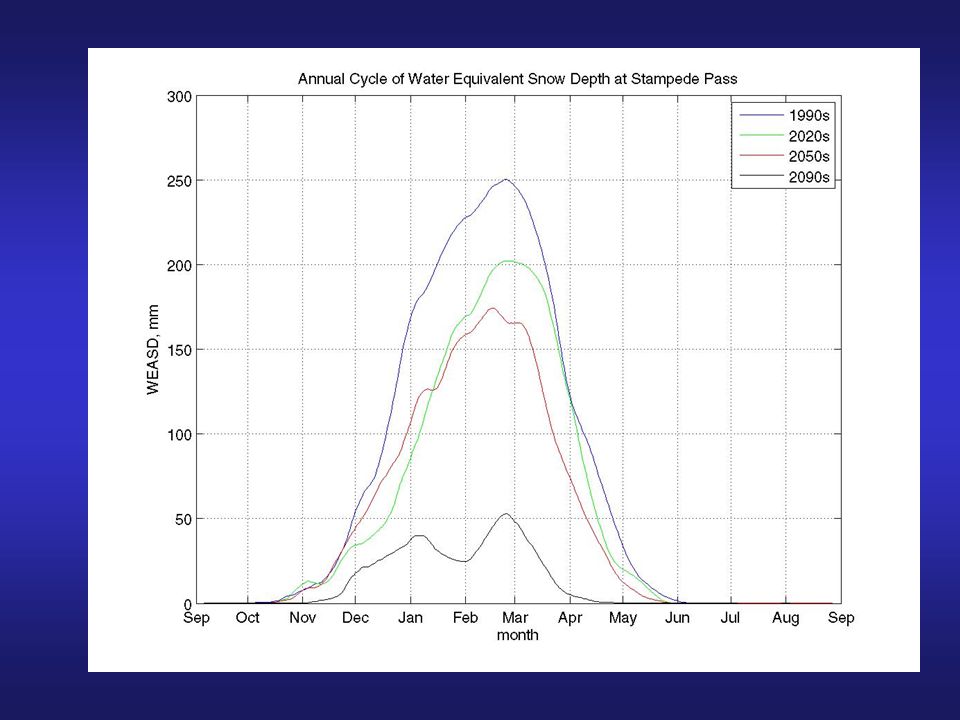
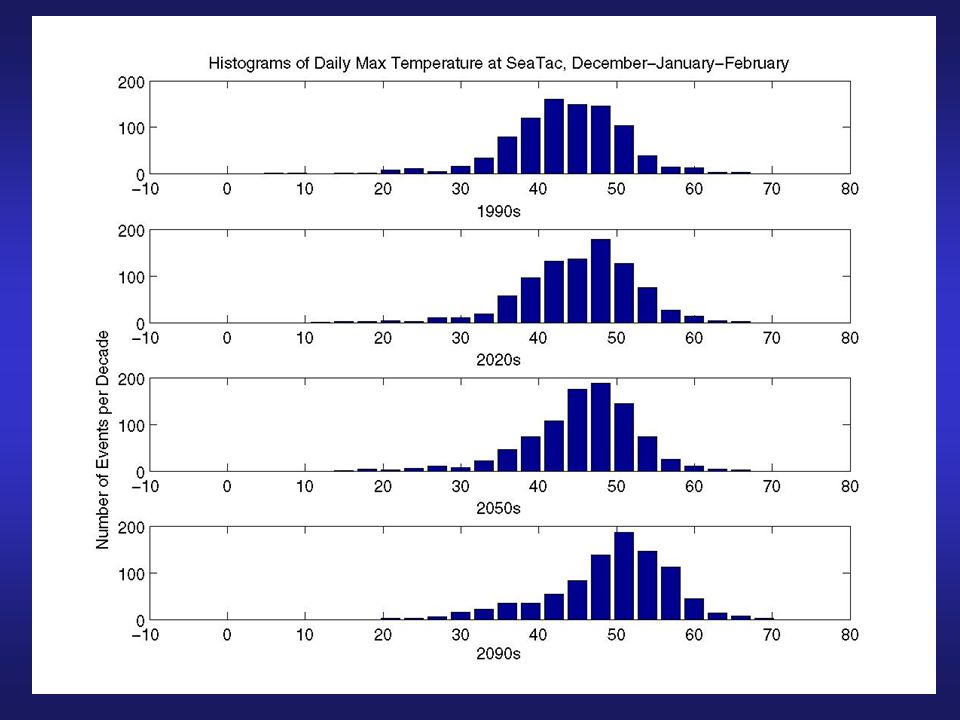
Summary Warming is enhanced on the upper windward slopes due to snow melt. Springtime warming is lessened west of the Cascade crest due to more low clouds. Many more hot days during the summer. Precipitation changes are more modest then temperature changes. There will be a substantial loss of snowpack, reaching catastrophic decreases by 2090.

61
Future Work We are just in the beginning of this work. Need to find and remove causes of biases and cold outbreaks Need to test other global warming scenarios Will try to find higher resolution GCMs Try more sophisticated MM5 physics More analysis.

62
The END

63
:

64
Climate Change in the Pacific Northwest: Do Global Models Tell the Whole Story? Eric Salathé CSES Climate Impacts Group University of Washington With: Cliff Mass, Rick Steed, Patrick Zahn WSU, USDA Forest Service, NCAR Eric Salathé CSES Climate Impacts Group University of Washington With: Cliff Mass, Rick Steed, Patrick Zahn WSU, USDA Forest Service, NCAR

65
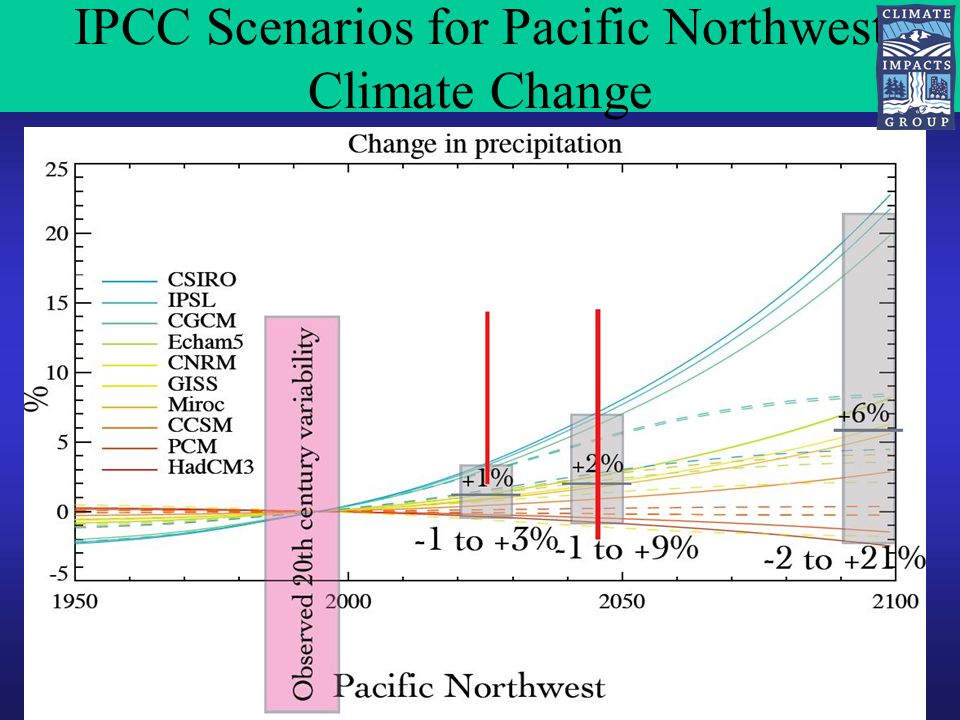
IPCC Scenarios for Pacific Northwest Climate Change

67
Empirical Downscaling Assumes climate model captures temperature and precipitation trends Regional Climate Model Represents regional weather processes May produce local trends not depicted by global models Downscaling Methods Used in CIG Impacts studies

68
Mesoscale Climate Model -- MM5 Based on MM5 Weather Model ECHAM5 Climate Model used to force Mesoscale Simulation Nested grids 135-45-15 km Nudging on outermost grid by forcing global model Advanced land-surface model (NOAH) with interactive deep soil temperature
 with interactive deep soil temperature")
69
More Rain

70
Shift in Pacific Storm Track Salath é, Geophys Res Lett, 2006 NCEP-NCAR Reanalysis 20th Century Model Composite 21st Century Model Composite 1950-2000 to 2050-2100 Nov-Dec-Jan Composite of 10 Global Models “Observed” Climate

71
MM5 Result for Sep-Oct-Nov Change in Sep-Oct-Nov Precip (mm/day) 1990s to 2050s Contours: Change in 500-mb heights Increased Westerly Flow
 1990s to 2050s Contours: Change in 500-mb heights Increased Westerly Flow")
72
MM5 vs Statistical Downscaling Statistical Downscaling Precip onlyPrecip & Winds MM5 Change in November Precip (mm/day) 1990s to 2050s
 1990s to 2050s")
73
More Warming

74
Winter Warming in MM5 1990s to 2050s Temperature Change Difference between MM5 and ECHAM5 Change in Winter Temperature (degrees C) Less warming In MM5 More warming In MM5
 Less warming In MM5 More warming In MM5")
75
Loss of Snow cover and Warming Temperature Change Change in Winter Temperature (degrees C) Snow Cover Change Change in fraction of days with snow cover
 Snow Cover Change Change in fraction of days with snow cover")
76
January to April in MM5 -50

77
Comparison of MM5 and HCN Observations

78
Consistent trend over 21st Century 2020s2050s2090s Change in Winter Temperature (degrees C)
")
79
Winter Trends at Various Stations MM5 - ECHAM5 Temperature Change (°C)
")
80
Winter Trends at Various Stations MM5 - ECHAM5 Temperature Change (°C) 10 IPCC Models 1950200020502100
 10 IPCC Models")
81
Regional Model Compared to Global Model 2020s2050s2090s Change in Winter Temperature (degrees C)
")
Similar presentations


 Earth’s surface would be 60F cooler than today…no life.>")


 University of Washington Constructing regional climate change scenarios.>")


