Download presentation
Presentation is loading. Please wait.

2
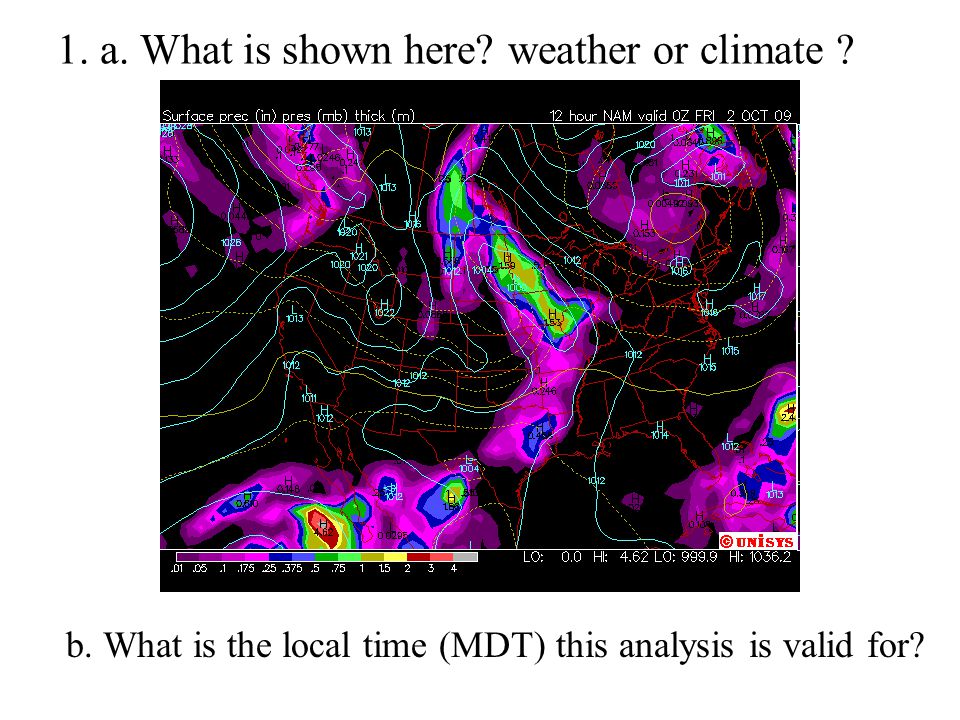
1. a. What is shown here? weather or climate ? b. What is the local time (MDT) this analysis is valid for?
 this analysis is valid for .")
3
2. Imagine, hypothetically, that the Earth surface cooled off, e.g. because the solar constant decreased. The Earth cooled off so much that the wavelength at which most terrestrial radiation is emitted increased to 15 micron. What would the main greenhouse gas be in this scenario? 15

4
3. Choose from any of these three planets. Which one has the (a) highest surface pressure (b) highest planetary albedo (c) highest surface temperature Mars EarthVenus
 highest surface pressure (b) highest planetary albedo (c) highest surface temperature Mars EarthVenus.")
5
4. a.What is the chemical cycle shown below called? b.What is the name of the gas being cycled? c. In what region of the atmosphere is this gas mostly found? d. What drives this cycle? O 2 +h 2O ( <0.25 m - UV-c) O + O 2 + M O 3 + M O 3 +h O + O 2 ( <0.31 m - UV-b) O + O 3 2 O 2 Formation: Destruction:
 O + O 2 + M O 3 + M O 3 +h O + O 2 ( <0.31 m - UV-b) O + O 3 2 O 2 Formation: Destruction:.")
6
Why is the sky up high blue? Why is the horizon near sunset orange? 5

7
6a. What is the wind speed & direction in Laramie (LAR) at this time? b. What is the weather in Rawlins (RWL)? c. What is the dewpoint in Riverton (RIW)?
. c. What is the dewpoint in Riverton (RIW) .")
8
7. In what layer does weather occur?

9
8. Is water vapor (a) a greenhouse gas? (yes/no) (b) uniformly mixed in the troposphere? (yes/no) (c) more abundant than ice on Earth? (yes/no)
 (c) more abundant than ice on Earth. (yes/no).")
10
9. (a) How much is the net shortwave (solar) radiation received by the atmosphere, in units of the Fig below? (b) How much is the net longwave (terrestrial) radiation lost by the atmosphere? (c) How much is the net radiative energy loss/gain in the atmosphere? (d) Is this a net loss or a net gain? (e) what prevents the atmosphere from heating up (cooling down) if you said a gain (loss) in (d)?
 How much is the net shortwave (solar) radiation received by the atmosphere, in units of the Fig below. (b) How much is the net longwave (terrestrial) radiation lost by the atmosphere. (c) How much is the net radiative energy loss/gain in the atmosphere. (d) Is this a net loss or a net gain. (e) what prevents the atmosphere from heating up (cooling down) if you said a gain (loss) in (d) .")
11
10. The highlighted region experiences cold/warm air advection. temperature (C)
")
12
11. Look at the image below. (a) Does this imply that it should be colder/warmer at high latitudes? (b) How is the heat transfer from low to high latitudes accomplished?
 Does this imply that it should be colder/warmer at high latitudes. (b) How is the heat transfer from low to high latitudes accomplished .")
13
12. Explain this paradox: the Earth is closer to the Sun in January than in July, yet it is colder in January in the northern hemisphere. perihelion aphelion

14
13. Laramie vs. Eureka CA (same latitude) a. Which place is wettest in winter? b. Where is the daily temperature range largest? c. Where is the annual temperature range largest? d. Explain (b) and (c).
 and (c)..")
15
14. a. Why are inversions common in during clear, calm nights? b. Why do such inversions tend to be stronger in valleys?

16
15. For the green dot, determine (a) temperature (b) vapor pressure (c) saturation vapor pressure (d) wet-bulb temperature (e) dewpoint please add units to all values
 temperature (b) vapor pressure (c) saturation vapor pressure (d) wet-bulb temperature (e) dewpoint please add units to all values.")
17
16. Cool air at the green dot down to 0°C (a) what is its new relative humidity? (b) what is its new vapor pressure? (c) what is its new dewpoint? please add units to all values
 what is its new vapor pressure. (c) what is its new dewpoint. please add units to all values.")
18
dewpoint 17. Why is it that relative humidity tends to vary in opposition to temperature during the course of a day?

19
18. Imagine you are working out on a hot day. Explain the advantages of (a) staying in the shade, and (b) feeling a breeze.
 staying in the shade, and (b) feeling a breeze..")
20
19. About latent heating in the global energy balance (a)In what direction is latent heat transferred? (up or down) (b)Why is this heat transfer called “latent”? (c)Indicate specifically where the cooling and the warming occur (at the Earth surface, in the clouds, when rain hits the ground …)
In what direction is latent heat transferred. (up or down) (b)Why is this heat transfer called latent . (c)Indicate specifically where the cooling and the warming occur (at the Earth surface, in the clouds, when rain hits the ground …).")
21
20. Note the wiggles in the trend of atmospheric CO 2 concentration. CO 2 peaks in winter (Feb) and is a minimum in summer (Aug). What causes this annual cycle?
 and is a minimum in summer (Aug). What causes this annual cycle .")
22
21. In the past two million years BP, there were several glacial periods, and interglacials (as we experience today). During the glacials, the CO 2 and CH 4 concentrations were much lower than during the interglacials (see below). In fact temperature and greenhouse gases varied in sync. How do we know this? (i.e. how are measurements, such as those shown below, made?)
. During the glacials, the CO 2 and CH 4 concentrations were much lower than during the interglacials (see below). In fact temperature and greenhouse gases varied in sync. How do we know this. (i.e. how are measurements, such as those shown below, made ).")
Similar presentations


 radiation: 1)>")


>")
![1. Here are three maps depicting the current drought in the West. Shown on these maps are …… [choose one] departures from the local climatology; longterm.](/16/5003828/big_thumb.jpg "1. Here are three maps depicting the current drought in the West. Shown on these maps are …… [choose one] departures from the local climatology; longterm.>")


