Download presentation
Presentation is loading. Please wait.

1
Linear Regression with One Regression
Chapter 4 Linear Regression with One Regression

2
Linear Regression with One Regressor (SW Chapter 4)
Linear regression allows us to estimate, and make inferences about, population slope coefficients. Ultimately our aim is to estimate the causal effect on Y of a unit change in X – but for now, just think of the problem of fitting a straight line to data on two variables, Y and X.

3
Confidence intervals:
The problems of statistical inference for linear regression are, at a general level, the same as for estimation of the mean or of the differences between two means. Statistical, or econometric, inference about the slope entails: Estimation: How should we draw a line through the data to estimate the (population) slope (answer: ordinary least squares). What are advantages and disadvantages of OLS? Hypothesis testing: How to test if the slope is zero? Confidence intervals: How to construct a confidence interval for the slope?
 slope (answer: ordinary least squares). What are advantages and disadvantages of OLS Hypothesis testing: How to test if the slope is zero Confidence intervals: How to construct a confidence interval for the slope")
4
Linear Regression: Some Notation and Terminology (SW Section 4.1)
")
5
The Population Linear Regression Model – general notation

6
This terminology in a picture: Observations on Y and X; the population regression line; and the regression error (the “error term”):
:")
7
The Ordinary Least Squares Estimator (SW Section 4.2)
")
8
Mechanics of OLS

9
The OLS estimator solves:

11
Application to the California Test Score – Class Size data

12
Interpretation of the estimated slope and intercept

13
Predicted values & residuals:

14
OLS regression: STATA output

15
Measures of Fit (Section 4.3)
")
17
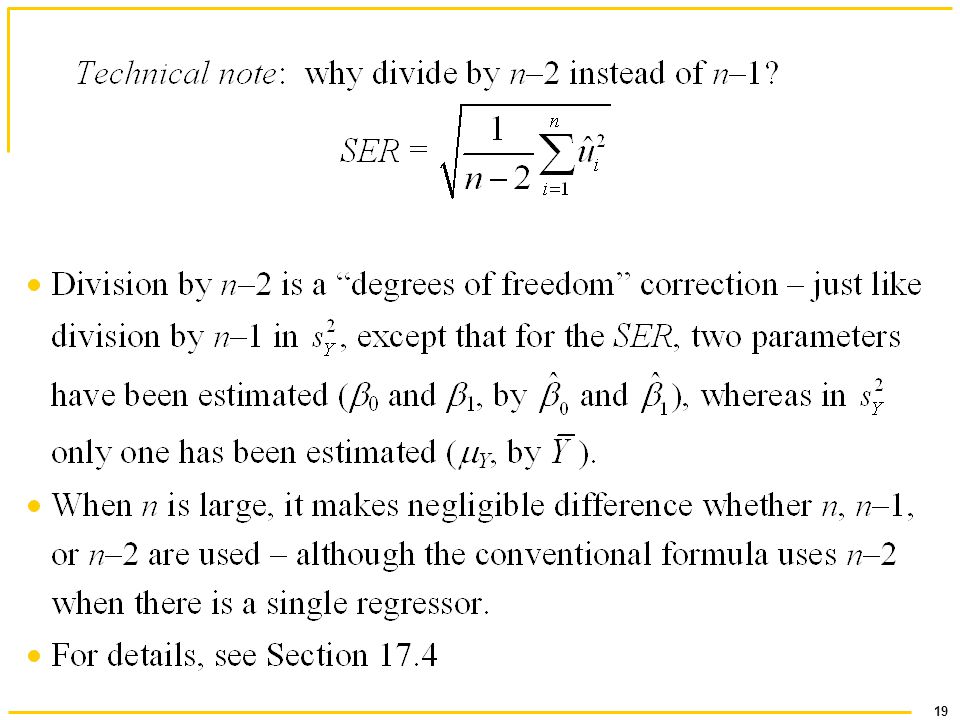
The Standard Error of the Regression (SER)
")
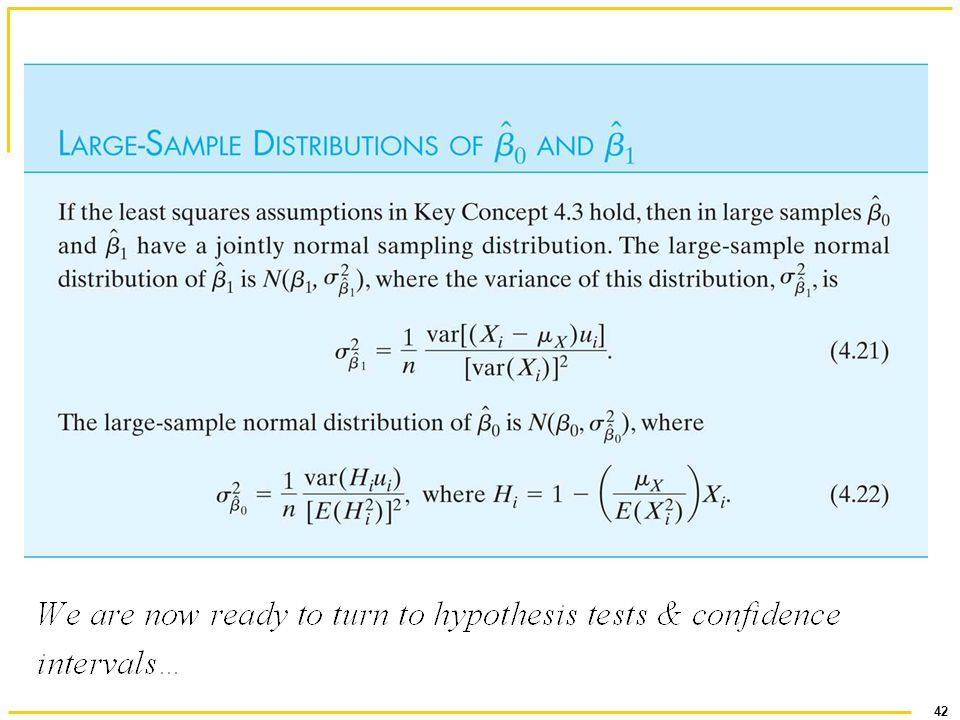
20
Example of the R2 and the SER

21
The Least Squares Assumptions (SW Section 4.4)
")
22
The Least Squares Assumptions

23
Least squares assumption #1: E(u|X = x) = 0.
 = 0.")
24
Least squares assumption #1, ctd.

25
Least squares assumption #2: (Xi,Yi), i = 1,…,n are i.i.d.
, i = 1,…,n are i.i.d.")
26
Least squares assumption #3: Large outliers are rare Technical statement: E(X4) < and E(Y4) <
 < and E(Y4) < ")
27
OLS can be sensitive to an outlier:

28
The Sampling Distribution of the OLS Estimator (SW Section 4.5)
")
29
Probability Framework for Linear Regression

30
The Sampling Distribution of
1 ˆ b

31
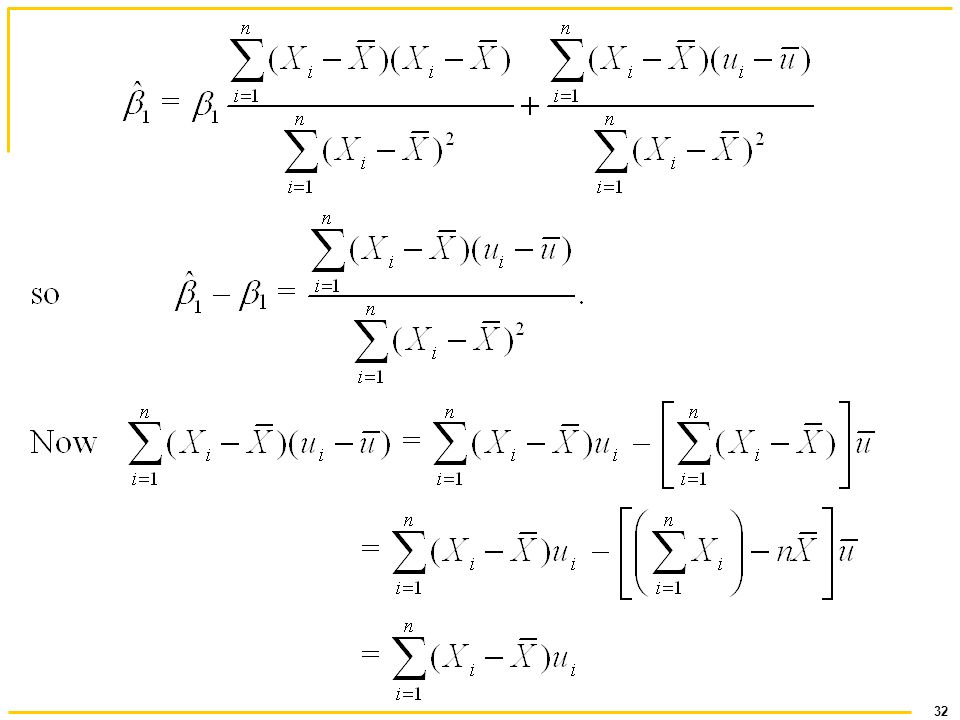
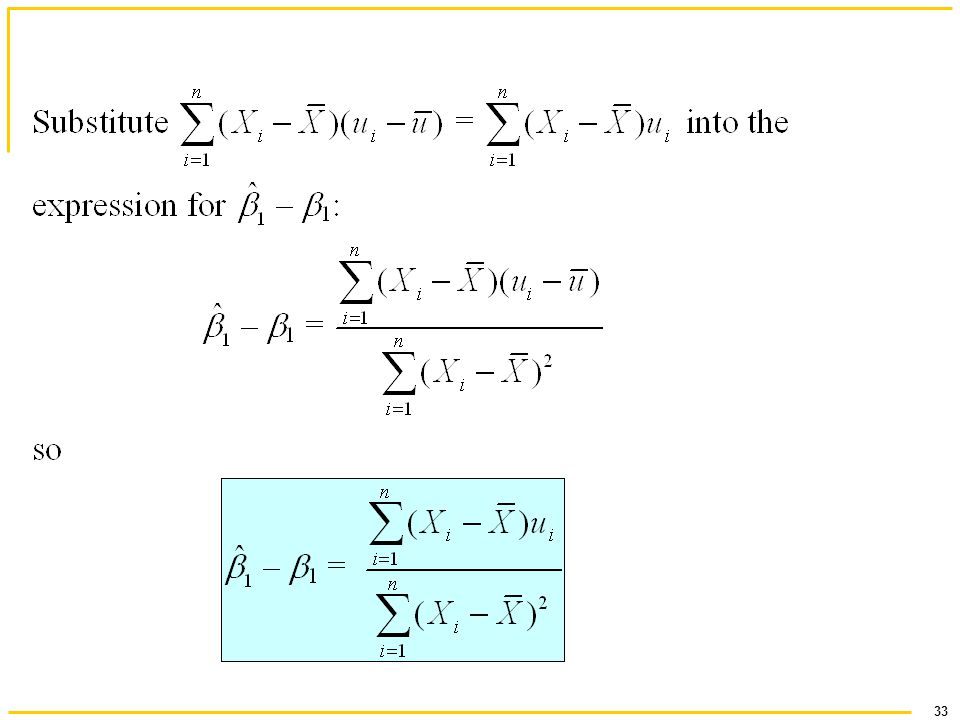
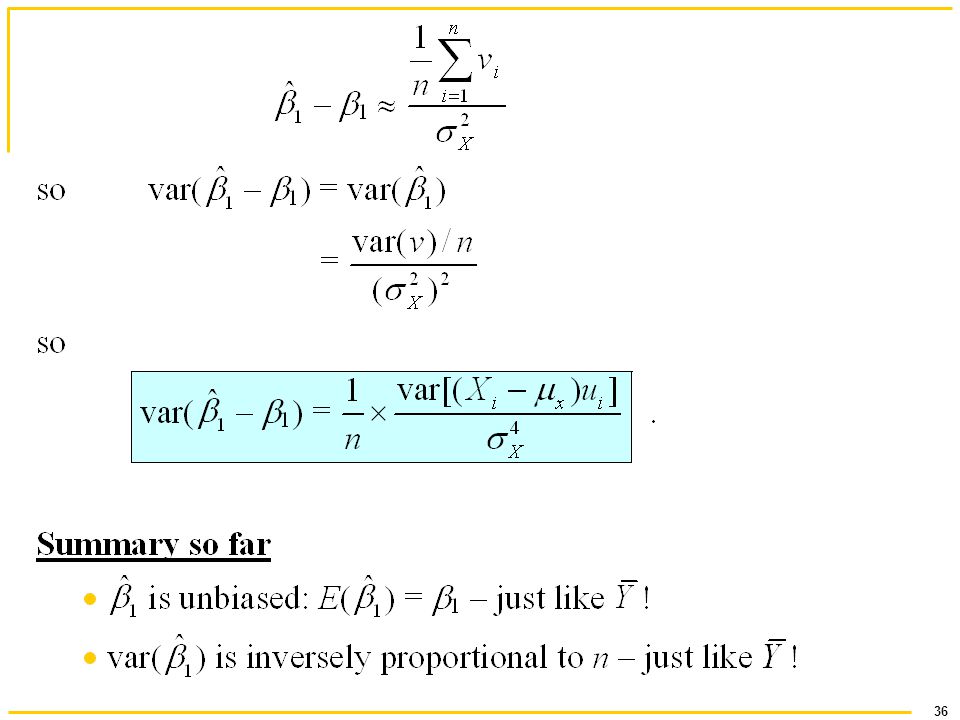
The mean and variance of the sampling distribution of

34
Now we can calculate E( ) and var( ):
 and var( ):")
35
Next calculate var( ):
:")
37
What is the sampling distribution of ?

38
Large-n approximation to the distribution of :

39
The larger the variance of X, the smaller the variance of

40
The larger the variance of X, the smaller the variance of

41
Summary of the sampling distribution of :

Similar presentations


 R2 statistic (Ch. 8.6.2) Association is not causation (Ch. 7.5.3) Next.>")


 –new terms and concepts –assumptions –reading regression computer outputs Correlation.>")


 Data.>")
 Data.>")

 Review>")

