Download presentation
Presentation is loading. Please wait.

1
Cyclone and Frontal Structure and Evolution Professor Cliff Mass Department of Atmospheric Sciences University of Washington

2
For much of the 20 th century the dominant paradigm for cyclone/frontal evolution has been the Norwegian Cyclone Model (Bergen School) Bjernkes, 1919
 Bjernkes, 1919")
3
Concept of Air Flows in Cyclones

4
Concept of Evolutio n of Cyclones Bjerknes and Solberg 1922

5
Stationary Polar Front Wave Forming on Polar Front

6
Occlusion as Cold Front Catches Up to Warm Front Wave Amplifies

7
Occlusion Lengthens and System Weakens

8
Warm and Cold Occlusions

9
Norwegian Cyclone Model (NCM) It was an important and revolutionary advance at the time. First to connect three dimensional trajectories with clouds and precipitation. Still found in many textbooks today Over flat land away from water and terrain, reality often approximates gross characteristics of the NCM. However, there are some major problems with the Norwegian Cyclone model that have been revealed by modern observations and modeling.

10
Some Problems With The Norwegian Cyclone Model Different structures and evolutions of fronts and cyclones often observed over water and over/downstream of mountain barriers. Does not properly consider the role of the middle to upper troposphere. No upper levels fronts. Major deficiencies regarding the occlusion process. Does not properly consider that cyclogenesis and frontogenesis occur simultaneously.

11
Consider one problem area: the occlusion process

12
Classic Idea: Occlusion Type Determined By Temperature Contrast Behind Cold Front and in Front of Warm Front (“the temperature rule”

13
But reality is very different From Stoelinga et al 2002, BAMS

14
Literature Review Schultz and Mass (1993) examined all published cross sections of occluded fronts. Found no relationship between the relative temperatures on either side of the occluded front and the resulting structure. Of 25 cross sections, only three were cold-type occlusions. Of these three, one was a schematic without any actual data, one had a weak warm front, and one could be reanalyzed as a warm-type occlusion Cold-type occlusions appear rare.

15
But what controls the slope? Virtually all fronts are first-order fronts (which the horizontal temperature gradient changes discontinuously with frontal passage) rather than zero-order fronts (where temperature varies discontinuously across the front) Historical note: in the original Norwegian Cyclone Model they suggested all fronts were zero-order fronts.
 rather than zero-order fronts (where temperature varies discontinuously across the front) Historical note: in the original Norwegian Cyclone Model they suggested all fronts were zero-order fronts..")
16
Basic Relationship The relative value of the vertical potential temperature derivative will determine the slope

17
Occluded frontal surfaces generally mark a maximum in potential temperature on a horizontal surface, so the numerator on the right side of (2) is always positive. Therefore, the sign of the slope of the occluded front is determined only by the denominator on the right-hand side of (2), that is, only by the static stability contrast across the front, and not by the contrast in horizontal potential temperature gradient.
, that is, only by the static stability contrast across the front, and not by the contrast in horizontal potential temperature gradient..")
18
An Improved View: The Static Stability Rule of Occluded Front Slope An occluded front slopes over the statically more stable air, not the colder air. – A cold occlusion results when the statically more stable air is behind the cold front. – When the statically more stable air lies ahead of the warm front, a warm occlusion is formed.

19
An Example

20
Another Example

21
According to the Norwegian Cyclone Model Cyclones Begin to Weaken When They Start to Occlude In reality, observations often show that cyclones continue to deepen for many hours after the formation of the occluded front, reaching central pressures many hPa deeper than at the time often occluded-front formation. Example: 29 of the 91 northeast United States cyclones for which surface analyses appear in Volume 2 of Kocin and Uccellini (2004) deepen 8–24 mb during the 12–24 h after formation of the occluded front
 deepen 8–24 mb during the 12–24 h after formation of the occluded front.")
22
Intensification after Occluded Frontogeneis This makes sense since cyclogenesis depends on three-dimensional dynamics and dynamics. Such mechanisms for cyclogenesis can be undertood from quasigeostrophic, Petterssen– Sutcliffe development theory, baroclinic instability ideas, or potential-vorticity.

23
Is Frontal Catch-Up the Essential Characteristic of Occluded Front Development? Not all occluded fronts developed from the cold fronts overtaking warming fronts. Far more fundamental is the distortion of warm and cold air by vortex circulations.

24
Even in a nondivergent barotropic model where “isotherms” are passively advected by the flow, occluded-like warm-air and cold- air tongues can develop

25
Occlusion This gradient in tangential wind speed takes the initially straight isotherms and differentially rotates them. The differential rotation of the isotherms increases the gradient (i.e., frontogenesis) The lengthening and spiraling of the isotherms brings the cold- and warm-air tongues closer
 The lengthening and spiraling of the isotherms brings the cold- and warm-air tongues closer.")
26
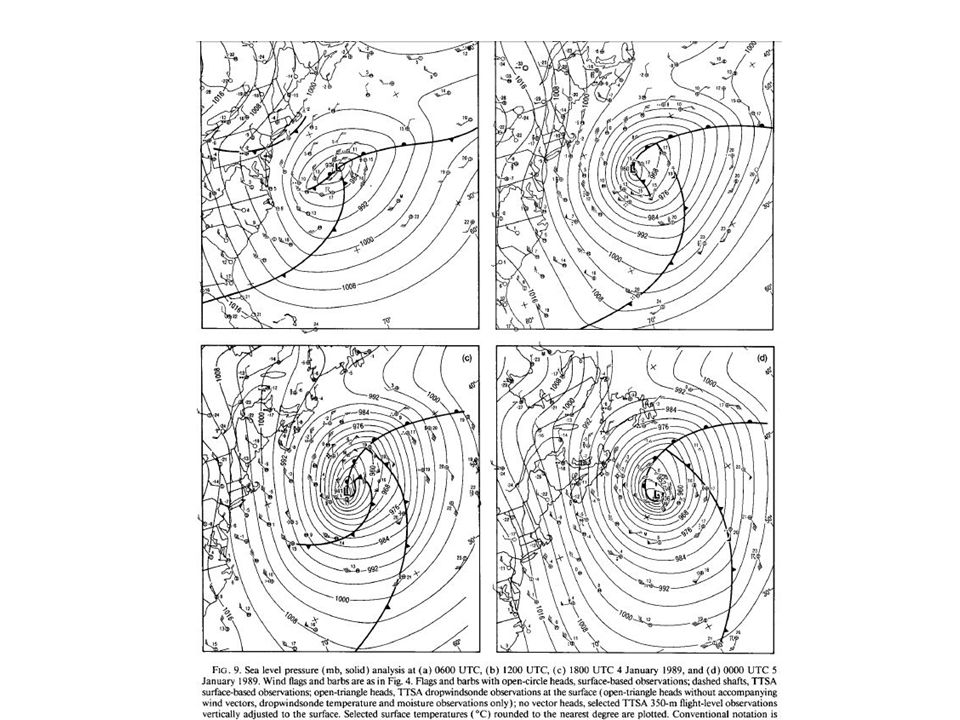
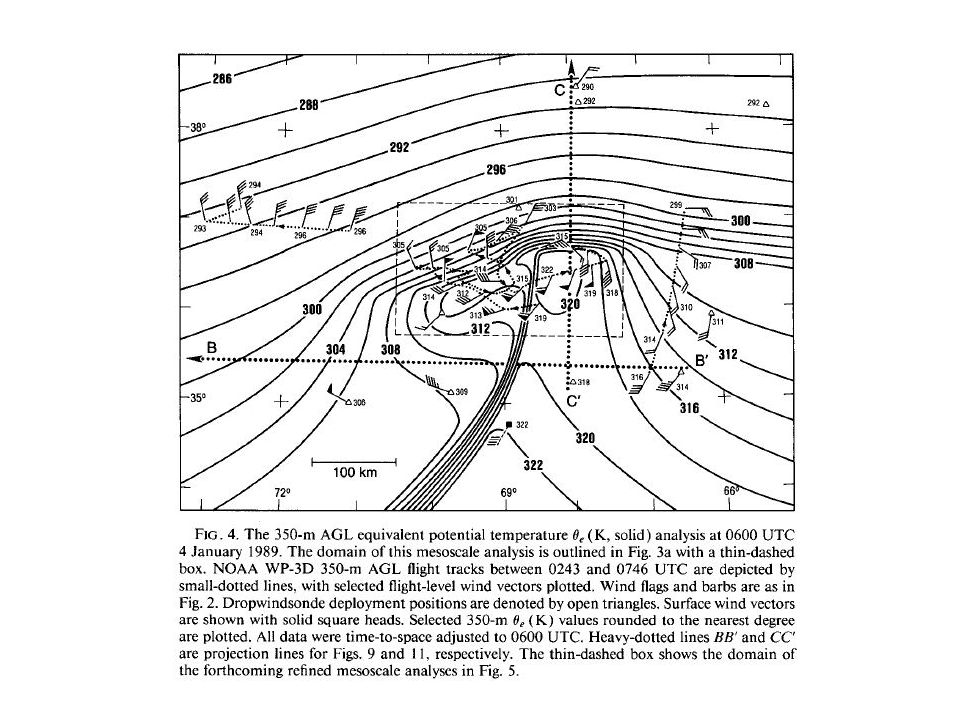
Oceanic Cyclone Structure

27
Shapiro-Keyser Model of Oceanic Cyclones

28
Major Elements of S-K Model Weak cold front Northern part of cold front is very weak (“fractured”) Not much evidence of classis occlusion (well defined tongue of warm air projected to low center). “T-Bone” structure: cold front intersects the warms front at approximately a right angle Strong back bent (or bent back) warm front. Warm air seclusion near the low center.
 warm front. Warm air seclusion near the low center..")
29
Simulation of the QE-II Storm

30
Neiman and Shapiro 1993

32
Air-Sea Interactions Warm the Cold Air, Weakening the Cold Front

34
Cross Section Across Cold Front

35
Cross Section Across Warm Front

37
Warm Seclusion Stage

38
Cross Section Across Warm Front and Associated Low-level Jet

39
Cross Section Across Warm-Air Seclusion: Circulation Weakens With Height

41
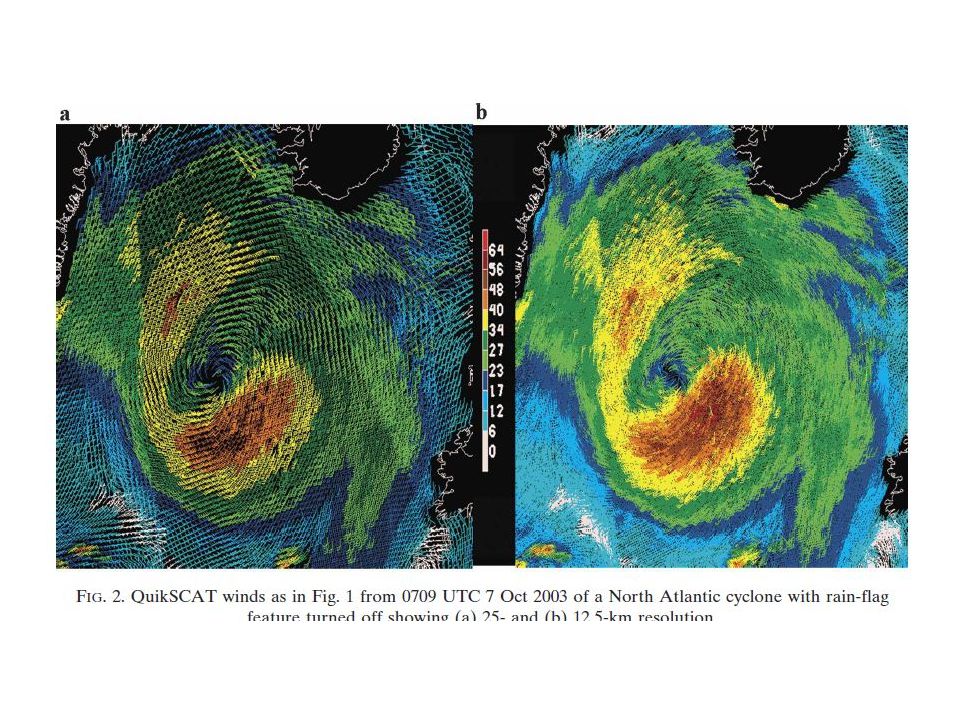
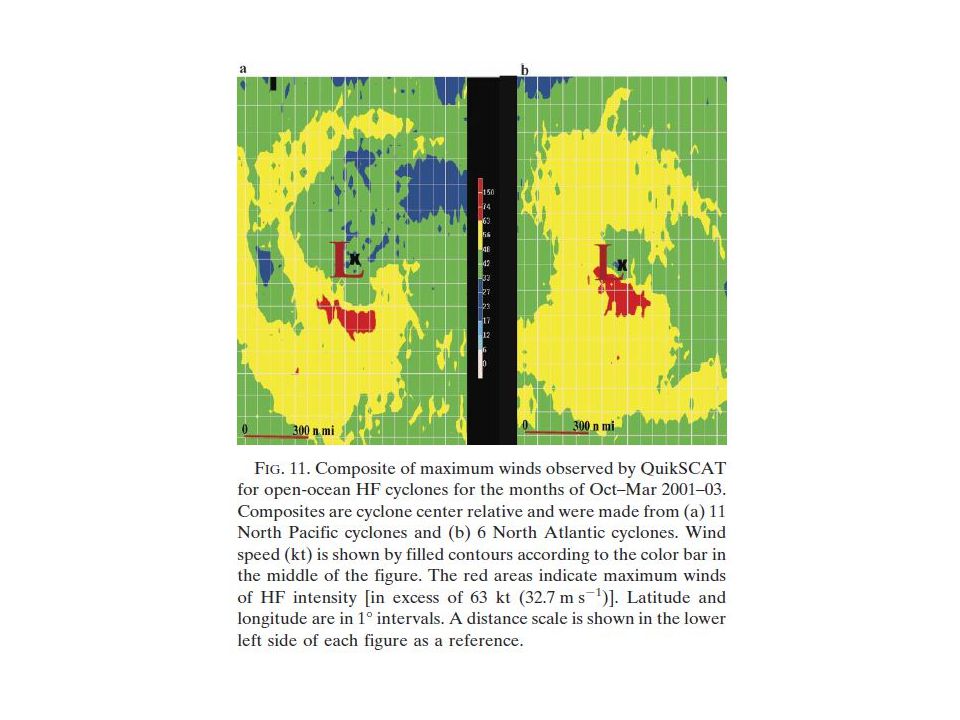
Strongest Winds With Back-Bent Warm Front

44
The Norwegian Cyclone Model Was Developed over the Eastern Atlantic and Europe, Might Development be Different In Other Midlatitude Locations Where the Large Scale Flow is Different?

45
Diffluent Confluent

47
Diffluent

48
There is considerable literature demonstrating different cyclone- frontal evolutions in differing synoptic environments.

49
Confluent versus diffluent synoptic flow The Norwegian Cyclone model was developed in a region of generally diffluent flow (eastern Atlantic and Europe). How does confluent and diffluent flow influence evolution?

50
Add a vortex to various synoptic flows and simulate the thermal evolution

51
Just Vortex

52
Confluence-Like Western Side of Oceans

53
Looks Like Shapiro-Keyser Model of Oceanic Cyclones S-K developed over western oceans during the Erica field experiment. Fractured cold front, strong bent-back warm/occluded front.

54
Summary

55
Diffluent Flow

56
Confluent Flow Strong cold front and weaker warm front Resembles Norwegian Cyclone Model (NCM) NCM devised over a region of confluent flow.
 NCM devised over a region of confluent flow.")
57
Summary

58
LC1 and LC2 Cyclone Evolutions: The Influence of Changing the Horizontal Shear Across the Midlatitude Jet

59
Primitive Equation Model Run with Two Shear Profiles LC1 LC2

60
LC1

61
LC2

62
LC1 and LC2 Cyclone Evolutions The LC1 is more comparable to the Norwegian lifecycle with strong temperature gradients in the cold frontal region. The cold front eventually pinches off the warm sector, which decreases in area reminiscent of a Norwegian occlusion. In LC2 one sees the effects of stronger cyclonic mean shear. The strongest temperature gradients in the warm frontal zone with warm-core seclusion occurs as baroclinicity associated with the extended bent- back warm front encircles the low-pressure center.

63
Major Mountain Barriers and Land/Water Configurations Can Have a Large Impact on Cyclone and Frontal Structures

64
How Does Different Drag Between Ocean and Land Change Cyclone and Frontal Structures?

65
Adiabatic, Primitive Equation Model

66
Ocean DragLand Drag

67
The Impact of Mountains Barriers on Cyclone Structure Major topographic barriers can have a profound influence on cyclone and frontal structure. Barriers destroy low level front structures, weaken cyclone circulations, create new structures (e.g., lee troughs and windward ridges), and restricts the motions of cold and warm air.
, and restricts the motions of cold and warm air..")
68
Question: What Does China and the U.S. have in common with respect to topographic influence?

70
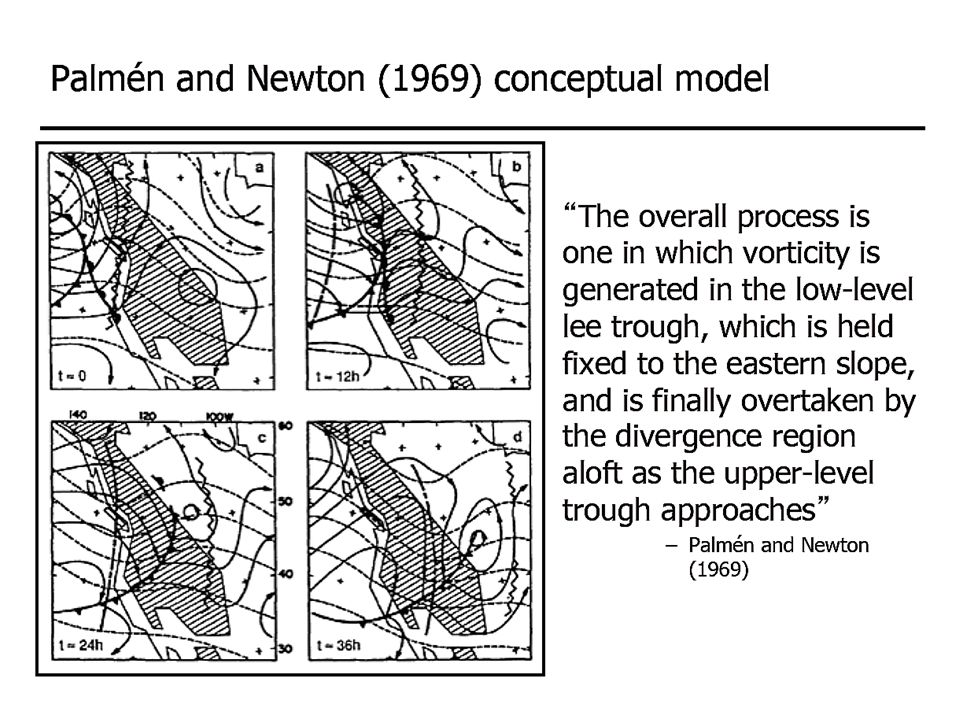
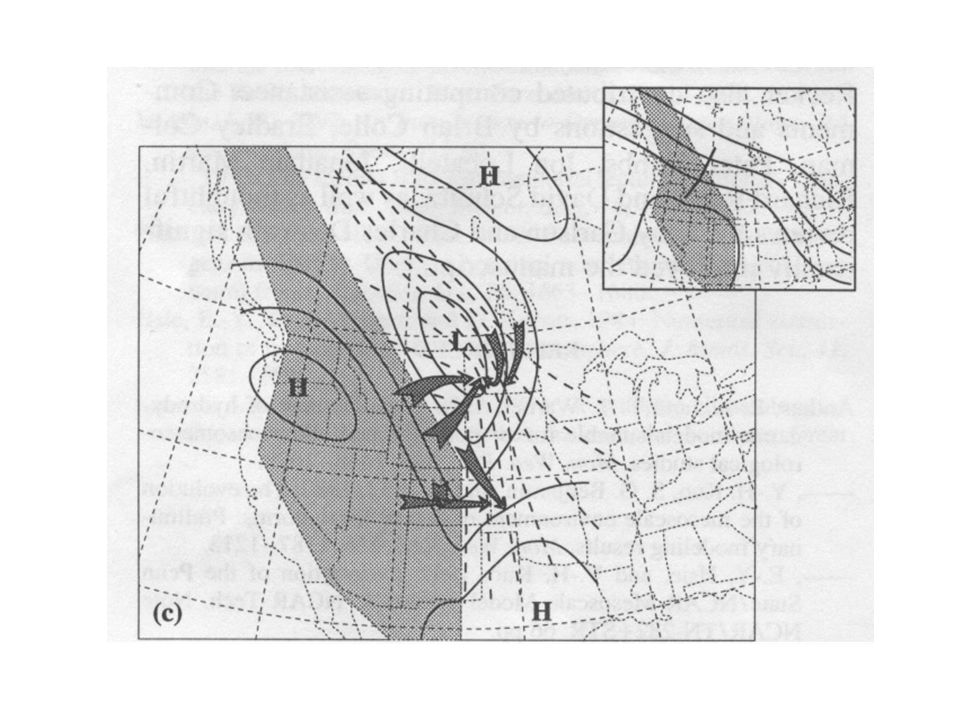
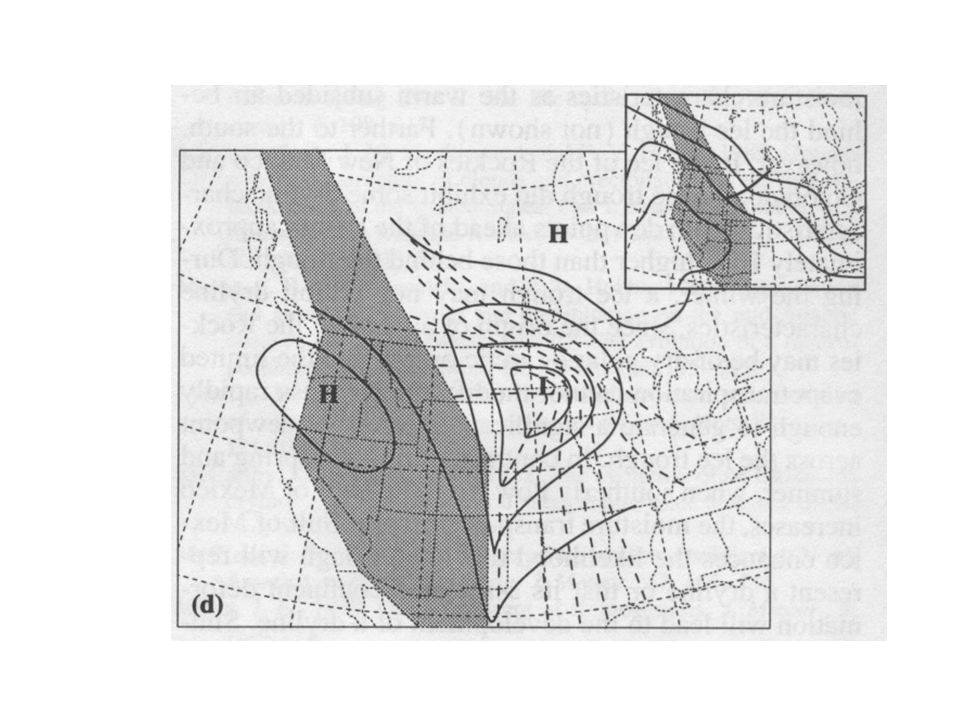
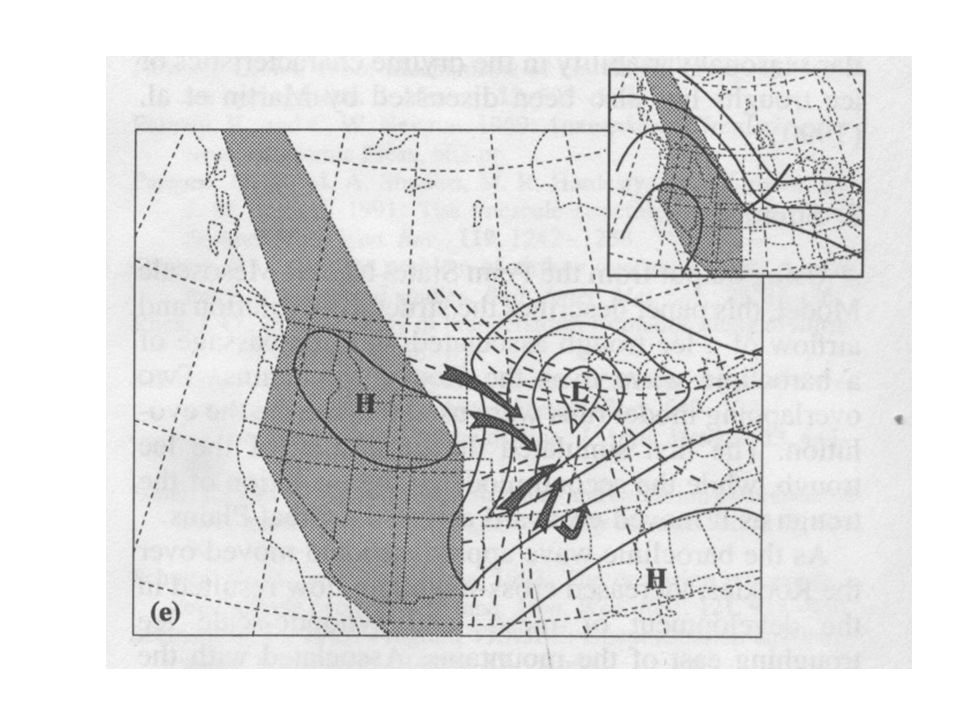
Consider the U.S. Impacts When flow is relatively zonal synoptic structures are greatly changed over and downstream of the Rockies. Takes roughly 1000 km for structures to appear more “classical” Classic reference: Palmen and Newton (1969)
.")
72
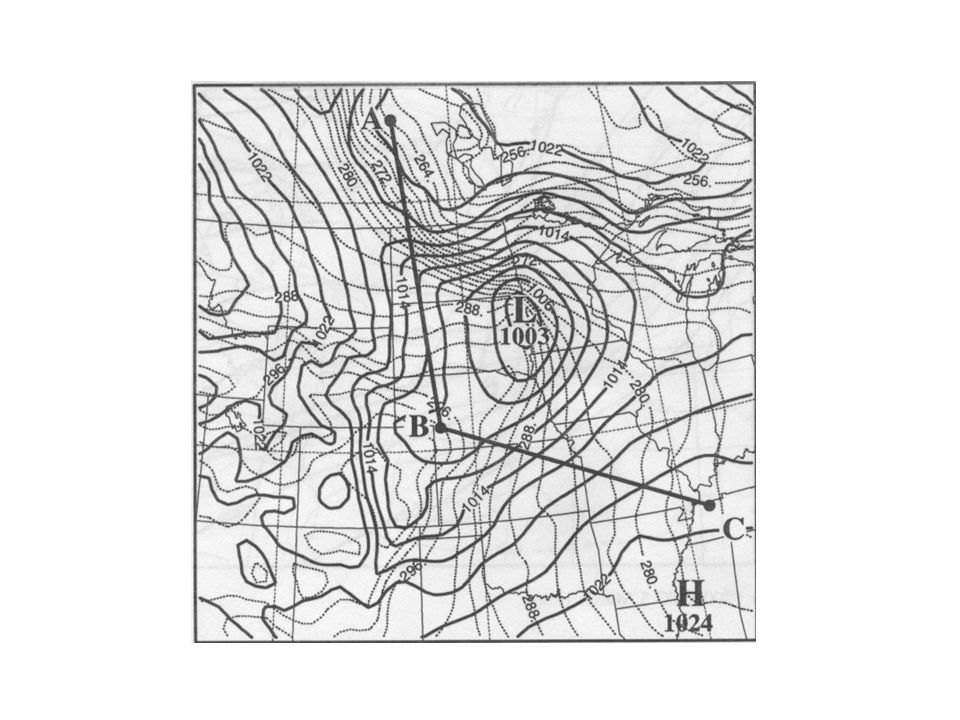
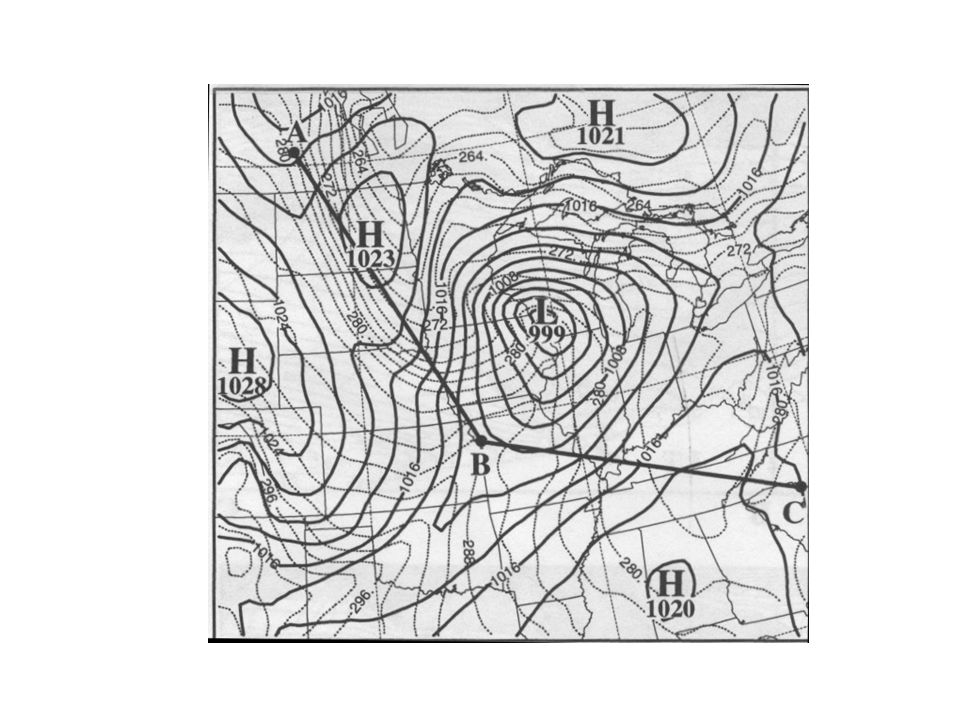
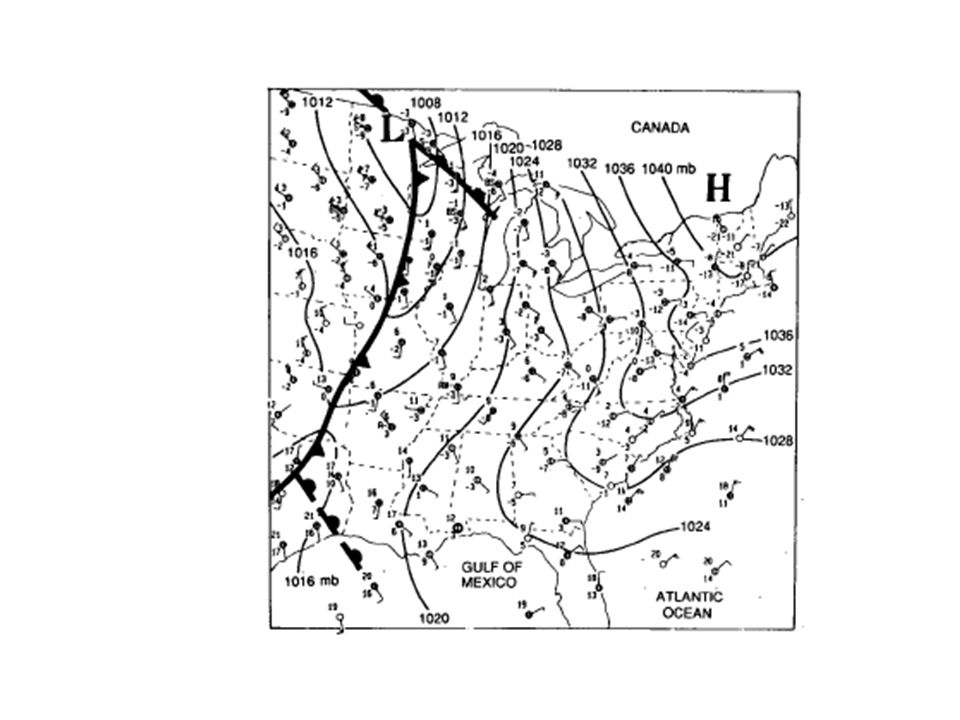
Steenburgh and Mass (Mon. Wea. Rev., 1994) Detailed modeling study of the cyclone/frontal development east of the Rockies.
 Detailed modeling study of the cyclone/frontal development east of the Rockies..")
76
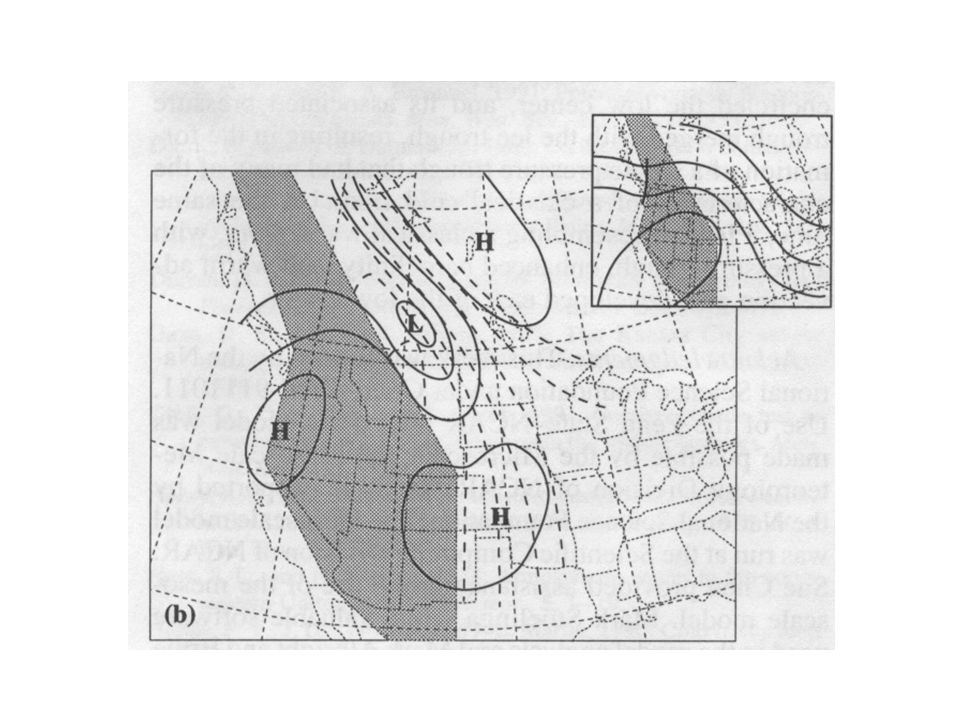
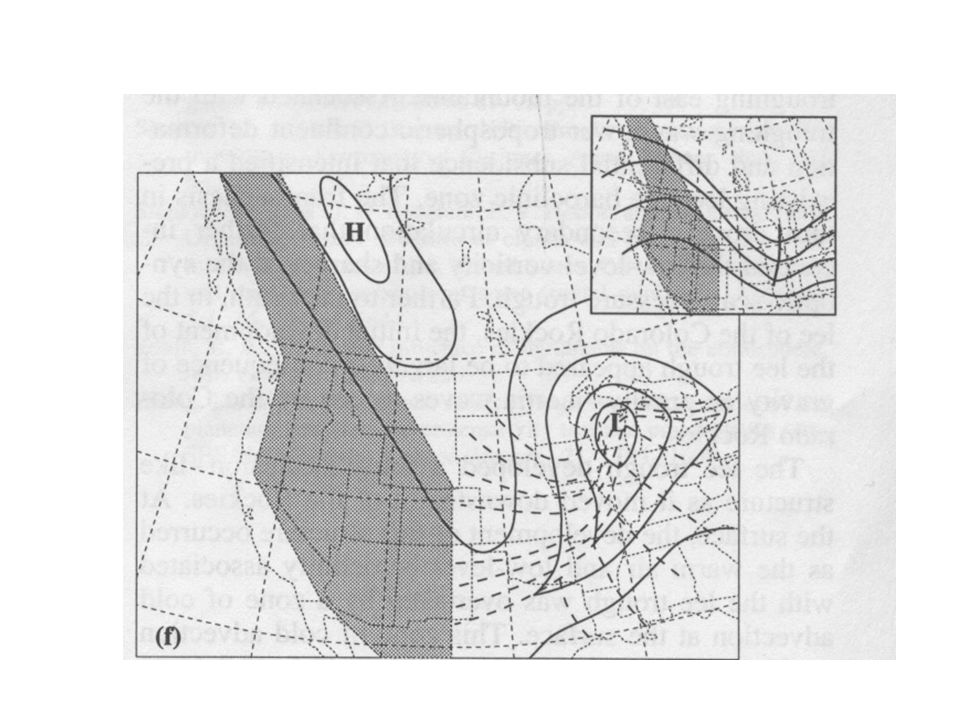
Conceptual Model

83
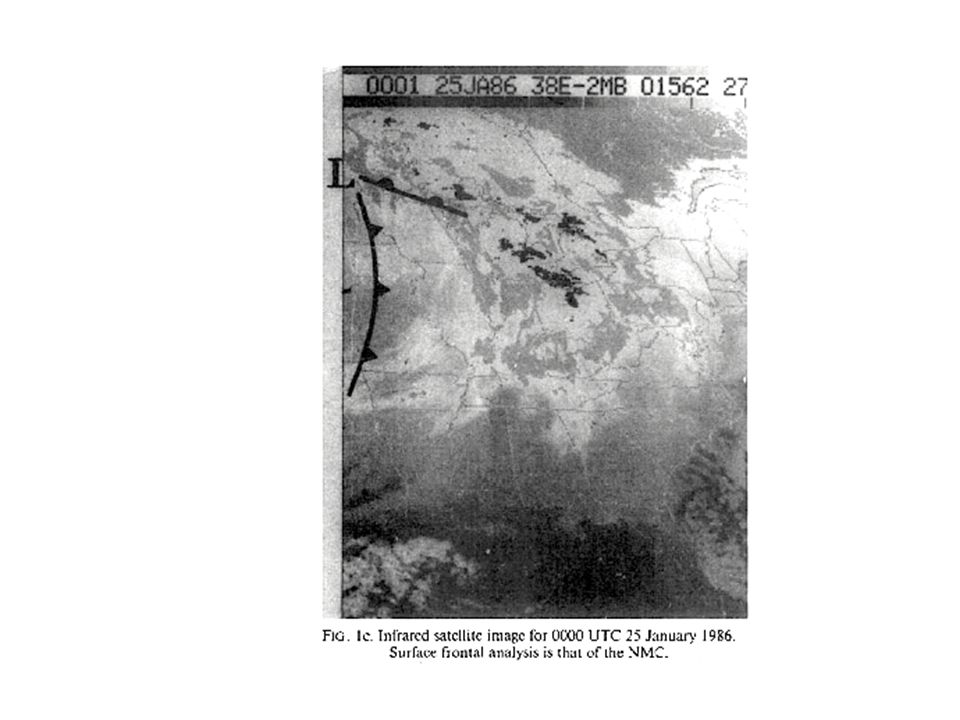
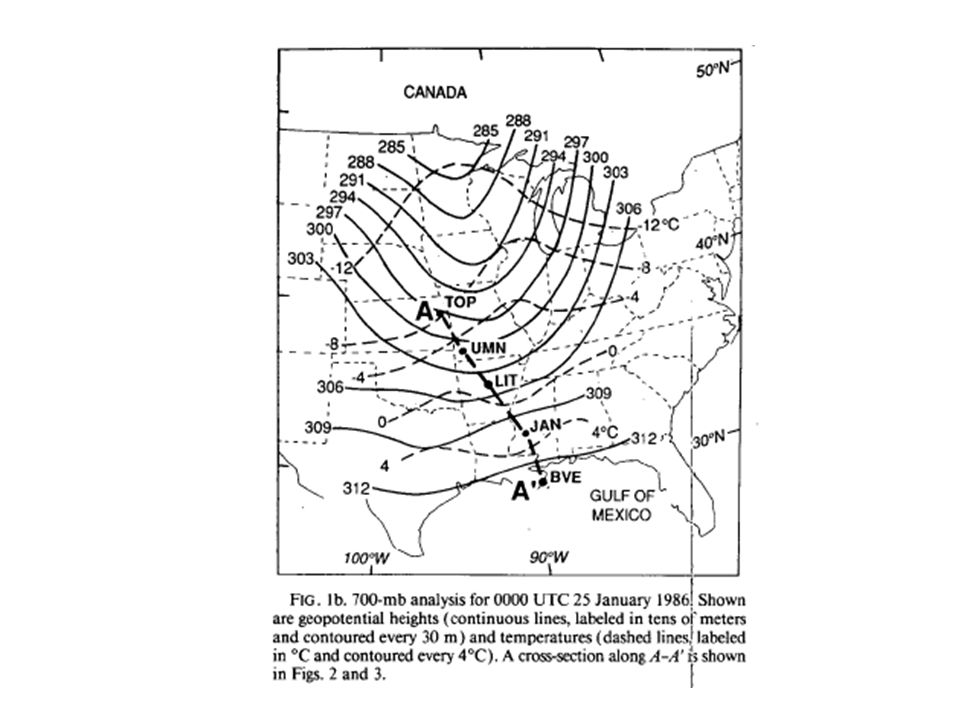
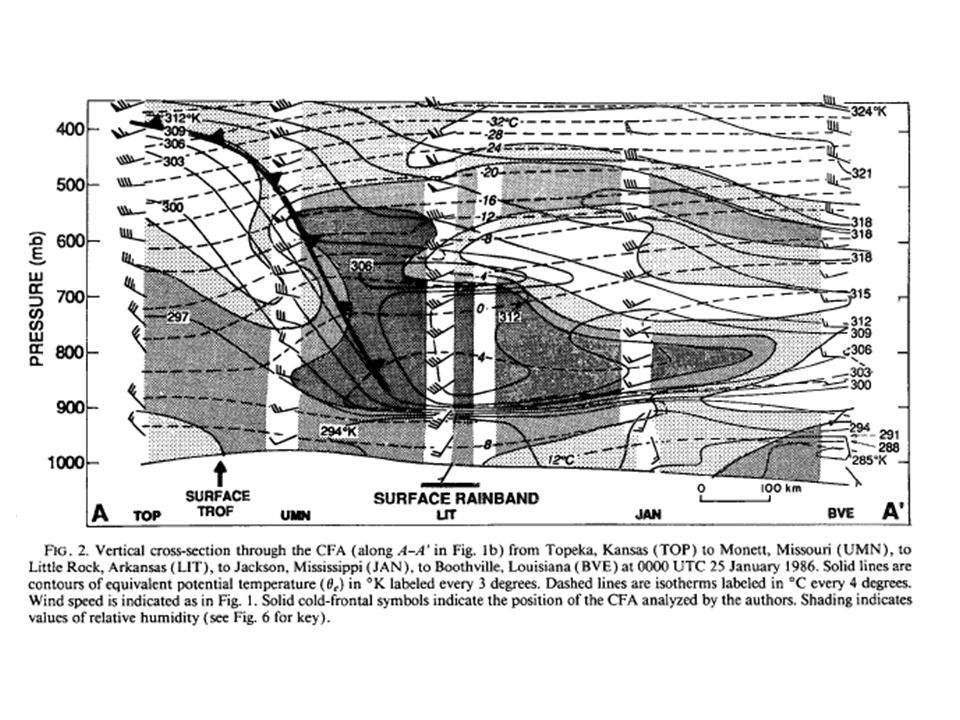
Cold Fronts Aloft And Forward Tilting Frontal Zones

89
Dry Lines or

90
Dry Lines Associated with large horizontal gradients in moisture, but not necessarily temperature. Results from the interaction of cyclones and fronts with large-scale terrain. Found over the U.S. Midwest, northern India, China, central West Africa and other locations. Acts as a focus for convection, and particularly severe convection. Most prevalent during spring/early summer in U.S.

91
Dry Line Surface boundary between warm, moist air and hot, dry air. Surface dry line Inversion or cap Well-mixed warm air

92
Typical Dryline Temperatures in degrees Celsius ©1993 Oxford University Press -- From: Bluestein, Synoptic-Dynamic Meteorology in Midlatitudes, Volume II

93
Southern Plains Dry Line Temperatures in degrees Celsius ©1993 Oxford University Press -- From: Bluestein, Synoptic-Dynamic Meteorology in Midlatitudes, Volume II Dry Line

94
Trajectories Fundamentally the dry line represents a trajectory discontinuity between moist southerly flow and flow descending from higher elevations. Can only happen relatively close to the upstream barrier (no more than 1000 km) since otherwise air would swing southward behind the low system and thus would be cool and somewhat moist.
 since otherwise air would swing southward behind the low system and thus would be cool and somewhat moist..")
95
L DRY LINE Warm, Moist

96
L NO DRY LINE— Get Cold Front

97
Indian Dryline

99
Dew Point Gradients Associated with Indian Dry Line

100
Dry Line: Tends to Move Eastward During the Day and Westward At Night After sunrise, the sun will warm the surface which will warm the air near the ground. This air will mix with the air above the ground. Since the air above the moist layer is dry (and is much larger than the moist layer), the mixed air will dry out. The dry line boundary will progress toward the deeper moisture.
, the mixed air will dry out. The dry line boundary will progress toward the deeper moisture..")
101
Dry Line Warm, Moist Air Hot, Dry Air—Usually Well Mixed Top of moist layer before mixing Boundary after mixing Initial Position of the Dry Line Position of the Dry Line after mixing

102
Dry Line After sunset, a nocturnal inversion forms and the winds in the moist air respond to surface pressure features. The dry line may progress back toward the west.

103
WestEast Note weak inversion or “cap” over low-level moist layer east of the surface dry line

104
Sounding West of the Dryline NCAR Very Dry West Winds Albuquerque, NM 12Z -- 26 June 1998

105
Sounding East of the Dryline NCAR Moist South Winds Oklahoma City, OK 12Z -- 26 June 1998

106
Aircraft Study of the Dry Line

107
Convection Tends to Focus On the Dryline

108
Simulation of a Thunderstorm Initiation Along Dryline in TX Panhandle Storm Note converging winds and rising motion

109
Storm Initiation Along a Dry Line

110
Why is a dry line conducive for strong convection? Low level confluence and convergence produce upward motion. The cap allows the build-up of large values of Convective Available Potential Energy (CAPE) East of the surface dry line, the existence of a layer of dry air over moist air enhances convective/potential instability.
 East of the surface dry line, the existence of a layer of dry air over moist air enhances convective/potential instability..")
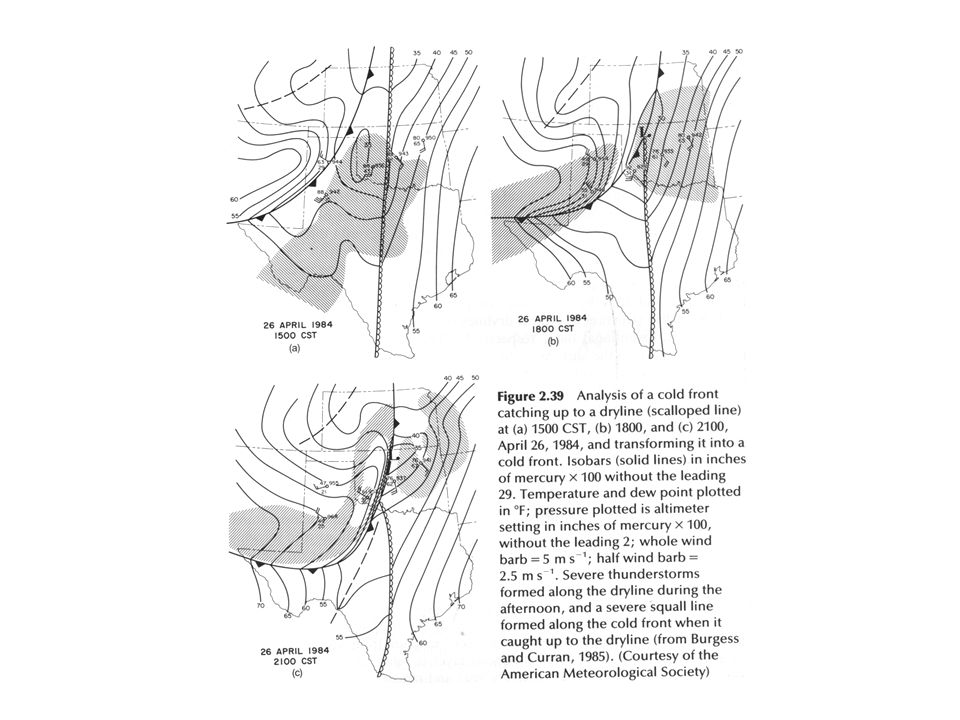
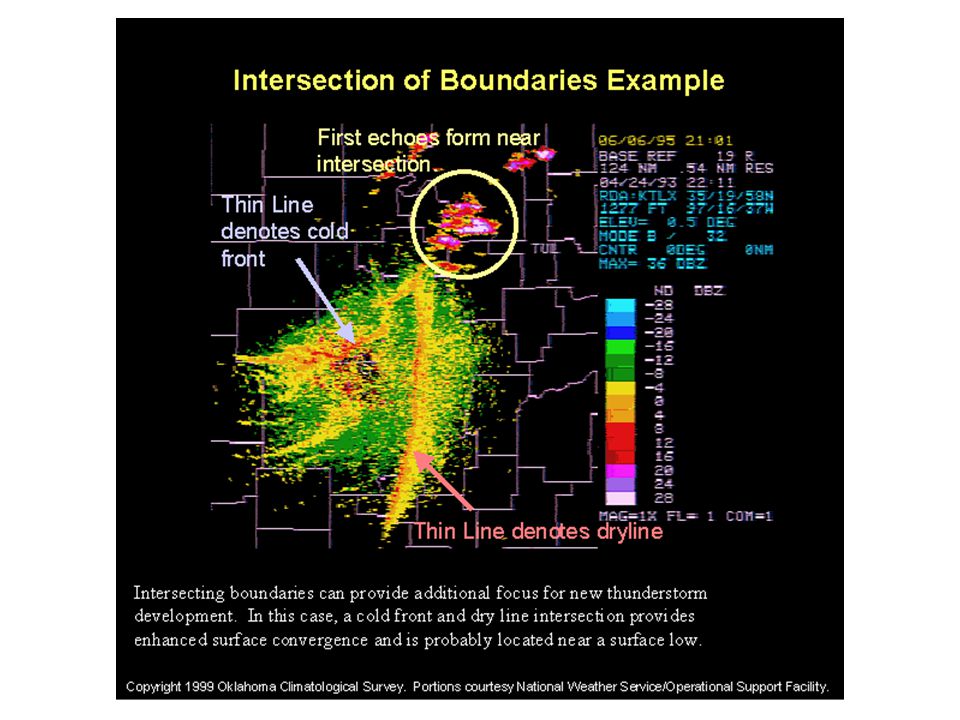
111
Greatest Potential for Convective Development Exists at the Intersection between the Dry Line and Approaching Cold Front

Similar presentations


 in the tropics Air cools and sinks in the subtropics (deserts) Poleward-flow is deflected.>")


 John R. Gyakum.>")