Download presentation
Presentation is loading. Please wait.

1
Chapter 1 Ways of Seeing

2
Ways of Seeing the Atmosphere The behavior of the atmosphere is very complex. Different ways of displaying the characteristics of the atmosphere and its behavior helps us see a complex situation in its more simpler aspects. We will review 7 fundamentally different ways of seeing the atmosphere as used today by meteorologists.

3
Graphs In meteorology, graphs typically display some atmospheric parameter as a function of one of the four dimensions (x, y, z, time). (1) Meteogram displays parameters as a function of time. –A common graph used to display observations at a location over time, or forecasts at a location over future time.
 Meteogram displays parameters as a function of time. –A common graph used to display observations at a location over time, or forecasts at a location over future time..")
4
Notice pressure peaks at 16:00 GMT. Also, secondary peak at ~04:00 GMT. About 12 hours apart. Due to semi-diurnal tide in atmosphere - heating by Sun and cooling at night. Wind Speed/Gusts/Dir Mentions wind direction shifting from 360 o to 0 o. Is this a truly significant wind shift? What about shifting from 360 o to 180 o

5
(2) Sounding Diagram (Thermodynamic Diagram) –Represents characteristics of atmosphere (pressure, temperature, moisture) vertically through the troposphere above a particular location. –Depiction is opposite to a normal graph: the independent axis is the vertical axis and the dependent axis is the horizontal axis. –On this particular diagram, the temperature lines are skewed to the right.

6
Will cover in more detail later. Winds at various levels are plotted along the right. Diagram to upper left is a hodogram, showing behavior of balloon moving with the wind.

7
(3) Isopleths - (An analysis) –Show a parameter as a function of two dimensions, usually x and y. –Help to delineate the field of a particular parameter being analyzed. –Each line represents a particular value of that parameter. –Aids in determining parameter values between the isopleth lines. –Often, the measured (or calculated) values
 values.")
8
Both maps are for the same time using the same data. Values between isopleth lines can be determined by estimation. The color filled map aids in showing regions of maximum and minimum values.

9
To estimate, do a linear interpolation, - divide the space between the isopleth lines into an equal number of subsegments.

10
(4) Plotted Data –Plotting data on an observational map is usually the first step before an analysis (drawing isopleths) is done. –The user can see the data. –The data may contain errors since measurements may contain errors, errors resulting from transmission of data, errors from plotting data. –Some maps may contain only one parameter, others may contain several.

11
–There is a standard format for plotting surface and upper-air observational data.

12
Example Single Parameter map. –May be preferable when observations are insufficient to indicate the proper shape of the contours. –May be preferable when the parameter does not smoothly transition between isopleth values; e.g., rain showers.

13
(5) Images Typically used for Radar and Satellite data. Two-dimensional (x, y) plots. Satellite data resolution (~1 km) much closer than surface observations. Images may be colorized and give a depiction much like an color-filled, analyzed map.
 plots. Satellite data resolution (~1 km) much closer than surface observations. Images may be colorized and give a depiction much like an color-filled, analyzed map..")
14
–Satellite images are typically: Visible Satellite Image Infrared Satellite Images Water Vapor Images Other data: -Temperature profiles. - Moisture profiles. -Wind direction and speed.

15
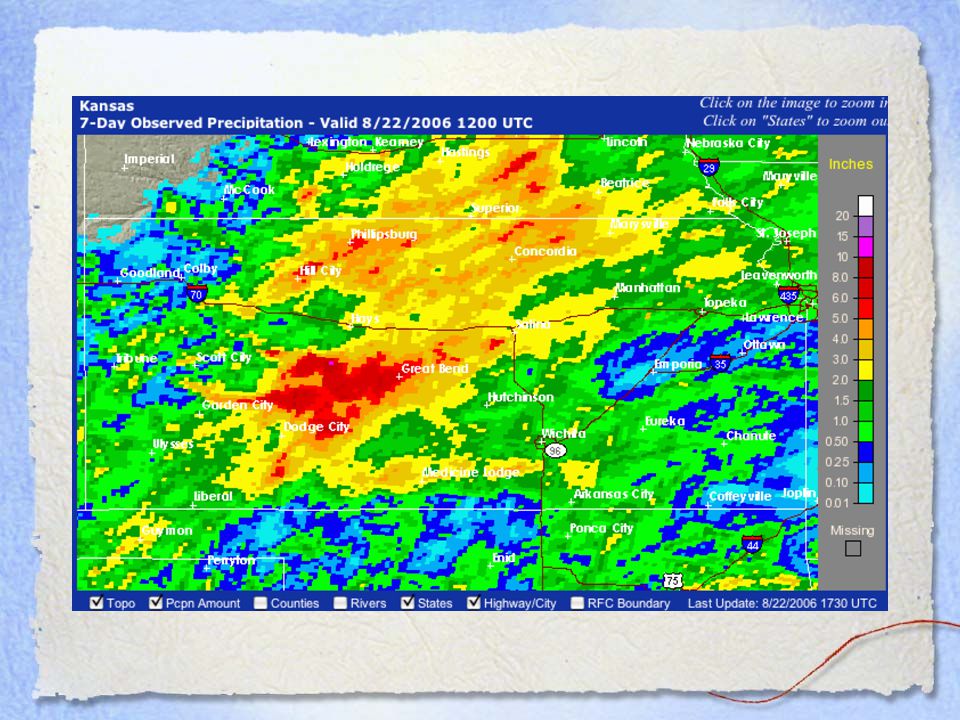
–Radar Images Provide very detailed information on precipitation, more than can be obtained from point-source measurements. May contain “noise.” Return from non- precipitation objects; insects, birds. Radar measures the intensity of the returning radar signal. Then uses an algorithm to determine precipitation. Display is very similar to a color-filled analysis. Sometimes, if you are only interested in the large scale phenomena, too much detail can be a hindrance.

17
(6) Visualizations –Representations of data that retain visual cues for the three-dimensional variation of the data field. –Animations. –RUC maps.

18
(7) Equations –An equation describes how, in a mathematically precise way, different parameters relate to each other. –In meteorology, they represent the behavior of the atmosphere. –Equations are timeless. It applies at any time and at any given point in the atmosphere. –One should learn to visualize the equation expressing how the atmosphere behaves and the relationship between the elements of the equation. –With an analysis (which shows the state of the atmosphere at a particular time) and a proper equation, one has a way of predicting the state of the atmosphere at a future time.
 and a proper equation, one has a way of predicting the state of the atmosphere at a future time..")
20
(8) Conceptual Model –Helps meteorologist understand a complex, 3- dimensional atmosphere and how it evolves by simple models - even though the model is a generalization. Mid-latitude cyclones with attendant fronts. 3-Cell model of the atmosphere. –A meteorologist can take the current weather situation and fits well-understood weather systems to it. Recognizing that the model will not be an exact representation of the current weather situation.

21
–Ultimately, learning about the atmosphere largely consists of conceptual model building. –If a conceptual model does not apply exactly, the forecaster should know how those differences between the conceptual model and the real atmosphere will affect what the atmosphere does. –Analog forecasting is an example of using a conceptual model to forecast.

22
Chapter 1 Questions –Do: 1, 2, 3, 5, 6.

Similar presentations


>")


