Download presentation
Presentation is loading. Please wait.

1
Modelling the conception to first birthday mortality curve Dr Paul Williamson & Prof. Bob Woods Department of Geography Workshop on Fetal and Infant Survival

2
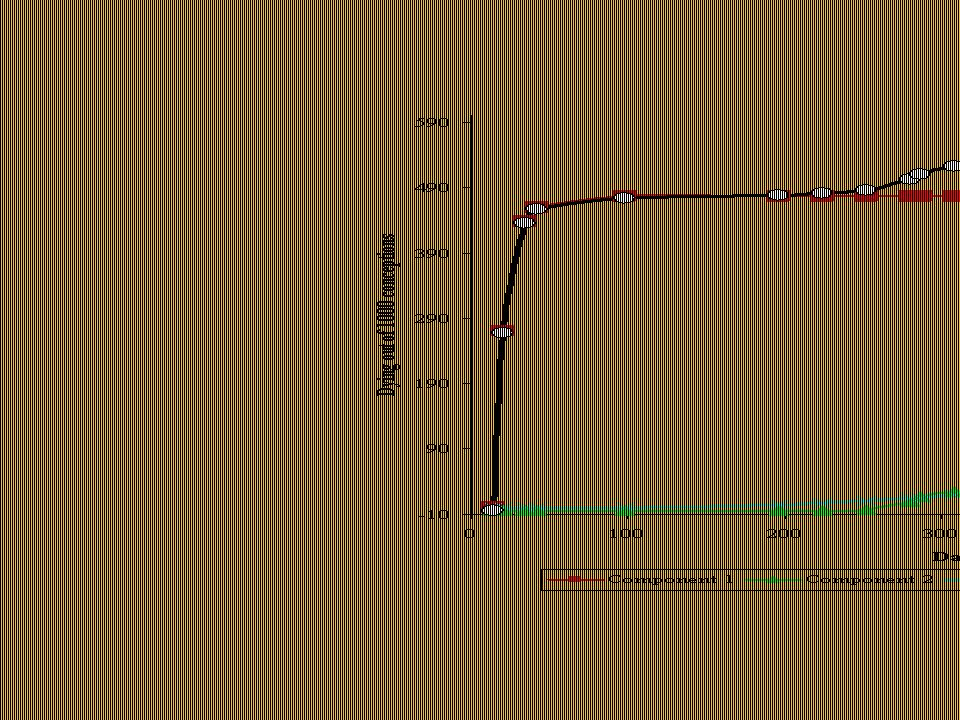
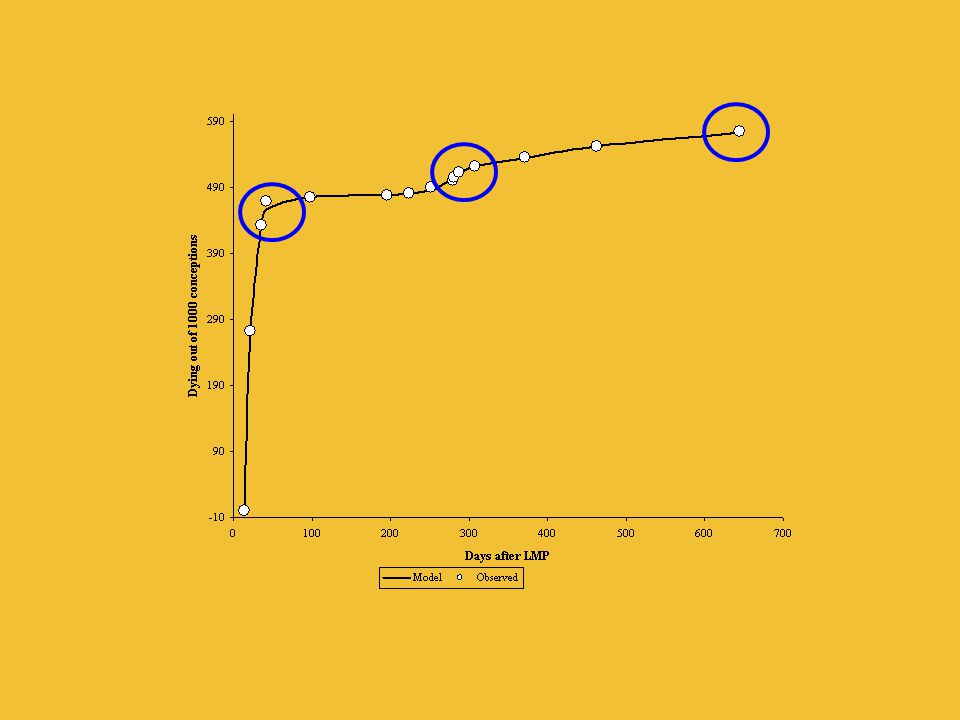
0 100 200 300 400 500 600 0200400600 Days after LMP Dying out of 1000 conceptions 450 475 500 525 550 575 600 Dying out of 1000 conceptions

3
Embryo: 14-41 days after LMPEarly fetal: 42-195 days after LMPLate fetal (stillbirths): 196-279 days after LMPEarly neonatal: 280-286 days after LMPLate neonatal: 287-307 days after LMPPost neonatal: 308-644 days after LMP
: days after LMPEarly neonatal: days after LMPLate neonatal: days after LMPPost neonatal: days after LMP")
6
Where y^ = predicted fetal-infant loss per 1000 conceptions x = days after LMP y o = 473.3523x o = 280 A = -2549.0207B = 0.1197C = 28.9374D = 6.8747 E = 1.1418F = 84.4912G = 154.719H = 11.1787

7
a) Component 1embryonic and early fetal loss [14-196 days after LMP] [Exponential growth curve]
![a) Component 1embryonic and early fetal loss [ days after LMP] [Exponential growth curve]](http://images.slideplayer.com/16/4976765/slides/slide_7.jpg "a) Component 1embryonic and early fetal loss [ days after LMP] [Exponential growth curve]")
8
b) Component 2late fetal and neonatal [196-308 days after LMP] [Aysmmetrical sigmoidal (4 params.)]
![b) Component 2late fetal and neonatal [ days after LMP] [Aysmmetrical sigmoidal (4 params.)]](http://images.slideplayer.com/16/4976765/slides/slide_8.jpg "b) Component 2late fetal and neonatal [ days after LMP] [Aysmmetrical sigmoidal (4 params.)]")
9
c) Component 3 post-neonatal [308-644 days after LMP] [Asymmetrical sigmoidal (3 params.)]
![c) Component 3 post-neonatal [ days after LMP] [Asymmetrical sigmoidal (3 params.)]](http://images.slideplayer.com/16/4976765/slides/slide_9.jpg "c) Component 3 post-neonatal [ days after LMP] [Asymmetrical sigmoidal (3 params.)]")
Similar presentations


 0 = 1 A = 1x0 + 1 = 1.>")


, PHE.>")
 that live in the same place at the same time and compete for the same resources. Resources.>")


 TUTORIAL Community Medicine.>")


