Download presentation
Presentation is loading. Please wait.

1
By Dr. Sarika Phadke-Kelkar National Chemical Laboratory 24-March-2011
Solar Powered Hydrogen Generation: Systems, Materials and Performance By Dr. Sarika Phadke-Kelkar National Chemical Laboratory 24-March-2011

2
Outline Energy Crisis Alternative Fuels Hydrogen as fuel
Hydrogen production from water using solar energy Photo-chemical decomposition of water Photo-electro-chemical water splitting Materials: Selection criteria, important candidates Current Status & Future Trend So that brings us to the outline of my talk……. I am mainly going to focus on two photovoltaic applications…..both are photoelectrochemical applications……first is DSSC and the second is PEC h2 generation… We will see what metal oxides are currently explored for these applications and their properties are being tuned for performance improvement… Recently there has been a lot of interest in the multicomponent binary oxides OR ternary oxide….such as ZnSnO4, cadmium stannet, etc….these metal oxides have already shown good potential as transparent conducting oxides and Towards the end we will see what are the future trends in this area…especially in DSSC….there is a big push to make flexible DSSC devices in order to make them more light, less expensive and be applicable on curved surfaces……….but this imposes new challenges on the metal oxide coating present in the DSSC device…..so we will how these issues could be handled……….

3
This slide shows you a satellite image of the world at night…
This slide shows you a satellite image of the world at night…..and as you can see here, north east America, Europe, India, China, japan…..these are the countries which are most lit and this of course tells than these are the zones which have highest industrialization and highest CO2 emissions………..and we have already started experiencing the bad side effects of all this……with global warming and….changing weather patterns and all…….. But the important thing to note is, all this technology and industrialization has become a part of our life………and in order to progress further we do need all this. and we will continue to need this all more and more………and at the heart of all this is the energy or electricity……..which we will need more and more as we progress……but how we obtain this energy is the real question……because the fossil fuel stocks are scarce so unless we draw this enrgy from a sustainable/renewble source, we will not be able to survive.

5
Historical and Projected Variations in Earth’s
Surface Temperature IPCC Reports Years

6
Energy Demand in present and near future
* Present : 12.8 TW 2050년 : TW * Needs at least 16 TW Bio : 2 TW Wind : 2 TW Atomic : 8 TW (8000 power plant) Fossil : 2 TW * Solar: 160,000 TW 2010 2020 Therefore Energy generation is one of the most important issue to address for scientists and engineers….and lot of effort is geared toward it From this slide we can see that the energy demand will go to almost 2 or 3 fold by 2050 and….none of the natural resources such as bio, wind, and fossil fuels……will be able to meet up this demand…………and as we see here only solar energy has the potential of meeting this future demand…due to its abundant supply on earth… We at NCL, are very actively working on this problem.we mainly focus on different Metal oxide nanomaterialsandtry to tune therei properties by playing with their electronic band structure, morphology, and surface chemistry to improve their performance for photovoltaic applications……..
 Fossil : 2 TW. * Solar: 160,000 TW Therefore Energy generation is one of the most important issue to address for scientists and engineers….and lot of effort is geared toward it. From this slide we can see that the energy demand will go to almost 2 or 3 fold by 2050 and….none of the natural resources such as bio, wind, and fossil fuels……will be able to meet up this demand…………and as we see here only solar energy has the potential of meeting this future demand…due to its abundant supply on earth… We at NCL, are very actively working on this problem.we mainly focus on different Metal oxide nanomaterialsandtry to tune therei properties by playing with their electronic band structure, morphology, and surface chemistry to improve their performance for photovoltaic applications……..")
8
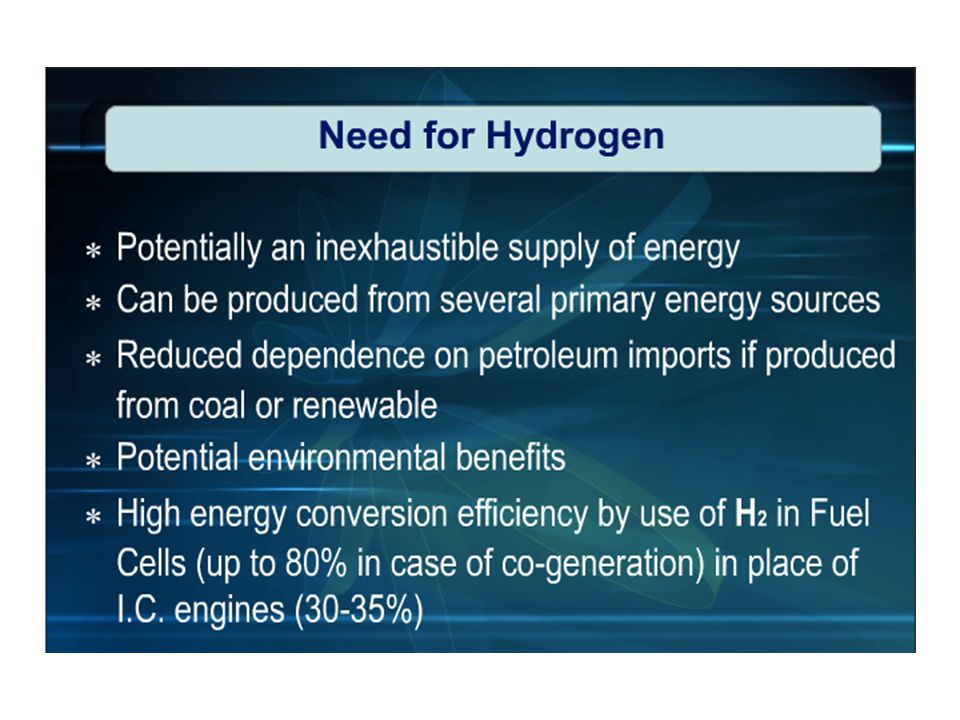
Hydrogen Hydrogen, a gas, will play an important
role in developing sustainable transportation in the United States, because in the future it may be produced in virtually unlimited quantities using renewable resources. Hydrogen and oxygen from air fed into a proton exchange membrane fuel cell produce enough electricity to power an electric automobile, without producing harmful emissions. The only byproduct of a hydrogen fuel cell is water. Currently there are no original equipment manufacturer vehicles available for sale to the general public. Experts estimate that in approximately years hydrogen vehicles, and the infrastructure to support them, will start to make an impact.

10
Applications of Hydrogen Fuel

11
What is a Fuel Cell? A Fuel Cell is an electrochemical device that combines hydrogen and oxygen to produce electricity, with water and heat as its by-product.

12
How can Fuel Cell technology be used?
Transportation All major automakers are working to commercialize a fuel cell car Automakers and experts speculate that a fuel cell vehicle will be commercialized by 2010 50 fuel cell buses are currently in use in North and South America, Europe, Asia and Australia Trains, planes, boats, scooters, forklifts and even bicycles are utilizing fuel cell technology as well

13
How can Fuel Cell technology be used?
Stationary Power Stations Over 2,500 fuel cell systems have been installed all over the world in hospitals, nursing homes, hotels, office buildings, schools and utility power plants Most of these systems are either connected to the electric grid to provide supplemental power and backup assurance or as a grid-independent generator for locations that are inaccessible by power lines

14
How can Fuel Cell technology be used?
Telecommunications Due to computers, the Internet and sophisticated communication networks there is a need for an incredibly reliable power source Fuel Cells have been proven to be % reliable

15
How can Fuel Cell technology be used?
Micro Power Consumer electronics could gain drastically longer battery power with Fuel Cell technology Cell phones can be powered for 30 days without recharging Laptops can be powered for 20 hours without recharging

16
Hydrogen Production The biggest challenge regarding hydrogen production is the cost Reducing the cost of hydrogen production so as to compete in the transportation sector with conventional fuels on a per-mile basis is a significant hurdle to Fuel Cell’s success in the commercial marketplace

17
Hydrogen Production There are three general categories of Hydrogen production Thermal Processes Electrolyte Processes PhotocatalyticProcesses

18
Hydrogen Production PhotocatalyticProcesses
Uses light energy to split water into hydrogen and oxygen These processes are in the very early stages of research but offer the possibility of hydrogen production which is cost effective and has a low environmental impact Two types: a) Photochemical b) Photo-electro-chemical
 Photochemical. b) Photo-electro-chemical.")
19
Photo-catalytic water splitting
1. Direct Water Splitting: 2. Water Splitting using photo-electrochemical cell (PEC): p n H+/H2 e- h+ h1 h2 O2 H2O/O2 h H2 TCO with ohmic contact
: p. n. H+/H2. e- h+ h1. h2. O2. H2O/O2. h H2. TCO with ohmic contact.")
20
Experimental setup Direct Water Splitting: PEC water splitting:
Potentiostat

21
Phto-electrochemistry of water decomposition
Basic principle -In the most simple terms, the principle of photo- electrochemical water decomposition is based on the conversion of light energy into electricity within a cell involving two electrodes, immersed in an aqueous electrolyte, of which at least one is made of a semiconductor exposed to light and able to absorb the light. This electricity is then used for water electrolysis. N-type semiconductor Metal Metal P-type semiconductor

22
Reaction Mechanism 2hν→ 2e′ + 2h+ (1) 2h+ + H2O(liquid) → 1/2O2(gas) + 2H+ (2) 2H+ + 2e′ → H2(gas) (3) Overall Reaction 2hν + H2O(liquid) → 1/2O2(gas) + H2(gas) Light results in intrinsic ionization of n-type semiconducting materials over the band gap, leading to the formation of electrons in the conduction band and electron holes in the valence band: Reaction (1) may take place when the energy of pho- tons (h) is equal to or larger than the band gap. An elec- triceld at the electrode=electrolyte interface is required in order to avoid recombination of these charge carriers. This may be achieved through modication of the potential at the electrode=electrolyte interface. This process takes place at the photo-anode=electrolyte interface. Gaseous oxygen evolves at the photo-anode and the hydrogen ions migrate to the cathode through the internal circuit (aqueous electrolyte). Simultaneously, the electrons, generated as a result of Reaction (1) at the photo-anode, are transferred over the external circuit to the cathode, resulting in the reduction of hydrogen ions into gaseous hydrogen: where G0is the standard free enthalpy per mole of (H2 O)Reaction (4)=237:141 kJ=mol; NA =Avogadro’s number= 6:022 × 1023 mol−1. the electrochemical decomposition of water is possible when the electromotive force of the cell (EMF) is equal to or larger than 1:23 V. = 1.23 eV Electrochemical decomposition of water is possible when EMF of cell ≥ 1.23 V
 2h+ + H2O(liquid) → 1/2O2(gas) + 2H+ (2) 2H+ + 2e′ → H2(gas) (3) Overall Reaction 2hν + H2O(liquid) → 1/2O2(gas) + H2(gas) Light results in intrinsic ionization of n-type semiconducting materials over the band gap, leading to the formation of electrons in the conduction band and electron holes in the valence band: Reaction (1) may take place when the energy of pho- tons (h) is equal to or larger than the band gap. An elec- triceld at the electrode=electrolyte interface is required in order to avoid recombination of these charge carriers. This may be achieved through modication of the potential at the electrode=electrolyte interface. This process takes place at the photo-anode=electrolyte interface. Gaseous oxygen evolves at the photo-anode and the hydrogen ions migrate to the cathode through the internal circuit (aqueous electrolyte). Simultaneously, the electrons, generated as a result of Reaction (1) at the photo-anode, are transferred over the external circuit to the cathode, resulting in the reduction of hydrogen ions into gaseous hydrogen: where G0is the standard free enthalpy per mole of (H2 O)Reaction (4)=237:141 kJ=mol; NA =Avogadro’s number= 6:022 × 1023 mol−1. the electrochemical decomposition of water is possible when the electromotive force of the cell (EMF) is equal to or larger than 1:23 V. = 1.23 eV. Electrochemical decomposition of water is possible when EMF of cell ≥ 1.23 V.")
23
Band model representation
C B D

24
Materials Aspects of PEC
Two main functions of photoelectrodes Optical function: maximum absorption of solar energy Catalytic function: water decomposition Desired properties of photoelectrodes Bandgap Flatband potential Schottky barrier Electrical resistance Helmholtz potential Corrosion resistance Microstructure

25
Band structure of photoelectrode material
-The band gap of the photo-electrode has a critical impact on the energy conversion of photons [62,63]. That is, only the photons of energy equal to or larger than that of the band gap may be absorbed and used for conversion. The maximal conversion eciency of photovoltaic devices may be achieved at band gaps in the range 1.0–1:4 eV; this will be discussed subsequently in Section -Theoretically, the lowest limit for the band gap of a PEC’s photo-anode is determined by the energy required to split the water molecule (1:23 eV), which is de- termined by the photon ux as represented by the integral of J1 − J2 . Accordingly, this photon ux, within this part of the spectrum, is not available for conversion owing to the theoretical energy limit of 1:23 eV [62]. polarization within the PEC; • recombination of the photo-excited electron–hole pairs; resistance of the electrodes; • resistance of the electrical connections; • voltage losses at the contacts. The estimated value of these combined losses is ∼ 0:8 eV ( J2 − J3 ); this part of the spectrum is not available for con- version. Therefore, the optimal energy range in terms of the photons available for conversion is ∼ 2 eV. This situation is represented in Fig. 9 by the integral of J1 − J3.In consequence, the energy corresponding to the photon ux J3 in Fig. 9 is available for conversion. However, the availability of this energy is contingent upon the use of a photo-anode with band gap of 2 eV. Unfortunately, oxide semiconductors that have such a band gap, such as Fe2O3, are susceptible to corrosion, as will be discussed subse- quently in Section 5.6.
, which is de- termined by the photon ux as represented by the integral of J1 − J2 . Accordingly, this photon ux, within this part of the spectrum, is not available for conversion owing to the theoretical energy limit of 1:23 eV [62]. polarization within the PEC; • recombination of the photo-excited electron–hole pairs; resistance of the electrodes; • resistance of the electrical connections; • voltage losses at the contacts. The estimated value of these combined losses is ∼ 0:8 eV ( J2 − J3 ); this part of the spectrum is not available for con- version. Therefore, the optimal energy range in terms of the photons available for conversion is ∼ 2 eV. This situation is represented in Fig. 9 by the integral of J1 − J3.In consequence, the energy corresponding to the photon ux J3 in Fig. 9 is available for conversion. However, the availability of this energy is contingent upon the use of a photo-anode with band gap of 2 eV. Unfortunately, oxide semiconductors that have such a band gap, such as Fe2O3, are susceptible to corrosion, as will be discussed subse- quently in Section 5.6.")
26
Only reduction or oxidation Depends on the band position
WHY SEMICONDUCTOR ? Metals No band gap Only reduction or oxidation Depends on the band position Insulators High band gap High energy requirement Metals VB CB H+/H2 H2O/O2 Insulators SC E 26

27
Concepts –Why semiconductors are chosen as photo-catalysts?
For conventional redox reactions, one is interested in either reduction or oxidation of a substrate. For example consider that one were interested in the oxidation of Fe2+ ions to Fe 3+ ions then the oxidizing agent that can carry out this oxidation is chosen from the relative potentials of the oxidizing agent with respect to the redox potential of Fe2+/Fe3+ redox couple. The oxidizing agent chosen should have more positive potential with respect to Fe3+/Fe2+ couple so as to affect the oxidation, while the oxidizing agent undergoes reduction spontaneously. This situation throws open a number of possible oxidizing agents from which one of them can be easily chosen. 27

28
Bandgap -These data are shown in terms of their energies compared to the vacuum level and the normal hydrogen electrode (NHE) level in an aqueous solution of pH = 2 [64]. Un- fortunately, the most promising materials from the view- point of the band gap width, such as Fe2O3 (Eg = 2:3 eV) [65], GaP (Eg = 2:23 eV) [66], and GaAs (Eg = 1:4 eV) [66], are not stable in aqueous environments and so exhibit signicant corrosion by water. Therefore, these materials are not suitable as photo-electrodes in aqueous environments. The most promising oxide materials, which are corrosion resistant, include TiO2 and SrTiO3 [7–14,17, 20–35, 37–51]. -As discussed in Section 4.1, the optimal band gap for high- performance photo-electrodes is ∼ 2 eV [10,22,27,51,58,59]. Such a material, which satises this requirement and is corrosion resistant, is not available commercially. There- fore, there is a need to process such a material. -One possibility by which this can be achieved is through the imposition of a band located ∼ 2 eV below the conduction band. Experimentally, this impurity band can be achieved through the heavy doping of TiO2 with aliovalent ions. As seen in Fig. 14 [68,69], the most promising dopant to use is V4+=5+, which forms the solid solution (Ti1−xVx)O2 [47,48,70]. However, these reports are not in agreement concerning the eect of doping on the electrochemical properties of TiO2. Philips et al. [70] have observed that, although the addition of 30 mol% V to TiO2 results in a reduction in the band gap to 1:99 eV, the formation of (Ti0:7 V0:3 )O2hadadetrimentaleectonthephoto-activity due to a substantial increase in the at band potential by ∼ 1 V). As a result, this necessitated the imposition of an adequate external bias voltage.
 level in an aqueous solution of pH = 2 [64]. Un- fortunately, the most promising materials from the view- point of the band gap width, such as Fe2O3 (Eg = 2:3 eV) [65], GaP (Eg = 2:23 eV) [66], and GaAs (Eg = 1:4 eV) [66], are not stable in aqueous environments and so exhibit signicant corrosion by water. Therefore, these materials are not suitable as photo-electrodes in aqueous environments. The most promising oxide materials, which are corrosion resistant, include TiO2 and SrTiO3 [7–14,17, 20–35, 37–51]. -As discussed in Section 4.1, the optimal band gap for high- performance photo-electrodes is ∼ 2 eV [10,22,27,51,58,59]. Such a material, which satises this requirement and is corrosion resistant, is not available commercially. There- fore, there is a need to process such a material. -One possibility by which this can be achieved is through the imposition of a band located ∼ 2 eV below the conduction band. Experimentally, this impurity band can be achieved through the heavy doping of TiO2 with aliovalent ions. As seen in Fig. 14 [68,69], the most promising dopant to use is V4+=5+, which forms the solid solution (Ti1−xVx)O2 [47,48,70]. However, these reports are not in agreement concerning the eect of doping on the electrochemical properties of TiO2. Philips et al. [70] have observed that, although the addition of 30 mol% V to TiO2 results in a reduction in the band gap to 1:99 eV, the formation of (Ti0:7 V0:3 )O2hadadetrimentaleectonthephoto-activity due to a substantial increase in the at band potential by ∼ 1 V). As a result, this necessitated the imposition of an adequate external bias voltage.")
30
Flatband potential -The at-band potential, Ufb, is the potential that has to be imposed over the electrode=electrolyte interface in order to make the bands at [22,51,58]. This potential is an im- portant quantity in photo-electrode reactions. Specically, the process of water photo-electrolysis may take place when the at-band potential is higher than the redox potential of the H+=H2 couple [22,51,58]. The at-band potential may be modied to the desired level through surface chemistry [48,49]. -photo-cells equipped with a photo-anode made of materials with negative at-band potentials (relative to the redox potential of the H+=H2 couple, which depends on the pH) can split the water molecule without the imposition of a bias.
 can split the water molecule without the imposition of a bias.")
31
Other important parameters
Electrical Conductivity Helmholtz Potential Barrier Corrosion Resistance: Electrochemical corrosion resistance Photocorrosion resistance Dissolution -When a semiconducting photo-electrode material is immersed in a liquid electrolyte (in which the chemicalpotential of the electrons is determined by the H+=H2 redox potential), the charge transfer at the solid=liquid interface results in charging of the surface layer of the semiconductor. The charge transfer from the semiconductor to the electrolyte leads to the formation of a surface charge and results in upwards band bending, forming a potential barrier, as shown in Fig. 16. This barrier is similar to that of the solid=solid interface, shown in Fig. 5. This surface charge is compensated by a charge of the opposite sign, which is induced in the electrolyte within a localized layer, known as the Helmholtz layer. It is ∼ 1 nm thick and is formed of oriented water molecule dipoles and electrolyte ions adsorbed at the electrode surface [51,73,74]. The height of this potential barrier, known as the Helmholtz barrier, is determined by the nature of the aqueous environment of the electrolyte and the properties of the photo-electrode surface. The performance characteristics of PECs depend, to a large extent, on the height of the Helmholtz barrier [51]. Therefore, it is essential to obtain further infor- mation on (i) the eect of the specic properties of the electrode=electrolyte interface on the height of the barrier and (ii) the determination of the eect of the Helmholtz barrier on the eciency of the photo-electrochemical process.
, the charge transfer at the solid=liquid interface results in charging of the surface layer of the semiconductor. The charge transfer from the semiconductor to the electrolyte leads to the formation of a surface charge and results in upwards band bending, forming a potential barrier, as shown in Fig. 16. This barrier is similar to that of the solid=solid interface, shown in Fig. 5. This surface charge is compensated by a charge of the opposite sign, which is induced in the electrolyte within a localized layer, known as the Helmholtz layer. It is ∼ 1 nm thick and is formed of oriented water molecule dipoles and electrolyte ions adsorbed at the electrode surface [51,73,74]. The height of this potential barrier, known as the Helmholtz barrier, is determined by the nature of the aqueous environment of the electrolyte and the properties of the photo-electrode surface. The performance characteristics of PECs depend, to a large extent, on the height of the Helmholtz barrier [51]. Therefore, it is essential to obtain further infor- mation on (i) the eect of the specic properties of the electrode=electrolyte interface on the height of the barrier and (ii) the determination of the eect of the Helmholtz barrier on the eciency of the photo-electrochemical process.")
32
Criterion for PE corrosion stability
Photo anode Free enthalpy of oxidation reaction Photo cathode Free enthalpy of reduction reaction

33
What modifications? various conceptual principles have been incorporated into typical TiO2 system so as to make this system responsive to longer wavelength radiations. These efforts can be classified as follows: Dye sensitization Surface modification of the semiconductor to improve the stability Multi layer systems (coupled semiconductors) Doping of wide band gap semiconductors like TiO2 by nitrogen, carbon and Sulphur New semiconductors with metal 3d valence band instead of Oxide 2p contribution Sensitization by doping. All these attempts can be understood in terms of some kind sensitization and hence the route of charge transfer has been extended and hence the efficiency could not be increased considerably. In spite of these options being elucidated, success appears to beeluding the researchers. 33
 Doping of wide band gap semiconductors like TiO2 by nitrogen, carbon and Sulphur. New semiconductors with metal 3d valence band instead of Oxide 2p contribution. Sensitization by doping. All these attempts can be understood in terms of some kind sensitization and hence the route of charge transfer has been extended and hence the efficiency could not be increased considerably. In spite of these options being elucidated, success appears to beeluding the researchers. 33.")
34
Conditions to be satisfied?
The band edges of the electrode must overlap with the acceptor and donor states of water decomposition reaction, thus necessitating that the electrodes should at least have a band gap of 1.23 V, the reversible thermodynamic decomposition potential of water. This situation necessarily means that appropriate semiconductors alone are acceptable as electrode materials for water The charge transfer from the surface of the semiconductor must be fast enough to prevent photo corrosion and shift of the band edges resulting in loss of photon energy. 34

35
ENGINEERING THE SEMICONDUCTOR ELECTRONIC STRUCTURES
without deterioration of the stability should increase charge transfer processes at the interface should improvements in the efficiency 35

36
Positions of bands of semiconductors relative to the standard potentials of several redox couples
36

37
THE AVAILABLE OPPORTUNITIES
Identifying and designing new semiconductor materials with considerable conversion efficiency and stability Constructing multilayer systems or using sensitizing dyes - increase absorption of solar radiation Formulating multi-junction systems or coupled systems - optimize and utilize the possible regions of solar radiation Developing nanosize systems - efficiently dissociate water 37

38
presence of surface states wide band gap position of the VB & CB edge
ADVANTAGES OF SEMICONDUCTOR NANOPARTICLES high surface area morphology presence of surface states wide band gap position of the VB & CB edge eV CdS – appropriate choice for the hydrogen production 38

39
The opportunities The opportunities that are obviously available as such now include the following: Identifying and designing new semiconductor materials with considerable conversion efficiency and stability Constructing multilayer systems or using sensitizing dyes so as to increase absorption of solar radiation. Formulating multi-junction systems or coupled systems so as to optimize and utilize the possible regions of solar radiation. Developing catalytic systems which can efficiently dissociate water. 39

40
Opportunities evolved
Deposition techniques have been considerably perfected and hence can be exploited in various other applications like in thin film technology especially for various devices and sensory applications. The knowledge of the defect chemistry has been considerably improved and developed. Optical collectors, mirrors and all optical analysis capability have increased which can be exploited in many other future optical devices. The understanding of the electronic structure of materials has been advanced and this has helped to our background in materials chemistry. Many electrodes have been developed, which can be a useful for all other kinds of electrochemical devices. 40

41
Limited success – Why? The main reasons for this limited success in all these directions are due to: The electronic structure of the semiconductor controls the reaction and engineering these electronic structures without deterioration of the stability of the resulting system appears to be a difficult proposition. The most obvious thermodynamic barriers to the reaction and the thermodynamic balances that can be achieved in these processes give little scope for remarkable improvements in the efficiency of the systems as they have been conceived and operated. Totally new formulations which can still satisfy the existing thermodynamic barriers have to be devised. The charge transfer processes at the interface, even though a well studied subject in electrochemistry has to be understood more explicitly, in terms of interfacial energetics as well as kinetics. Till such an explicit knowledge is available, designing systems will have to be based on trial and error rather than based on sound logical scientific reasoning. 41

42
Nanocrystalline (mainly oxides like TiO2, ZnO, SnO and Nb2O5 or chalcogenides like CdSe) mesoscopic semiconductor materials with high internal surface area If a dye were to be adsorbed as a monolayer, enough can be retained on a given area of the electrode so as to absorb the entire incident light. Since the particle sizes involved are small, there is no significant local electric field and hence the photo-response is mainly contributed by the charge transfer with the redox couple. Two factors essentially contribute to the photo-voltage observed, namely, the contact between the nano crystalline oxide and the back contact of these materials as well as the Fermi level shift of the semiconductor as a result of electron injection from the semiconductor. 42

43
Another aspect of thee nano crystalline state is the alteration of the band gap to larger values as compared to the bulk material which may facilitate both the oxidation/reduction reactions that cannot normally proceed on bulk semiconductors. The response of a single crystal anatase can be compared with that of the meso-porous TiO2 film sensitized by ruthenium complex (cis RuL2 (SCN)2, where L is 2-2’bipyridyl-4-4’dicarboxlate). The incident photon to current conversion efficiency (IPCE) is only 0.13% at 530 nm ( the absorption maximum for the sensitizer) for the single crystal electrode while in the nano crystalline state the value is 88% showing nearly times higher value. 43
2, where L is 2-2’bipyridyl-4-4’dicarboxlate). The incident photon to current conversion efficiency (IPCE) is only 0.13% at 530 nm ( the absorption maximum for the sensitizer) for the single crystal electrode while in the nano crystalline state the value is 88% showing nearly times higher value. 43.")
44
This increase is due to better light harvesting capacity of the dye sensitized nano crystalline material but also due to mesoscpic film texture favouring photo-generation and collection of charge carriers . It is clear therefore that the nano crystalline state in combination with suitable sensitization is one another alternative which is worth investigating. 44

45
The second option is to promote water splitting in the visible range using Tandem ells. In this a thin film of a nanocrystalline WO3 or Fe2O3 may serve as top electrode absorbing blue part of the solar spectrum. The positive holes generated oxidize water to oxygen 4h+ + 2H2O --- O2 + 4 H+ The electrons in the conduction band are fed to the second photo system consisting of the dye sensitized nano crystalline TiO2 and since this is placed below the top layer it absorbs the green or red part of the solar spectrum that is transmitted through the top electrode. The photo voltage generated in the second photo system favours hydrogen generation by the reaction 4H e- --- 2H2 The overall reaction is the splitting of water utilizing visible light. The situation is similar to what is obtained in photosynthesis 45

46
Dye sensitized solid hetero-junctions and extremely thin absorber solar cells have also been designed with light absorber and charge transport material being selected independently so as to optimize solar energy harvesting and high photovoltaic output. However, the conversion efficiencies of these configurations have not been remarkably high. Soft junctions, especially organic solar cells, based on interpenetrating polymer networks, polymer/fullerene blends, halogen doped organic crystals and a variety of conducting polymers have been examined. Though the conversion efficiency of incident photons is high, the performance of the cell declined rapidly. Long term stability will be a stumbling block for large scale application of polymer solar cells. 46

47
New Opportunities New semi-conducting materials with conversion efficiencies and stability have been identified. These are not only simple oxides, sulphides but also multi-component oxides based on perovskites and spinels. Multilayer configurations have been proposed for absorption of different wavelength regions. In these systems the control of the thickness of each layer has been mainly focused on. 47

48
New Opportunities Sensitization by dyes and other anchored molecular species has been suggested as an alternative to extend the wavelength region of absorption. The coupled systems, thus giving rise to multi-junctions is another approach which is being pursued in recent times with some success Activation of semiconductors by suitable catalysts for water decomposition has always fascinated scientists and this has resulted in various metal or metal oxide (catalysts) loaded semi conductors being used as photo-anodes 48
 loaded semi conductors being used as photo-anodes. 48.")
49
New opportunities (Contd)
Recently a combinatorial electrochemical synthesis and characterization route has been considered for developing tungsten based mixed metal oxides and this has thrown open yet another opportunity to quickly screen and evaluate the performances of a variety of systems and to evolve suitable composition-function relationships which can be used to predict appropriate compositions for the desired manifestations of the functions. It has been shown that each of these concepts, though has its own merits and innovations, has not yielded the desired levels of efficiency. The main reason for this failure appears to be that it is still not yet possible to modulate the electronic structure of the semiconductor in the required directions as well as control the electron transfer process in the desired direction. 49

50
PREPARATION OF CdS NANOPARTICLES
1 g of Zeolite (HY, H, HZSM-5) 1 M Cd(NO3)2 , stirred for 24 h, washed with water Cd / Zeolite 1 M Na2S solution, stirred for 12 h, washed with water CdS / Zeolite 48 % HF, washed with water CdS Nanoparticles 50
 1 M Cd(NO3)2 , stirred for. 24 h, washed with water. Cd / Zeolite. 1 M Na2S solution, stirred for. 12 h, washed with water. CdS / Zeolite. 48 % HF, washed with water. CdS Nanoparticles. 50.")
51
XRD PATTERN OF CdS M. Sathish, B. Viswanathan, R. P. Viswanath Int. J. Hydrogen Energy (In press) 51
 51.")
52
Debye Scherrer Equation
dSPACING AND CRYSTALLITE SIZE Debye Scherrer Equation = diffraction angle T = Crystallite size = wave length = FWHM d-spacing (Å) Catalyst (0 0 2) (1 0 1) (1 1 2) Crystallite Size(nm) CdS (bulk) 1.52 1.79 2.97 21.7 (HF treated) 2.93 CdS-Y 1.53 2.96 8.8 CdS- 1.78 8.6 CdS-Z 7.2 52
 Catalyst. (0 0 2) (1 0 1) (1 1 2) Crystallite. Size(nm) CdS (bulk) (HF treated) CdS-Y CdS- CdS-Z")
53
UV –VISIBLE SPECTRA OF CdS SAMPLES
Band Gap (eV) CdS – Z CdS – Y CdS - Bulk CdS 2.38 2.27 2.21 2.13 M. Sathish, B. Viswanathan, R. P. Viswanath Int. J. Hydrogen Energy (In press) 53
 CdS – Z. CdS – Y. CdS - Bulk CdS M. Sathish, B. Viswanathan, R. P. Viswanath Int. J. Hydrogen Energy (In press) 53.")
54
PHOTOCATALYTIC PRODUCTION OF HYDROGEN
35ml of 0.24 M Na2S and 0.35 M Na2SO3 in Quartz cell 0.1 g CdS 400 W Hg lamp N2 gas purged before the reaction and constant stirring Hydrogen gas was collected over water in the gas burette 54

55
AMOUNT OF HYDROGEN EVOLVED BY CdS PHOTOCATALYST
55

56
TEM IMAGE OF CdS NANOPARTICLES
Catalyst Particle Size (nm) Surface area (m2/g) Rate of hydrogen production ( moles /h) CdS - Y 8.8 36 102 CdS - Z 6 46 68 CdS - 11 26 67 CdS - Bulk 23 14 45 CdS-Z 100 nm CdS-Z CdS- 100 nm 56
 Surface. area. (m2/g) Rate of hydrogen. production. ( moles /h) CdS - Y CdS - Z CdS - CdS - Bulk CdS-Z. 100 nm. CdS-Z. CdS- 100 nm. 56.")
57
SCANNING ELECTRON MICROGRAPHS
CdS-Z CdS-Y CdS- CdS- bulk 57

58
T.Sakata, et al Chem. Phys.Lett. 88 (1982) 50
PHOTOCATALYSIS ON Pt/TiO2 INTERFACE Vacuum level Electrons are transferred to metal surface Reduction of H+ ions takes place at the metal surface The holes move into the other side of semiconductor The oxidation takes place at the semiconductor surface Aq. Sol Pt TiO2 Aq. Sol pH = 7 C.B H+/H2 pH=0 EF V.B T.Sakata, et al Chem. Phys.Lett. 88 (1982) 50 58
")
59
e- e- e- e- e- e- e- e- e- e- e- e-
MECHANISM OF RECOMBINATION REDUCTION BY METAL DOPING Conduction Band e- e- e- e- e- e- e- e- e- e- e- e- Valence Band h+ h+ h+ h+ h+ h+ h+ h+ h+ h+ Electron/hole pair recombination generation e-(M) <-- M+e- Eg Metallic promoter attracts electrons from TiO2 conduction band and slows recombination reaction 52
 <-- M+e- Eg. Metallic promoter attracts electrons from TiO2 conduction. band and slows recombination reaction. 52.")
60
PHOTOCATALYTIC HYDROGEN EVOLUTION OVER METAL LOADED CdS NANOPARTICLES
Activity of the catalyst is directly proportional to work function of the metal and M-H bond strength. 60

61
HYDROGEN PRODUCTION ACTIVITY OF METAL LOADED CdS PREPARED FROM H-ZSM-5
Redox potential (E0) Metal- hydrogen bond energy (K cal mol-1) Work function (eV) Hydrogen evolution rate* (µmol h-1 0.1g-1) Pt Pd Rh Ru 1.188 0.951 0.758 0.455 62.8 64.5 65.1 66.6 5.65 5.12 4.98 4.71 600 144 114 54 *1 wt% metal loaded on CdS-Z sample. The reaction data is presented after 6 h under reaction condition. M. Sathish, B. Viswanathan, R. P. Viswanath Int. J. Hydrogen Energy (In press) 61
 Metal- hydrogen bond energy. (K cal mol-1) Work function. (eV) Hydrogen evolution rate* (µmol h-1 0.1g-1) Pt. Pd. Rh. Ru *1 wt% metal loaded on CdS-Z sample. The reaction data is presented. after 6 h under reaction condition. M. Sathish, B. Viswanathan, R. P. Viswanath Int. J. Hydrogen Energy (In press) 61.")
62
EFFECT OF METALS ON HYDROGEN EVOLUTION RATE
Pt Pd 1000 Pt, Pd & Rh show higher activity High reduction potential. Hydrogen over voltage is less for Pt, Pd & Rh Rh Au Cu 100 Ag Ni 10 Fe Ru 3 % 62

63
2, 5,10 and 20 wt % CdS on support - by dry impregnation method
EFFECT OF SUPPORT ON THE CdS PHOTOCATLYTIC ACTIVITY 2, 5,10 and 20 wt % CdS on support - by dry impregnation method Alumina & Magnesia supports enhance photocatalytic activity MgO support has higher photocatalytic activity - favourable band position 63

64
I. Tsuji, et al J. Photochem. Photobiol. A. Chem 622 (2003) 1
Pb2+/ ZnS Absorption at 530nm (calcinations at K) Formation of extra energy levels between the band gap by Pb s orbital Low activity at 873K is due to PbS formation on the surface (Zinc blende to wurtzite) Eg (a) 573 K, (b) 623 K, (c) 673 K, (d) 773 K, and (e) 873K Band structure of ZnS doped with Pb. I. Tsuji, et al J. Photochem. Photobiol. A. Chem 622 (2003) 1 64
 Formation of extra energy levels between the band gap by Pb 6s orbital. Low activity at 873K is due to PbS formation on the surface (Zinc blende to wurtzite) Eg. (a) 573 K, (b) 623 K, (c) 673 K, (d) 773 K, and (e) 873K. Band structure of ZnS doped with Pb. I. Tsuji, et al J. Photochem. Photobiol. A. Chem 622 (2003)")
65
Ultrasonic waves = 20 kHz PREPARATION OF MESOPOROUS CdS NANOPARTICLE
BY ULTRASONIC MEDIATED PRECIPITATION 250 ml of 1 mM Cd(NO3)2 Rate of addition ml / h Ultrasonic waves = 20 kHz 250 ml of 5 mM Na2S solution The resulting precipitate was washed with distilled water until the filtrate was free from S2- ions 65
2. Rate of addition 20 ml / h. Ultrasonic waves. = 20 kHz. 250 ml of 5 mM. Na2S solution. The resulting precipitate was washed with distilled water until the filtrate was free from S2- ions. 65.")
66
The adsorption - desorption isotherm – Type IV (mesoporous nature)
N2 ADSORPTION - DESORPTION ISOTHERM The specific surface area and pore volume are 94 m2/g and cm3/g respectively The adsorption - desorption isotherm – Type IV (mesoporous nature) Mesopores are in the range of 30 to 80 Å size The maximum pore volume is contributed by Å size pores 66
 Mesopores are in the range of 30 to 80 Å size. The maximum pore volume is contributed by 45 Å size pores. 66.")
67
M. Sathish and R. P. Viswanath Mater. Res. Bull(Communicated)
X- RAY DIFFRACTION PATTERN XRD pattern of as-prepared CdS -U shows the presence of cubic phase The observed “d” values are 1.75, 2.04 and 3.32 Å corresponding to the (3 1 1) (2 2 0) and (1 1 1) planes respectively - cubic The peak broadening shows the formation of nanoparticles The particle size is calculated using Debye Scherrer Equation The average particle size of as- prepared CdS is 3.5 nm M. Sathish and R. P. Viswanath Mater. Res. Bull(Communicated) 67
 (2 2 0) and (1 1 1) planes respectively - cubic. The peak broadening shows the. formation of nanoparticles. The particle size is calculated. using Debye Scherrer Equation. The average particle size of as- prepared CdS is 3.5 nm. M. Sathish and R. P. Viswanath Mater. Res. Bull(Communicated) 67.")
68
The CdS-bulk surface is found with large outgrowth of CdS particles
ELECTRON MICROGRAPHS The growth of fine spongy particles of CdS-U is observed on the surface of the CdS-U The CdS-bulk surface is found with large outgrowth of CdS particles The fine mesoporous CdS particles are in the nanosize range The dispersed and agglomerated forms are clearly observed for the as-prepared CdS-U TEM SEM CdS-U 100 nm CdS-U CdS - Bulk 68

69
1 wt % Metal loaded CdS – U is 2-3 times more active than the CdS-Z
PHOTOCATALYTIC HYDROGEN PRODUCTION Na2S and Na2SO3 mixture used as sacrificial agent Amount of hydrogen (µM/0.1 g) Metal CdS-U CdS-Z CdS bulk - Rh Pd Pt 73 320 726 1415 68 114 144 600 45 102 109 275 1 wt % Metal loaded CdS – U is 2-3 times more active than the CdS-Z 69
 Metal. CdS-U. CdS-Z. CdS. bulk. - Rh. Pd. Pt wt % Metal loaded CdS – U is 2-3 times more active than the CdS-Z. 69.")
70
LIMITED SUCCESS – WHY? Difficulties on controlling the semiconductor electronic structure without deterioration of the stability Little scope on the thermodynamic barriers and the thermodynamic balances for remarkable improvements in the efficiency Incomplete understanding in the interfacial energetic as well as in the kinetics 70

71
Understanding of the electronic structure of materials
THE OTHER OPPORTUNITIES EVOLVED Deposition techniques -thin film technology, for various devices and sensory applications. Knowledge of the defect chemistry has been considerably improved and developed. Optical collectors, mirrors and all optical analysis capability have increased Understanding of the electronic structure of materials Many electrodes have been developed- useful for all other kinds of electrochemical devices. 71

72
Thank you all for your kind attention

73
Photo-electrochemical H2 Generation
Basic principle -Hydrogen as fuel, replacing fossil fuels, for vehicles, domestic heating and aircraft Relative emmisions are very less H2 is not present in nanture in gaseous form, but it is present in plants as well as in compunds such as hydrocarbons, and most imp. Ly in water So far h2 has been produced from methane by steam reforming….but it produces Co2…. When produced from water……no emission of hazardous gases….combustion of H2 results in water…….no air pollution… no greenhouse effect Also there has been effort to produce H2 using electricity- obatined from sossil fuels---which is again not GREEN. Or environnment friendly But if H2 is generated from water using solar energy….then it is a win win situation…..Also it is a better way of storing energy…..since it is easier to store H2 than storing photelectricity.: -In the most simple terms, the principle of photo- electrochemical water decomposition is based on the conversion of light energy into electricity within a cell involving two electrodes, immersed in an aqueous electrolyte, of which at least one is made of a semiconductor exposed to light and able to absorb the light. This electricity is then used for water electrolysis. N-type semiconductor Metal Metal P-type semiconductor

74
Reaction Mechanism 2hν→ 2e′ + 2h+ (1)
2h+ + H2O(liquid) → 1/2O2(gas) + 2H (2) 2H+ + 2e′ → H2(gas) (3) Overall Reaction 2hν + H2O(liquid) → 1/2O2(gas) + H2(gas) Light results in intrinsic ionization of n-type semiconducting materials over the band gap, leading to the formation of electrons in the conduction band and electron holes in the valence band: Reaction (1) may take place when the energy of pho- tons (h) is equal to or larger than the band gap. An elec- triceld at the electrode=electrolyte interface is required in order to avoid recombination of these charge carriers. This may be achieved through modication of the potential at the electrode=electrolyte interface. This process takes place at the photo-anode=electrolyte interface. Gaseous oxygen evolves at the photo-anode and the hydrogen ions migrate to the cathode through the internal circuit (aqueous electrolyte). Simultaneously, the electrons, generated as a result of Reaction (1) at the photo-anode, are transferred over the external circuit to the cathode, resulting in the reduction of hydrogen ions into gaseous hydrogen: where G0is the standard free enthalpy per mole of (H2 O)Reaction (4)=237:141 kJ=mol; NA =Avogadro’s number= 6:022 × 1023 mol−1. the electrochemical decomposition of water is possible when the electromotive force of the cell (EMF) is equal to or larger than 1:23 V. = 1.23 eV Electrochemical decomposition of water is possible when EMF of cell ≥ 1.23 V
 → 1/2O2(gas) + 2H+ (2) 2H+ + 2e′ → H2(gas) (3) Overall Reaction. 2hν + H2O(liquid) → 1/2O2(gas) + H2(gas) Light results in intrinsic ionization of n-type semiconducting materials over the band gap, leading to the formation of electrons in the conduction band and electron holes in the valence band: Reaction (1) may take place when the energy of pho- tons (h) is equal to or larger than the band gap. An elec- triceld at the electrode=electrolyte interface is required in order to avoid recombination of these charge carriers. This may be achieved through modication of the potential at the electrode=electrolyte interface. This process takes place at the photo-anode=electrolyte interface. Gaseous oxygen evolves at the photo-anode and the hydrogen ions migrate to the cathode through the internal circuit (aqueous electrolyte). Simultaneously, the electrons, generated as a result of Reaction (1) at the photo-anode, are transferred over the external circuit to the cathode, resulting in the reduction of hydrogen ions into gaseous hydrogen: where G0is the standard free enthalpy per mole of (H2 O)Reaction (4)=237:141 kJ=mol; NA =Avogadro’s number= 6:022 × 1023 mol−1. the electrochemical decomposition of water is possible when the electromotive force of the cell (EMF) is equal to or larger than 1:23 V. = 1.23 eV. Electrochemical decomposition of water is possible when EMF of cell ≥ 1.23 V.")
75
Metal Oxide Requirements
Two main functions of photoelectrodes Optical function: maximum absorption of solar energy Catalytic function: water decomposition Desired properties of photoelectrodes Bandgap Flatband potential Schottky barrier Electrical resistance Helmholtz potential Corrosion resistance Microstructure

76
Bandgap -These data are shown in terms of their energies compared to the vacuum level and the normal hydrogen electrode (NHE) level in an aqueous solution of pH = 2 [64]. Un- fortunately, the most promising materials from the view- point of the band gap width, such as Fe2O3 (Eg = 2:3 eV) [65], GaP (Eg = 2:23 eV) [66], and GaAs (Eg = 1:4 eV) [66], are not stable in aqueous environments and so exhibit signicant corrosion by water. Therefore, these materials are not suitable as photo-electrodes in aqueous environments. The most promising oxide materials, which are corrosion resistant, include TiO2 and SrTiO3 [7–14,17, 20–35, 37–51]. -As discussed in Section 4.1, the optimal band gap for high- performance photo-electrodes is ∼ 2 eV [10,22,27,51,58,59]. Such a material, which satises this requirement and is corrosion resistant, is not available commercially. There- fore, there is a need to process such a material. -One possibility by which this can be achieved is through the imposition of a band located ∼ 2 eV below the conduction band. Experimentally, this impurity band can be achieved through the heavy doping of TiO2 with aliovalent ions. As seen in Fig. 14 [68,69], the most promising dopant to use is V4+=5+, which forms the solid solution (Ti1−xVx)O2 [47,48,70]. However, these reports are not in agreement concerning the eect of doping on the electrochemical properties of TiO2. Philips et al. [70] have observed that, although the addition of 30 mol% V to TiO2 results in a reduction in the band gap to 1:99 eV, the formation of (Ti0:7 V0:3 )O2hadadetrimentaleectonthephoto-activity due to a substantial increase in the at band potential by ∼ 1 V). As a result, this necessitated the imposition of an adequate external bias voltage.
 level in an aqueous solution of pH = 2 [64]. Un- fortunately, the most promising materials from the view- point of the band gap width, such as Fe2O3 (Eg = 2:3 eV) [65], GaP (Eg = 2:23 eV) [66], and GaAs (Eg = 1:4 eV) [66], are not stable in aqueous environments and so exhibit signicant corrosion by water. Therefore, these materials are not suitable as photo-electrodes in aqueous environments. The most promising oxide materials, which are corrosion resistant, include TiO2 and SrTiO3 [7–14,17, 20–35, 37–51]. -As discussed in Section 4.1, the optimal band gap for high- performance photo-electrodes is ∼ 2 eV [10,22,27,51,58,59]. Such a material, which satises this requirement and is corrosion resistant, is not available commercially. There- fore, there is a need to process such a material. -One possibility by which this can be achieved is through the imposition of a band located ∼ 2 eV below the conduction band. Experimentally, this impurity band can be achieved through the heavy doping of TiO2 with aliovalent ions. As seen in Fig. 14 [68,69], the most promising dopant to use is V4+=5+, which forms the solid solution (Ti1−xVx)O2 [47,48,70]. However, these reports are not in agreement concerning the eect of doping on the electrochemical properties of TiO2. Philips et al. [70] have observed that, although the addition of 30 mol% V to TiO2 results in a reduction in the band gap to 1:99 eV, the formation of (Ti0:7 V0:3 )O2hadadetrimentaleectonthephoto-activity due to a substantial increase in the at band potential by ∼ 1 V). As a result, this necessitated the imposition of an adequate external bias voltage.")
77
Flatband Potential -The at-band potential, Ufb, is the potential that has to be imposed over the electrode=electrolyte interface in order to make the bands at [22,51,58]. This potential is an im- portant quantity in photo-electrode reactions. Specically, the process of water photo-electrolysis may take place when the at-band potential is higher than the redox potential of the H+=H2 couple [22,51,58]. The at-band potential may be modied to the desired level through surface chemistry [48,49]. -photo-cells equipped with a photo-anode made of materials with negative at-band potentials (relative to the redox potential of the H+=H2 couple, which depends on the pH) can split the water molecule without the imposition of a bias.
 can split the water molecule without the imposition of a bias.")
78
Other important parameters
Electrical Conductivity Helmholtz Potential Barrier Corrosion Resistance: Electrochemical corrosion resistance Photocorrosion resistance Dissolution -When a semiconducting photo-electrode material is immersed in a liquid electrolyte (in which the chemicalpotential of the electrons is determined by the H+=H2 redox potential), the charge transfer at the solid=liquid interface results in charging of the surface layer of the semiconductor. The charge transfer from the semiconductor to the electrolyte leads to the formation of a surface charge and results in upwards band bending, forming a potential barrier, as shown in Fig. 16. This barrier is similar to that of the solid=solid interface, shown in Fig. 5. This surface charge is compensated by a charge of the opposite sign, which is induced in the electrolyte within a localized layer, known as the Helmholtz layer. It is ∼ 1 nm thick and is formed of oriented water molecule dipoles and electrolyte ions adsorbed at the electrode surface [51,73,74]. The height of this potential barrier, known as the Helmholtz barrier, is determined by the nature of the aqueous environment of the electrolyte and the properties of the photo-electrode surface. The performance characteristics of PECs depend, to a large extent, on the height of the Helmholtz barrier [51]. Therefore, it is essential to obtain further infor- mation on (i) the eect of the specic properties of the electrode=electrolyte interface on the height of the barrier and (ii) the determination of the eect of the Helmholtz barrier on the eciency of the photo-electrochemical process.
, the charge transfer at the solid=liquid interface results in charging of the surface layer of the semiconductor. The charge transfer from the semiconductor to the electrolyte leads to the formation of a surface charge and results in upwards band bending, forming a potential barrier, as shown in Fig. 16. This barrier is similar to that of the solid=solid interface, shown in Fig. 5. This surface charge is compensated by a charge of the opposite sign, which is induced in the electrolyte within a localized layer, known as the Helmholtz layer. It is ∼ 1 nm thick and is formed of oriented water molecule dipoles and electrolyte ions adsorbed at the electrode surface [51,73,74]. The height of this potential barrier, known as the Helmholtz barrier, is determined by the nature of the aqueous environment of the electrolyte and the properties of the photo-electrode surface. The performance characteristics of PECs depend, to a large extent, on the height of the Helmholtz barrier [51]. Therefore, it is essential to obtain further infor- mation on (i) the eect of the specic properties of the electrode=electrolyte interface on the height of the barrier and (ii) the determination of the eect of the Helmholtz barrier on the eciency of the photo-electrochemical process.")
79
Criterion for PE corrosion stability
Photo anode Free enthalpy of oxidation reaction Photo cathode Free enthalpy of reduction reaction

80
Dye-Sensitized TiO2 J. AM. CHEM. SOC. 2009, 131, 926–927

81
Mesoporous Fe2O3 J. AM. CHEM. SOC. 9 VOL. 132, NO. 21, 2010

82
WO3 Nanowires

83
Double-Sided CdS and CdSe Quantum Dot Co-Sensitized ZnONanowire Arrays for PEC Hydrogen Generation
-Wereportthedesignandcharacterizationofanoveldouble-sidedCdSandCdSequantumdotcosensitizedZnOnanowire arrayed photoanode for photoelectrochemical (PEC) hydrogen generation. The double-sided design represents a simple analogue of tandem cell structure, in which the dense ZnOnanowire arrays were grown on an indium-tin oxide substrate followed by respective sensitization of CdS and CdSe quantum dots on each side. As-fabricated photoanode exhibited strong absorption in nearly the entire visible spectrum up to 650 nm, with a high incident-photon-to-current-conversion efficiency (IPCE) of ∼45% at 0 V vs Ag/AgCl. On the basis on a single white light illumination of 100 mW/cm2, the photoanode yielded a significant photocurrent density of ∼12 mA/ cm2 at 0.4 V vs Ag/AgCl. The photocurrent and IPCE were enhanced compared to single quantum dot sensitized structures as a result of the band alignment of CdS and CdSe in electrolyte. Moreover, in comparison to single-sided cosensitized layered structures, this double-sided architecture that enables direct interaction between quantum dot and nanowire showed improved charge collection efficiency. Our result represents the first double-sided nanowirephotoanode that integrates uniquely two semiconductor quantum dots of distinct band gaps for PEC hydrogen generation and can be possibly applied to other applications such as nanostructured tandem photovoltaic cells. NanoLett. 2010, 10, 1088–1092
 hydrogen generation. The double-sided design represents a simple analogue of tandem cell structure, in which the dense ZnOnanowire arrays were grown on an indium-tin oxide substrate followed by respective sensitization of CdS and CdSe quantum dots on each side. As-fabricated photoanode exhibited strong absorption in nearly the entire visible spectrum up to 650 nm, with a high incident-photon-to-current-conversion efficiency (IPCE) of ∼45% at 0 V vs Ag/AgCl. On the basis on a single white light illumination of 100 mW/cm2, the photoanode yielded a significant photocurrent density of ∼12 mA/ cm2 at 0.4 V vs Ag/AgCl. The photocurrent and IPCE were enhanced compared to single quantum dot sensitized structures as a result of the band alignment of CdS and CdSe in electrolyte. Moreover, in comparison to single-sided cosensitized layered structures, this double-sided architecture that enables direct interaction between quantum dot and nanowire showed improved charge collection efficiency. Our result represents the first double-sided nanowirephotoanode that integrates uniquely two semiconductor quantum dots of distinct band gaps for PEC hydrogen generation and can be possibly applied to other applications such as nanostructured tandem photovoltaic cells. NanoLett. 2010, 10, 1088–1092.")
84
Summary Metal oxide nanomaterials offer great versatility in properties Optoelectronic properties can be tuned by choosing/controlling the synthesis protocol Hybridization with organic/molecular materials provide unique combinations of properties Low temperature and solution based processing is the key for future metal oxide based energy devices

85
Thank You!

86
10 millions times smaller
What is Nanoscale 1.27 × 10⁷ m ww.mathworks.com 0.22 m 0.7 × 10⁻⁹ m Fullerenes C60 12,756 Km 22 cm 0.7 nm 10 millions times smaller 1 billion times smaller

87
How Small is Nano Really ?

88
Large Surface to Volume Ratio
InP nanoparticles Quantum Phenomena Large Surface to Volume Ratio Gold nanoparticles of different sizes Passivated Carbon Nanodots Sun et al. JACS 128, 7756 (2006)
")
Similar presentations


 A nanoscale approach to materials.>")


