Download presentation
Presentation is loading. Please wait.

1
Solutions Manual Figures and Tables

2
Chapter 1 Equilibrium and Efficiency Figures and Tables

3
Exercise 1.13: Possible shares

4
Exercise 1.13: Faster rate of decline

5
Chapter 2 Equilibrium and Efficiency Figures and Tables

6
Exercise 2.4: Budget constraint

7
Exercise 2.7: Edgeworth box and equilibria

8
Exercise 2.7: Non-square Edgeworth box

9
Exercise 2.8: Indifference curves

10
Exercise 2.8: Improving welfare

11
Exercise 2.8: Equilibrium budget constraint

12
Exercise 2.11: Excess demand

13
Exercise 2.12: Profit

14
Exercise 2.13: Representation of fixed costs

15
Exercise 2.15: Possibility of non- production

16
Exercise 2.20: Indifference curves

17
Exercise 2.20: Every allocation is Pareto-efficient

18
Exercise 2.20: Efficient allocations on the boundary

19
Exercise 2.21: Pareto-efficient allocations

20
Exercise 2.12: Equilibrium

21
Exercise 2.22: Preferences of consumer 2

22
Exercise 2.22: Pareto-efficient allocations

23
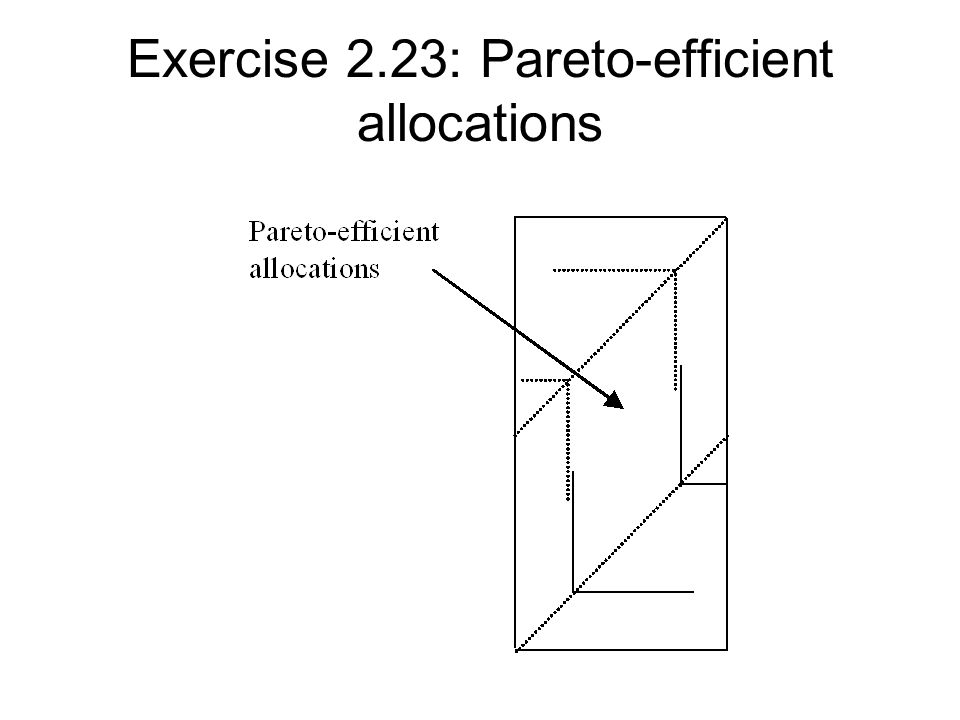
Exercise 2.23: Pareto-efficient allocations

25
Exercise 2.25: A Pareto-efficient allocation that cannot be decentralized

26
Chapter 3 Public Sector Statistics Figures

28
Chapter 5 Public Goods Figures and Tables

29
Chapter 6 Club Goods and Local Public Goods Figures

30
Chapter 7 Externalities Figures

31
Chapter 8 Imperfect Competition Figures and Tables

32
Chapter 9 Asymmetric Information Figures and Tables

33
Chapter 10 Political Economy Figures and Tables

34
Chapter 11 Rent-Seeking Figures

35
Chapter 12 Optimality and Comparability Figures and Tables

36
Chapter 13 Inequality and Poverty Figures and Tables

37
Chapter 14 Commodity Taxation Figures and Tables

38
Chapter 15 Income Taxation Figures and Tables

39
Chapter 16 Tax Evasion Figures and Tables

40
Chapter 17 Fiscal Federalism Figures and Tables

41
Chapter 18 Fiscal Competition Figures and Tables

42
Chapter 19 Intertemporal Efficiency Figures and Tables

43
Chapter 20 Social Security Figures and Tables

44
Chapter 21 Economic Growth Figures and Tables

Similar presentations