Download presentation
Presentation is loading. Please wait.

1
BEHAVIORAL CHARACTERISTICS OF LANDSCAPE STRUCTURE METRICS IN NEUTRAL LANDSCAPES FRAGSTATS Workshop 18, July 2003 IALE World Congress Darwin, Australia

2
Step 1: Generate binary neutral landscapes using the computer program RULE (Gardner 1999). 256 x 256 cell grids 5% Factorial Design H (n = 21) x P (n = 19) H (n = 21) x P (n = 19) 100 replicates of each of 399 H x P combinations 1 Increasing aggregation (H) 0 Increasing area (P) 95%
 x P (n = 19) H (n = 21) x P (n = 19) 100 replicates of each of 399 H x P combinations 1 Increasing aggregation (H) 0 Increasing area (P) 95%.")
3
FRAGSTATS Specifications: 30 m cell size30 m cell size 90 m edge depth90 m edge depth 500 m search radius500 m search radius 8 cell neighbor rule8 cell neighbor rule No borderNo border No backgroundNo background Boundary not included as edgeBoundary not included as edge Step 2: Calculate 55 applicable class-level metrics on all 39,900 neutral landscapes using FRAGSTATS.

4
Conceptual Metric Classification Area/Edge/Density Class Area Percent of Landscape Patch Density Edge Density Landscape Shape Index Largest Patch Index Normalized Shape Index Patch Area* Radius of Gyration* Shape Perimeter Area Fractal Perimeter Area Ratio* Shape Index* Fractal Dimension Index* Core Area Total Core Area Core Percent of Landscape # Disjunct Core Areas Disjunct Core Area Density Core Area Disjunct Core Area* Core Area Index* Isolation/Proximity Proximity Index* Similarity Index* Euclidean Nearest Neighbor* Contagion/Interspersion Percent Like Adjacencies Clumpiness Index Aggregation Index Intersperson and Juxtapostion Index Landscape Division Splitting Index Effective Mesh Size Connectivity Patch Cohesion Index Contrast Contrast Weighted Edge Density Total Edge Contrast Index Edge Contrast*

5
Conceptual Metric Classification Area/Edge/DensityCAPLANDPDEDLSILPInLSIAREA*GYRATE* ShapePAFRACPARA*SHAPE*FRAC* Core Area TCACPLANDNDCADCADCORE*DCORE*CAI* Isolation/ProximityPROX*SIMI*ENN* Contagion/InterspersionPLADJCLUMPYAIIJIDIVISIONSPLITMESH ConnectivityCOHESIONContrastCWEDTECIECON*

6
Metric Behavior P H

7
Calculate metrics in landscapes from three geographically distinct regions in the United States:Calculate metrics in landscapes from three geographically distinct regions in the United States: –Idaho (221 landscapes, 5 classes) –Western Massachusetts (155 landscapes, 7 classes) –Colorado (152 landscapes, 4 classes) Superimpose values from real landscapes onto values from neutral landscapes.Superimpose values from real landscapes onto values from neutral landscapes. Step 4: Plot the range of the H x P space that real landscapes occupy

9
Metric Behavior P H

12
Use cluster analysis to classify metrics based on behavior along P and H gradients.Use cluster analysis to classify metrics based on behavior along P and H gradients. Graphically compare behavior of metrics.Graphically compare behavior of metrics. Step 5: Evaluate patterns of class-level metric behavior in using mean metric values for 48 metrics.

13
Primarily a Function of P AREA_AMAREA_SDGYRATE_AMGYRATE_SDCORE_AMCORE_SDTCADCORE_AMDCORE_SDPROX_MNPROX_CVPROX_SDDIVISIONMESH P H LPI

14
Primarily a Function of H: Strongly Related to H nLSIPARA_SDFRAC_CVFRAC_SDCAI_SDCLUMPY PAFRAC

15
CLUMPY

16
Related to Interaction of P and H Parabolic Response Along P LSIPDGYRATE_CVFRAC_AMSHAPE_AMSHAPE_CVSHAPE_SDPROX_AMDCORE_CVDCAD ED

17
DCAD SHAPE_SD FRAC_AM

18
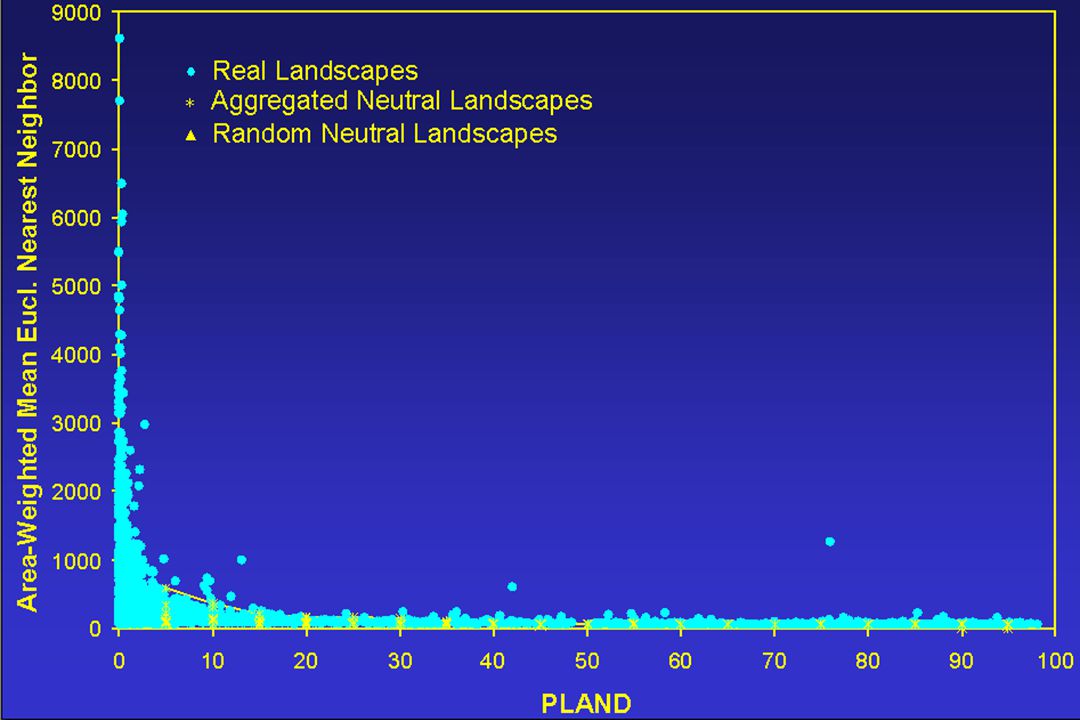
Related to Interaction of P and H GYRATE_MNPARA_AMCORE_MNDCORE_MNCAI_AMCAI_MNSPLITPLADJAICOHESIONENN_AMENN_MNENN_CVENN_SD AREA_MN

19
COHESION ENN_AM GYRATE_MN PARA_AM

20
Differential Metric Sensitivity AREA_MN AREA_AM P = 5% P = 50% P = 95% H = 0 P = 5% P = 50% P = 95% H = 1

21
**Limitations** Results are based onResults are based on –binary neutral landscapes. –at one scale. –only one configuration gradient (H). Varying shape, inter- patch distance, etc. would yield different behavior. Identified 7 behavioral groups with varying relationships with P and H.Identified 7 behavioral groups with varying relationships with P and H. Conceptual similarity ≠ behavioral similarity.Conceptual similarity ≠ behavioral similarity. Many metrics have non-linear behavior and lack of sensitivity in at least part of the H x P space.Many metrics have non-linear behavior and lack of sensitivity in at least part of the H x P space. –Problematic conditions do not always exist in real landscapes. Very few metrics measure configuration independent of area – most confound P & H.Very few metrics measure configuration independent of area – most confound P & H. Main Points
. Varying shape, inter- patch distance, etc. would yield different behavior. Identified 7 behavioral groups with varying relationships with P and H.Identified 7 behavioral groups with varying relationships with P and H. Conceptual similarity ≠ behavioral similarity.Conceptual similarity ≠ behavioral similarity. Many metrics have non-linear behavior and lack of sensitivity in at least part of the H x P space.Many metrics have non-linear behavior and lack of sensitivity in at least part of the H x P space. –Problematic conditions do not always exist in real landscapes. Very few metrics measure configuration independent of area – most confound P & H.Very few metrics measure configuration independent of area – most confound P & H. Main Points.")
Similar presentations


. Hierarchical Clustering Produces a set of nested clusters organized as a hierarchical tree Can be visualized as a dendrogram –A tree like.>")


 Form and Structure Describing primary and secondary spatial elements Explanation of spatial.>")
>")


