Download presentation
Presentation is loading. Please wait.

1
Market Timing and Capital Structure
Presenter: 張鳯逸 邱麗卿

2
Motivation 1: The exist of “equity market timing”.
Firms tend to issue equity when market value is high, relative to book value and past market values, and repurchase equity when market value is low. The findings are difficult to reconcile with the MM’s capital structure irreverent theory. In inefficient or segmented capital markets, market timing benefits ongoing shareholders at the expense of entering and exiting ones. Managers thus have incentives to time the market. The motivation of this study is that the authors trace capital structure to past market valuations; they find that firms tend to issue equity when market value is high, relative to book value and past market values, and repurchase equity when market value is low. MM’s capital structure irreverent theory The theory indicates that In the efficient and integrated capital markets the costs of different forms of capital do not vary independently, so there is no gain from opportunistically switching between equity and debt. In capital markets that are inefficient or segmented, by contrast, market timing benefits ongoing shareholders at the expense of entering and exiting ones. Managers thus have incentives to time the market if they think it is possible and if they care more about ongoing shareholders.

3
Motivation 2: Many corporate financing decisions depend on equity market timing. There is evidence in four different kinds of studies. studies findings financing decisions firms tend to issue equity instead of debt when market value is high and tend to repurchase equity when market value is low long-run stock returns equity market timing is successful on average earnings forecasts firms tend to issue equity at times when investors are rather too enthusiastic about earnings prospects market timing surveys managers admit to market timing analyses of actual financing decisions show that firms tend to issue equity instead of debt when market value is high and tend to repurchase equity when market value is low. analyses of long-run stock returns following corporate finance decisions suggest that equity market timing is successful on average. Firms issue equity when the cost of equity is relatively low and repurchase equity when the cost is relatively high. analyses of earnings forecasts and realizations around equity issues suggest that firms tend to issue equity at times when investors are rather too enthusiastic about earnings prospects. perhaps most convincing, managers admit to market timing in anonymous surveys. Graham and Harvey (2001) find that two-thirds of CFOs agree that “the amount by which our stock is undervalued or overvalued was an important or very important consideration” in issuing equity, and nearly as many agree that “if our stock price has recently risen, the price at which we can sell is ‘high’” ~p. 216!. In that survey as a whole, equity market prices are regarded as more important than 9 out of 10 other factors considered in the decision to issue common stock, and more important than all 4 other factors considered in the decision to issue convertible debt.
 find that two-thirds of CFOs agree that the amount by which our. stock is undervalued or overvalued was an important or very important consideration in. issuing equity, and nearly as many agree that if our stock price has recently risen, the price. at which we can sell is ‘high’ ~p. 216!. In that survey as a whole, equity market prices are. regarded as more important than 9 out of 10 other factors considered in the decision to issue. common stock, and more important than all 4 other factors considered in the decision to issue. convertible debt.")
4
Purpose and conclusion 1:
We would like to know how equity market timing affects capital structure. The basic question is whether market timing has a short-run or a long-run impact. One expects at least a mechanical, short-run impact. If firms subsequently rebalance away the influence of market timing financing decisions, then market timing would have no persistent impact on capital structure. The conclusion is that market timing has large, persistent effects on capital structure. Our first goal is purely empirical. We connect capital structure to past market valuations. we ask how equity market timing affects capital structure. The basic question is whether market timing has a short-run or a long-run impact. One expects at least a mechanical, short-run impact. However, if firms subsequently rebalance away the influence of market timing financing decisions, as normative capital structure theory recommends, then market timing would have no persistent impact on capital structure. .

5
Purpose and conclusion 2:
The results are explained with some theory of capital structure. Theory Views Result Trade-off theory Market-to-book is an indicator of investment opportunities, risk, agency, or some other determinant of the optimal tradeoff between equity and debt. inconsistent Pecking order theory Firms with upcoming investment opportunities may reduce leverage to avoid issuing equity in the future. Inconsistent Managerial entrenchment theory High market valuations allow managers to add equity but also allow them to become entrenched, resisting the debt finance necessary to restore debt to the optimum. consistent Market timing theory Capital structure is the cumulative outcome of attempts to time the equity market. Our second goal is to explain the results with some theory of capital structure. We consider four theories. The first is the tradeoff theory, which views market-to-book as an indicator of investment opportunities, risk, agency, or some other determinant of the optimal tradeoff between equity and debt. The second theory we consider is the pecking order of Myers (1984), which views market-to-book as an indicator of investment opportunities. The third theory of managerial entrenchment theory in Zwiebel (1996), high valuations and good investment opportunities facilitate equity finance, but at the same time allow managers to become entrenched. The fourth theory of capital structure that we consider is based on market timing. This theory maintains that managers try to time their financing decisions to exploit what they perceive as market mispricing. This theory regards market-to-book, particularly the within-firm time-series variation in market-to-book, as an indicator of perceived market-timing opportunities
, which views market-to-book as an indicator of investment opportunities. The third theory of managerial entrenchment theory in Zwiebel (1996), high valuations and good investment opportunities facilitate equity finance, but at the same time allow managers to become entrenched. The fourth theory of capital structure that we consider is based on market timing. This theory maintains that managers try to time their financing decisions to exploit what they perceive as market mispricing. This theory regards market-to-book, particularly the within-firm time-series variation in market-to-book, as an indicator of perceived market-timing opportunities.")
6
Capital Structure and Past Market Valuations
Data The whole sample includes 2,893 observations on firms that went public between 1968 and 1998. We require an IPO date for two reasons: The IPO is itself an important financing decision that is connected empirically to the market-to-book ratio. Allow us to study the evolution of capital structure. We exclude financial firms, firms with a minimum book value of assets below $10 million, firms without complete data on total assets, and individual firm-year outliers for capital structure (book leverage is above one) and the market-to-book ratio (whic is above 10).
 and the market-to-book ratio (whic is above 10).")
7
Summary Statistics Panel A of Table I summarizes leverage and financing for this sample We use the book and market value debt-to-assets ratio (leverage) to measure capital structure (definitions follow Fama and French (2000)). Book leverage decreases sharply following the IPO. Over the next 10 years, it rises slightly, while market value leverage rises more strongly; this is indeed an age effect, not a survival effect. A book value measure of capital structure also avoids any mechanical link between the market-to-book ratio and market value equity-to-assets. The residual change in assets is equal to the sum of net equity issues (e/A), newly retained earnings (۵RE/A) and net debt issues (d/A). The table shows that on average, following the IPO, the annual change in assets is driven roughly 50 percent by net debt issues, 35 percent by net equity issues, and 15 percent by newly retained earnings. Recent calendar trends in this sample include a decrease in market leverage, an increase in equity issues, and a decrease in internal finance. The decrease in market leverage reflects the historically high market valuations prevailing at the end of the 1990s. The concurrent increase in equity issues is suggestive of market timing. These trends also reflect the many newly public firms that appear near the end of the COMPUSTAT sample in 1999.
 to measure capital structure (definitions follow Fama and French (2000)). Book leverage decreases sharply following the IPO. Over the next 10 years, it rises slightly, while market value leverage rises more strongly; this is indeed an age effect, not a survival effect. A book value measure of capital structure also avoids any mechanical link between the market-to-book ratio and market value equity-to-assets. The residual change in assets is equal to the sum of net equity issues (e/A), newly retained earnings (۵RE/A) and net debt issues (d/A). The table shows that on average, following the IPO, the annual change in assets is driven. roughly 50 percent by net debt issues, 35 percent by net equity issues, and 15 percent by newly retained earnings. Recent calendar trends in this sample include a decrease in market leverage, an increase. in equity issues, and a decrease in internal finance. The decrease in market leverage reflects the historically high market valuations prevailing at the end of the 1990s. The concurrent increase in equity issues is suggestive of market timing. These trends also reflect the many newly public firms that appear near the end of the COMPUSTAT sample in")
8
The main result of table I: The exist of equity market timing
Book leverage decreases sharply following the IPO. Over the next 10 years, it rises slightly, while market value leverage rises more strongly; this is indeed an age effect, not a survival effect. The decrease in market leverage reflects the historically high market valuations prevailing at the end of the 1990s. The concurrent increase in equity issues is suggestive of market timing.

9
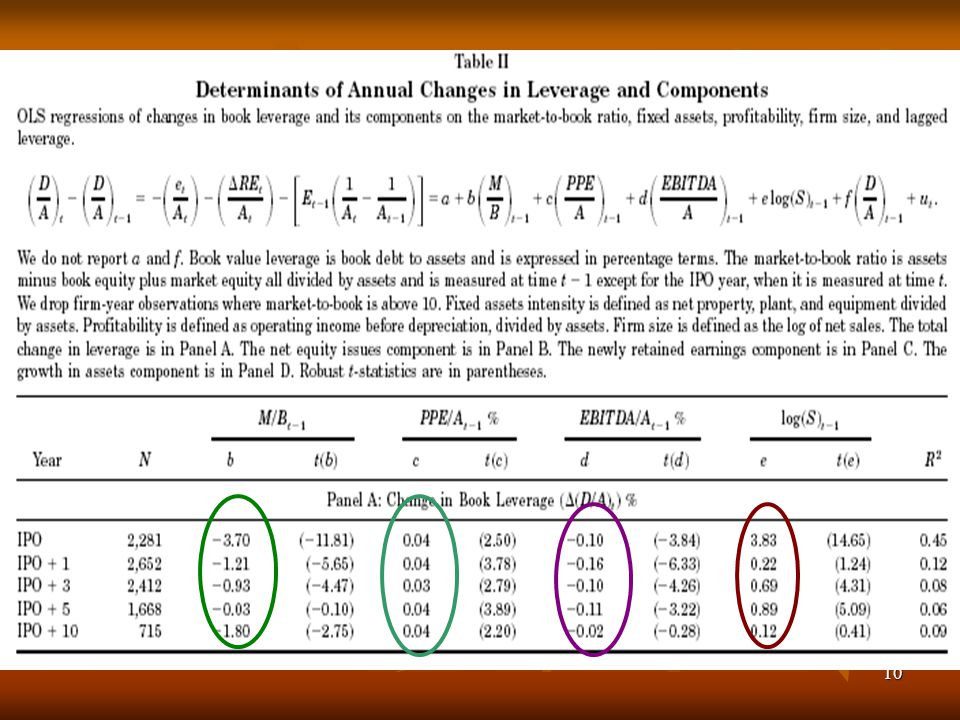
Determinants of Annual Changes in Leverage
Here we decompose the change in leverage to examine whether the effect comes through net equity issues, as market timing implies. We also use three other variables that Rajan and Zingales (1995) find to be correlated to leverage in several developed countries: asset tangibility, profitability, and firm size. Here we document the net effect of market-to-book on the annual change in leverage. Then we decompose the change in leverage to examine whether the effect comes through net equity issues, as market timing implies.
 find to be correlated to leverage in several developed countries: asset tangibility, profitability, and firm size. Here we document the net effect of market-to-book on the annual change in leverage. Then we decompose the change in leverage to examine whether the effect comes through net equity issues, as market timing implies.")
11
The results of panel A of table II are generally consistent with theoretical priors.
Variables (lagged value) Expected sign Empirical sign M/B ratio - PPE/A ratio + EBITDA/A ratio + or - Log (S) f (D/A) When leverage is near one of these boundaries, the change in leverage can only go in one direction, regardless of the values of the other variables. When leverage is near one of these boundaries, the change in leverage can only go in one direction, regardless of the values of the other variables. Not controlling for lagged leverage may obscure the effects of the other variables. The more interesting results are as follows. The net effect of high market-to-book is to lower leverage. At IPO 1 3, a one standard deviation increase in market-to-book is associated with a 1.14 percentage-point decrease in leverage. This is consistent with the idea that firms increase equity when market valuations are high, but it does not rule out a channel through higher retained earnings or lower debt, for example. The other columns show that tangible assets tend to increase leverage (by 0.69 percentage points per standard deviation increase), profitability tends to reduce leverage (by 1.40 percentage points per standard deviation increase), and size tends to increase leverage (by 0.95 percentage points per standard deviation increase). The results are generally consistent with theoretical priors. Regarding the other variables, tangible assets may be used as collateral and so are associated with higher leverage. Profitability is associated with the availability of internal funds and thus may be associated with less leverage under the pecking order theory. A related but simpler hypothesis is that this relationship arises from the indifferent or tax-advantaged retention of earnings in a Modigliani and Miller environment. A third hypothesis is that profitable firms face more free cash flow problems in which case an effective governance structure might call for more leverage (Jensen (1986)). Finally, size may increase leverage if large firms are less likely to enter financial distress.
 Expected sign. Empirical sign. M/B ratio. - PPE/A ratio. + EBITDA/A ratio. + or - Log (S) f (D/A) When leverage is near one of these boundaries, the. change in leverage can only go in one direction, regardless of the values of the other variables. When leverage is near one of these boundaries, the change in leverage can only go in one direction, regardless of the values of the other variables. Not controlling for lagged leverage may obscure the effects of the other variables. The more interesting results are as follows. The net effect of high market-to-book is to lower leverage. At IPO 1 3, a one standard deviation increase in market-to-book is associated with a 1.14 percentage-point decrease in leverage. This is consistent with the idea that firms increase equity when market valuations are high, but it does not rule out a channel through higher retained earnings or lower debt, for example. The other columns show that tangible assets tend to increase leverage (by 0.69 percentage points per standard deviation increase), profitability tends to reduce leverage (by 1.40 percentage points per standard deviation increase), and size tends to increase leverage (by 0.95 percentage points per standard deviation increase). The results are generally consistent with theoretical priors. Regarding the other variables, tangible assets may be used as collateral and so are associated with higher leverage. Profitability is associated with the availability of internal funds and thus may be associated with less leverage under the pecking order theory. A related but simpler hypothesis is that this relationship arises from the indifferent or tax-advantaged retention of earnings in a Modigliani and Miller environment. A third hypothesis is that profitable firms face more free cash flow problems in which case an effective governance structure might call for more leverage (Jensen (1986)). Finally, size may increase leverage if large firms are less likely to enter financial distress.")
12
The change in leverage can be decomposed as follows:
We further examine whether market-to-book affects leverage through net equity issues, as market timing implies. To regress each of these three components of changes in leverage on the market-to-book ratio and the other independent variables..

13
The clear result is that market-to-book affects leverage through net equity issues.
Panel B shows that higher market-to-book is associated with higher net equity issues, consistent with the results of Marsh (1982) and others (note the sign of the dependent variable). Panel C shows that market-to-book is not strongly related to retained earnings, ruling out the possibility that market-to-book affects leverage because it forecasts earnings. Panel D shows that market-to-book is positively related to growth in assets, an effect that tends to increase leverage. This reflects the total effect of market-to-book on net equity issues, net debt issues, and newly retained earnings. By equation (2), the sum of the coefficients in Panels B, C, and D is equal to the total effect in Panel A. The clear result is that market-to-book affects leverage through net equity issues.
 and others (note the sign of the dependent variable). Panel C shows that market-to-book is not strongly related to retained earnings, ruling out the possibility that market-to-book affects leverage because it forecasts earnings. Panel D shows that market-to-book is positively related to growth in assets, an effect that tends to increase leverage. This reflects the total effect of market-to-book on net equity issues, net debt issues, and newly retained earnings. By equation (2), the sum of the coefficients in Panels B, C, and D is equal to the total effect in Panel A. The clear result is that market-to-book affects leverage through net equity issues.")
14
Two interesting patterns are worth noting:
The effect of profitability on changes in leverage arises primarily because of retained earnings. Profitable firms issue less equity (+), but this effect is more than offset by higher retained earnings(-), so that the net effect of higher profits is to reduce leverage. Firm size plays an important role at the time of the IPO. Panel A shows that the reduction in leverage that occurs at the IPO is much smaller for large firms. Panel B shows that large firms issue less equity.
, but this effect is more than offset by higher retained earnings(-), so that the net effect of higher profits is to reduce leverage. Firm size plays an important role at the time of the IPO. Panel A shows that the reduction in leverage that occurs at the IPO is much smaller for large firms. Panel B shows that large firms issue less equity.")
15
Determinants of Leverage
Market timing could be just a local opportunism whose effect is quickly rebalanced away. If managers do not rebalance to some target leverage ratio market timing may have persistent effects, and historical valuations will help to explain why leverage ratios differ. How to measure the relevant historical variation in market valuations? We have established that market-to-book affects leverage, in the short run, mainly through net equity issues. Whether or not this helps us to understand the cross section of leverage depends on persistence. Market timing could be just a local opportunism whose effect is quickly rebalanced away.

16
A measure of historical variation in the market-to-book ratio
It is the “external finance weighted-average” market-to-book ratio. e and d denote net equity and net debt issues, respectively. The intuitive motivation for this weighting scheme is that external financing events represent practical opportunities to change leverage. This variable takes high values for firms that raised external finance when the market-to-book ratio was high and vice-versa. It therefore gives more weight to valuations that prevailed when significant external financing decisions were being made, whether those decisions ultimately went toward debt or equity.

17
Univariate regression
First we evaluate the univariate explanatory power of determinants of capital structure as corporations age. Where X includes M/B, PPE/A, EBITDA/A, log(S), D/BE, D/ME, Dp/A and RD/A ratios. Book value leverage is book debt to assets. We consider eight independent variables, and each one is defined in two ways. External finance is defined as net equity issues plus net debt issues. Where this is negative, the weight is set to zero. Market-to-book is assets minus book equity plus market equity all divided by assets. We drop firm-year observations where market-to-book is above 10. Fixed assets intensity is defined as net property, plant, and equipment divided by assets. Profitability is defined as operating income before depreciation divided by assets. Firm size is defined as the log of net sales. Common dividends are scaled by book equity and market equity. Depreciation expense is scaled by assets. R&D is defined as research and development expense divided by assets.
, D/BE, D/ME, Dp/A and RD/A ratios. Book value leverage is book debt to assets. We consider eight independent variables, and each. one is defined in two ways. External finance is defined as net equity issues plus net debt issues. Where this is negative, the weight is set to zero. Market-to-book is assets minus book equity plus market equity all divided by assets. We drop firm-year observations where market-to-book is above 10. Fixed assets intensity is defined as net property, plant, and equipment divided by assets. Profitability is defined as operating income before depreciation divided by assets. Firm size is defined as the log of net sales. Common dividends are scaled by book equity and market equity. Depreciation expense is scaled by assets. R&D is defined as research and development expense divided by assets.")
18
Figure 1. The growing gap between the dashed line and the solid line means that historical valuation information becomes increasingly relevant for firms.

19
New light on the dynamics of capital structure:
The weighted average market-to-book, profitability and RD expense have stronger explanatory power. The weight scheme does not improve the performance of all variables. Historical information adds incremental value only to market-to-book and profitability. When firms go public, their capital structure reflects a number of factors, including market-to-book, asset tangibility, size and research and development intensity. As firms age, the cross-section of leverage is more and more explained by past financing opportunities, and past opportunities to accumulate retained earnings. Figure 1 shows the R2 for univariate regressions run in IPO time The solid line uses the year t - 1 value. The dashed line uses an external finance weighted-average value from the IPO year through year t - 1. Figure 1 sheds new light on the dynamics of capital structure.

20
I. Capital Structure and Past Market Valuations
Three separate ways to document the influence of past market valuations on capital structure is persistent. Leverage regressions that control for the current M/B. (Table 3 & Table 4) Regressions that control for the initial capital structure level and look at how subsequent fluctuations in M/B move capital structure away from initial level.(Table 5) Direct looking at the power of lagged values of the weighted average M/B variable. (Regression system and Table 6)
 Regressions that control for the initial capital structure level and look at how subsequent fluctuations in M/B move capital structure away from initial level.(Table 5) Direct looking at the power of lagged values of the weighted average M/B variable. (Regression system and Table 6)")
21
I. Capital Structure and Past Market Valuations
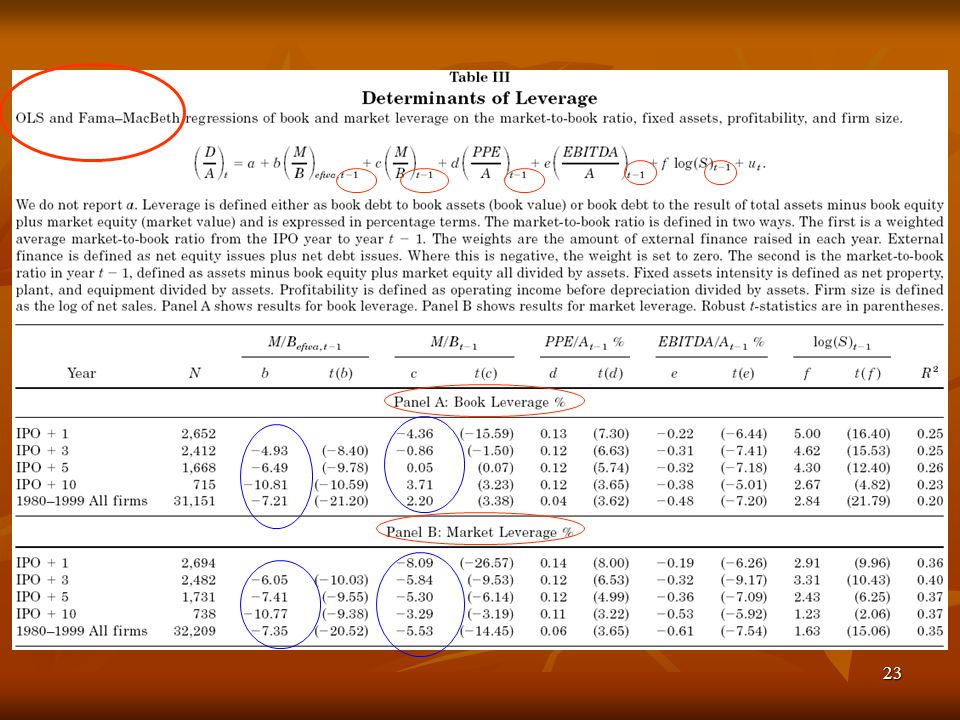
C. Determinants of Leverage (Multivariate regressions) Table 3: Multivariate regressions of book and market leverage on the weighted average M/B and the four Rajan and Zingales(1995) variables. Regression model : The simultaneous inclusion of M/Bt-1 controls for current cross-sectional variation in the level of market-to-book. What is left for M/Befwa is the residual influence of past, within-firm variation in market-to-book.
 Table 3: Multivariate regressions of book and market leverage on the weighted average M/B and the four Rajan and Zingales(1995) variables. Regression model : The simultaneous inclusion of M/Bt-1 controls for current cross-sectional variation in the level of market-to-book. What is left for M/Befwa is the residual influence of past, within-firm variation in market-to-book.")
22
I. Capital Structure and Past Market Valuations
Results (Table 3): M/Befwa enters with a negative coefficient and its effect is stronger and more consistent than M/Bt-1, especially in book leverage. The importance of historical valuation information is also apparent in the 1980 to 1999 All Firms sample. Historical within-firm variation in market-to-book, not current cross-firm variation, is more important in explaining the cross section of leverage. The weighted average market-to-book is generally the single most economically important of these variables. As firms age, the effect of past market valuations becomes even more prominent, consistent with the impressions from Figure 1.
: M/Befwa enters with a negative coefficient and its effect is stronger and more consistent than M/Bt-1, especially in book leverage. The importance of historical valuation information is also apparent in the 1980 to 1999 All Firms sample. Historical within-firm variation in market-to-book, not current cross-firm variation, is more important in explaining the cross section of leverage. The weighted average market-to-book is generally the single most economically important of these variables. As firms age, the effect of past market valuations becomes even more prominent, consistent with the impressions from Figure 1.")
24
I. Capital Structure and Past Market Valuations
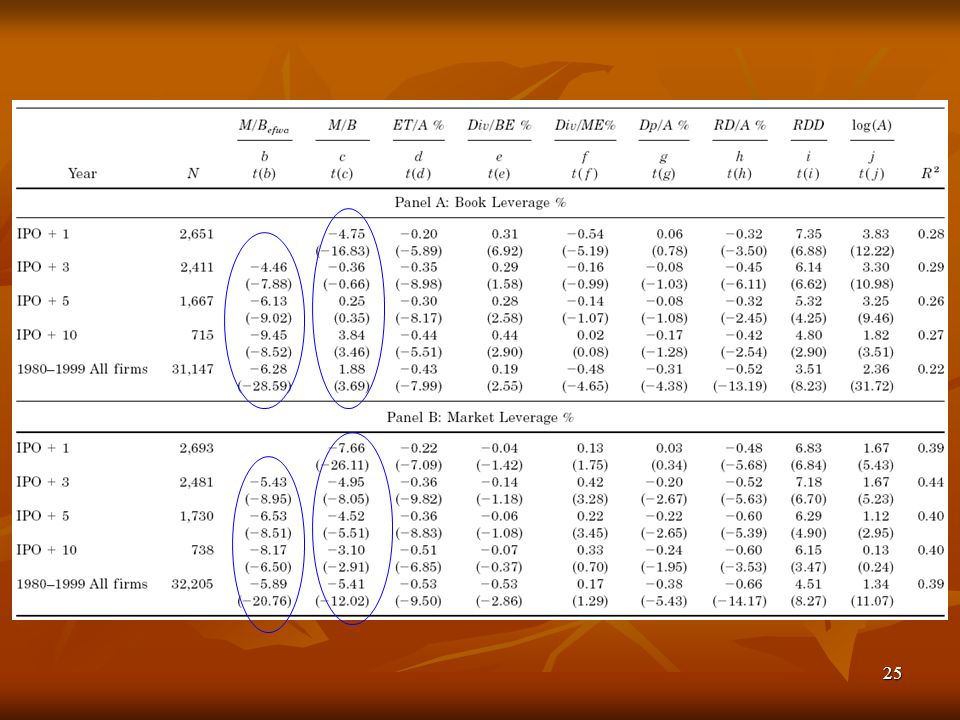
Table 4: OLS and Fama–MacBeth regressions of leverage on determinants suggested by Fama and French(2000). Regression model : Results (Table 4): The coefficient on the weighted average market-to-book is not sensitive to this change in control variables.
. Regression model : Results (Table 4): The coefficient on the weighted average market-to-book is not sensitive to this change in control variables.")
26
D. Persistence Two main results which have been documented:
High market valuations reduce leverage in the short run. Historically high market valuations are associated with lower leverage in the cross section. The connection between these two results must be that the M/B effect is very persistent.(Table 5 & Table 6 report the degree and magnitude of this persistence)
")
27
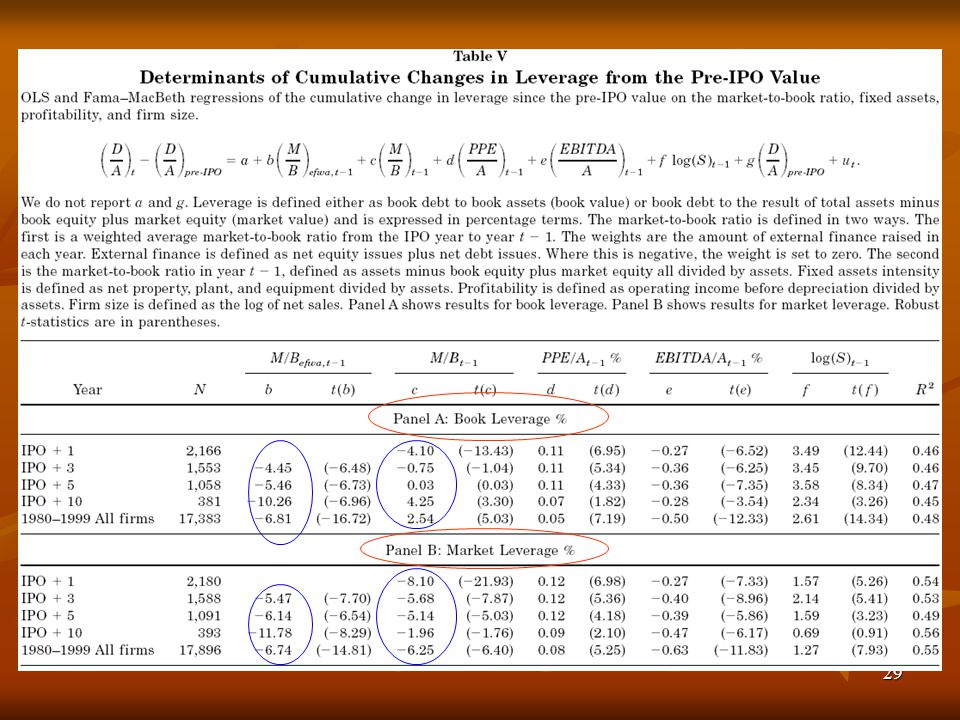
D. Persistence Table 5: Regressions of cumulative changes in leverage from the pre-IPO value on the R&Z(1995) variables plus the pre-IPO value of leverage. Regression model: The dependent variable includes the effect of the IPO itself. This is useful because the IPO is a critical financing event known to be connected to market value.
 variables plus the pre-IPO value of leverage. Regression model: The dependent variable includes the effect of the IPO itself. This is useful because the IPO is a critical financing event known to be connected to market value.")
28
D. Persistence Estimation method: OLS and Fama-MacBeth regression
Results(Table 5): The determinants of cumulative changes in leverage are essentially the same, in sign and magnitude, as the determinants of leverage levels reported in Table III. The weighted average M/B is the most economically important variable. The weighted average M/B result is unlikely to reflect an omitted firm characteristic that would also influence initial leverage. It provides more evidence that market valuations have effects on capital structure that persist and therefore accumulate over time.
: The determinants of cumulative changes in leverage are essentially the same, in sign and magnitude, as the determinants of leverage levels reported in Table III. The weighted average M/B is the most economically important variable. The weighted average M/B result is unlikely to reflect an omitted firm characteristic that would also influence initial leverage. It provides more evidence that market valuations have effects on capital structure that persist and therefore accumulate over time.")
30
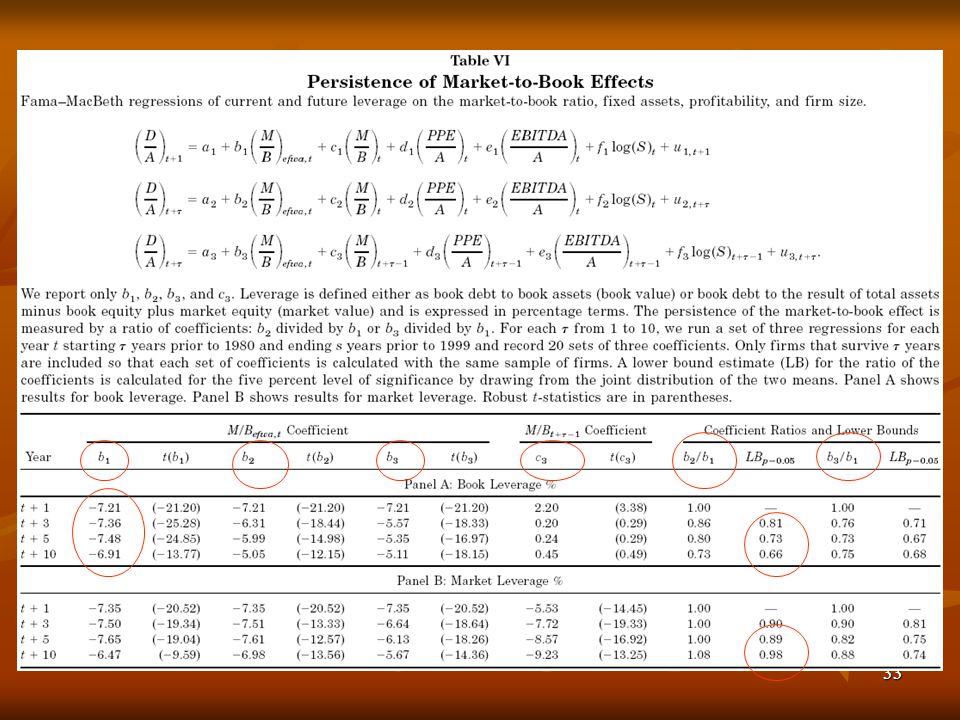
D. Persistence Table 6: takes a direct look at the persistence of the effect of past valuations. Regression system: Estimation method: Fama-MacBeth regression The persistence of the market-to-book effect is measured by a ratio of coefficients: b2 divided by b1 or b3 divided by b1.(trade-off theory)
")
31
D. Persistence M/Befwa,t D/At+1 D/At+
For each from 1 to 10, run a set of three regressions for each year t starting years prior to 1980 and ending s years prior to 1999 and record 20 sets of three coefficients. Only firms that survive years are included so that each set of coefficients is calculated with the same sample of firms. M/Befwa,t D/At+1 D/At+ Control variables Control variables t 1980 1999

32
D. Persistence Results(Table 6):
The first and second columns show that this survival effect is small. b2 and b3 both remain strongly significant for at least 10 years.(b3 even control for current M/B and other characteristics) In book values, b3 is several times the size of the c3 coefficients. Thus the historical path of M/B, even calculated with data over 10 years old, is much more influential than the current M/B. In market values, b3 is also substantial relative to c3. For book leverage, b2 divided by b1 is still 0.73 after 10 years; 73 percent of the initial effect is still apparent 10 years later. By any practical definition, the effect is permanent. The last columns report a lower bound estimate of this ratio, calculated by drawing values of b1 and b2 from the joint distribution of the two estimates.
 In book values, b3 is several times the size of the c3 coefficients. Thus the historical path of M/B, even calculated with data over 10 years old, is much more influential than the current M/B. In market values, b3 is also substantial relative to c3. For book leverage, b2 divided by b1 is still 0.73 after 10 years; 73 percent of the initial effect is still apparent 10 years later. By any practical definition, the effect is permanent. The last columns report a lower bound estimate of this ratio, calculated by drawing values of b1 and b2 from the joint distribution of the two estimates.")
34
II. Discussion Trade-off Theory
MM(1958): capital structure is irrelevant. The trade-off theory determines an optimal capital structure by adding various imperfections. Higher taxes on dividends Higher nondebt tax shields Higher costs of financial distress Investment opportunities Agency problems Most relevant: costly financial distress Firms with substantial growth and investment opportunities have the most to lose when overhanging debt prevents new capital from being raised or leads to an inefficient bankruptcy negotiation during which some investment opportunities are forever lost. Testable prediction: Capital structure eventually adjusts to changes in the M/B. The past, temporary fluctuations captured in M/Befwa should no longer matter(b2 and b3 should be zero).
: capital structure is irrelevant. The trade-off theory determines an optimal capital structure by adding various imperfections. Higher taxes on dividends Higher nondebt tax shields Higher costs of financial distress Investment opportunities Agency problems Most relevant: costly financial distress. Firms with substantial growth and investment opportunities have the most to lose when overhanging debt prevents new capital from being raised or leads to an inefficient bankruptcy negotiation during which some investment opportunities are forever lost. Testable prediction: Capital structure eventually adjusts to changes in the M/B. The past, temporary fluctuations captured in M/Befwa should no longer matter(b2 and b3 should be zero).")
35
II. Discussion A. Trade-off Theory B. Pecking Order Theory
Empirical evidence: past variation in market valuations is more important than several other variables suggested as determinants of the current optimum, including the current market valuation. inconsistent with Trade-off Theory B. Pecking Order Theory Raising external finance is costly.(information, discount) There is no optimal capital structure.(deviating from optimum vs. external finance) Managers will follow a pecking order, using up internal funds first, then using up risky debt, and finally resorting to equity. In the absence of investment opportunities, firms retain profits and build up financial slack to avoid having to raise external finance in the future.
 There is no optimal capital structure.(deviating from optimum vs. external finance) Managers will follow a pecking order, using up internal funds first, then using up risky debt, and finally resorting to equity. In the absence of investment opportunities, firms retain profits and build up financial slack to avoid having to raise external finance in the future.")
36
II. Discussion B. Pecking Order Theory
Static version: periods of high investment opportunities will tend to push leverage higher toward a debt capacity. Empirical evidence: such periods tend to push leverage lower. inconsistent with static version Dynamic version: high growth firms reduce leverage in order to avoid raising equity as investment opportunities arise in the future.(a relationship between leverage and future investment opportunities) Empirical evidence: high M/B firms reduce leverage through issuing equity, not through retaining earnings.(leverage is much more strongly determined by past values of market-to-book.) inconsistent with dynamic version
 Empirical evidence: high M/B firms reduce leverage through issuing equity, not through retaining earnings.(leverage is much more strongly determined by past values of market-to-book.) inconsistent with dynamic version.")
37
II. Discussion C. Managerial Entrenchment Theory
High valuations and good investment opportunities facilitate equity finance, but at the same time allow managers to become entrenched. This has a market-timing flavor, since managers issue equity when valuations are high and do not subsequently rebalance, but a very different interpretation. Managers are not attempting to exploit new investors. Rather, they are exploiting existing investors ex post by not rebalancing. Prior studies support the first view.

38
II. Discussion D. Market Timing Theory
Capital structure evolves as the cumulative outcome of past attempts to time the equity market. Two versions: Rational managers and investors and adverse selection costs Irrational investors ( or managers) and time-varying mispricing 1.Adverse selection costs(information asymmetrycost) Firms tend to announce equity issues following releases of information, which may reduce information asymmetry. Temporary fluctuations in the M/B measure variations in adverse selection. If the costs of deviating from an optimal capital structure are small compared to the resulting variation in issuing costs, past variation in the M/B can then have long-lasting effects as we observe.
 and time-varying mispricing. 1.Adverse selection costs(information asymmetrycost) Firms tend to announce equity issues following releases of information, which may reduce information asymmetry. Temporary fluctuations in the M/B measure variations in adverse selection. If the costs of deviating from an optimal capital structure are small compared to the resulting variation in issuing costs, past variation in the M/B can then have long-lasting effects as we observe.")
39
II. Discussion D. Market Timing Theory Mispricing
Managers issue equity when they believe its cost is irrationally low and repurchase equity when they believe its cost is irrationally high. If managers are trying to exploit too-extreme expectations, net equity issues will be positively related to M/B. If there is no optimal capital structure, managers need not reverse these decisions when the firm appears to be correctly valued and the cost of equity appears to be normal, leaving temporary fluctuations in M/B to have permanent effects on leverage.

40
II. Discussion D. Market Timing Theory Empirical evidence:
The results support market timing theory, but do not discriminate between these two versions of market timing. The evidence that distinctly supports the mispricing version comes from the low long-run stock returns following equity issues and the high long-run returns following repurchases. (long-run abnormal returns to equity issuers vs. the announcement effects of equity issues )
")
41
II. Discussion Theory Optimal capital structure Interpretations of M/B
Testable prediction Empirical evidence Trade-off Theory Yes Growth and investment opportunities (or risk, agency) inconsistent Pecking Order Theory No Investment opportunities Managerial Entrenchment Theory Market timing ---- Market Timing Theory Market timing opportunities (mispricing or variations in adverse election) Support but can not discriminate between these two versions
 inconsistent. Pecking Order Theory. No. Investment opportunities. Managerial Entrenchment Theory. Market timing Market Timing Theory. Market timing opportunities. (mispricing or variations in adverse election) Support but can not discriminate between these two versions.")
42
III. Conclusion Low-leverage firms tend to be those that raised funds when their valuations were high, and conversely high-leverage firms tend to be those that raised funds when their valuations were low. Fluctuations in market valuations have large effects on capital structure that persist for at least a decade. Capital structure is largely the cumulative outcome of past attempts to time the equity market. support market timing theory

43
Appendix: Robustness tests (Table AI)
Leverage Level (Equation 5) Leverage Change from Pre-IPO (Equation 6) SIC-3 fixed effects The effect of M/Befwa on leverage: Panel A: Book Leverage %, IPO+10 Panel B: Book Leverage %, 1980–1999 All Firms Panel C: Market Leverage %, IPO+10 Panel D: Market Leverage %, 1980– 1999 All Firms IPO-year fixed effects Retained earnings Start M/B=End M/B Outliers included Tobit
 Leverage Change from Pre-IPO. (Equation 6) SIC-3 fixed effects. The effect of M/Befwa on leverage: Panel A: Book Leverage %, IPO+10. Panel B: Book Leverage %, 1980–1999. All Firms. Panel C: Market Leverage %, IPO+10. Panel D: Market Leverage %, 1980– 1999 All Firms. IPO-year fixed effects. Retained earnings. Start M/B=End M/B. Outliers included. Tobit.")
Similar presentations


 Optimal Dividend Policy Conflicting Theories Other Dividend Policy Issues Residual Dividend Theory Stable.>")

 Fall, 2010.>")
 OVU-ADVANCE Managerial Finance D.B. Hamm, rev. Jan 2006.>")
, Shaun Bond (University of Cincinnati), & Joseph Ooi (National University of Singapore)>")


: Theory-Practice of Corporate Finance>")


>")

