Download presentation
Presentation is loading. Please wait.

1
Estimation and Uncertainty 12-706/ 19-702 / 73-359 Lecture 2 - August 31, 2005

2
Announcements / Etc. zHW 1 Handed Out zBrief Lecture zFriday Sessions? When? zFYI Finding textbooks - www.addall.comwww.addall.com yPrices $23-40 Campbell, $28-$80 Clemen yChapters 2-3 in Cambpell assigned for next Wed! yIf you don’t have Campbell by next Wed, read Chapter 6 of “Project Management for Construction” (Hendrickson) at http://www.ce.cmu.edu/pmbook/http://www.ce.cmu.edu/pmbook/ xSorry, I am not allowed to put our text on reserve yOr Chapter 6 in Boardman, “Cost-Benefit Analysis”, Second Edition
 at xSorry, I am not allowed to put our text on reserve yOr Chapter 6 in Boardman, Cost-Benefit Analysis , Second Edition.")
3
Estimation in the Course We will encounter estimation problems in sections on demand, cost and risks. We will encounter estimation problems in several case studies. Projects will likely have estimation problems. Need to make quick, “back-of-the-envelope” estimates in many cases. Don’t be afraid to do so!

4
Problem of Unknown Numbers If we need a piece of data, we can: Look it up in a reference source Collect number through survey/investigation Guess it ourselves Get experts to help you guess it Often only ‘ballpark’, ‘back of the envelope’ or ‘order of magnitude needed Situations when actual number is unavailable or where rough estimates are good enough E.g. 100s, 1000s, … (10 2, 10 3, etc.) Source: Mosteller handout
 Source: Mosteller handout.")
5
Notes about Reference Sources Some obvious: Statistical Abstract of US Always check sources and secondary sources of data Usually found in footnotes – also tells you about assumptions/conditions for using Sometimes the summarized data is wrong! Look in multiple sources Different answers implies something about the data and method – and uncertainty

6
Estimation gets no respect The 2 extremes - and the respect thing Aristotle: “It is the mark of an instructed mind to rest satisfied with the degree of precision which the nature of the subject permits and not to seek an exactness where only an approximation of the truth is possible.” Archbishop Ussher of Ireland, 1658 AD: “God created the world in 4028 BC on the 9th of September at nine o’clock in the morning.” We consider it somewhere in between

7
In the absence of “Real Data” Are there similar or related values that we know or can guess? (proxies) Mosteller: registered voters and population Are there ‘rules of thumb’ in the area? E.g. ‘Rule of 72’ for compound interest r*t = 72: investment at 6% doubles in 12 yrs MEANS construction manual Set up a ‘model’ to estimate the unknown Linear, product, etc functional forms Divide and conquer
 Mosteller: registered voters and population Are there ‘rules of thumb’ in the area. E.g. ‘Rule of 72’ for compound interest r*t = 72: investment at 6% doubles in 12 yrs MEANS construction manual Set up a ‘model’ to estimate the unknown Linear, product, etc functional forms Divide and conquer.")
8
Methods zSimilarity – do we have data that can be made applicable to our problem? zStratification – segment the population into subgroups, estimate each group zTriangulation – create models with different approaches and compare results zConvolution – use probability or weightings (see Selvidge’s table, Mosteller p. 181) yNote – example of a ‘secondary source’!!
 yNote – example of a ‘secondary source’!!.")
9
Notes on Estimation Move from abstract to concrete, identifying assumptions Draw from experience and basic data sources Use statistical techniques/surveys if needed Be creative, BUT Be logical and able to justify Find answer, then learn from it. Apply a reasonableness test

10
Attributes of Good Assumptions Need to document assumptions in course Write them out and cite your sources Have some basis in known facts or experience Write why you make the specific assumptions Are unbiased towards the answer Example: what is inflation rate next year? Is past inflation a good predictor? Can I find current inflation? Should I assume change from current conditions? We typically use history to guide us

11
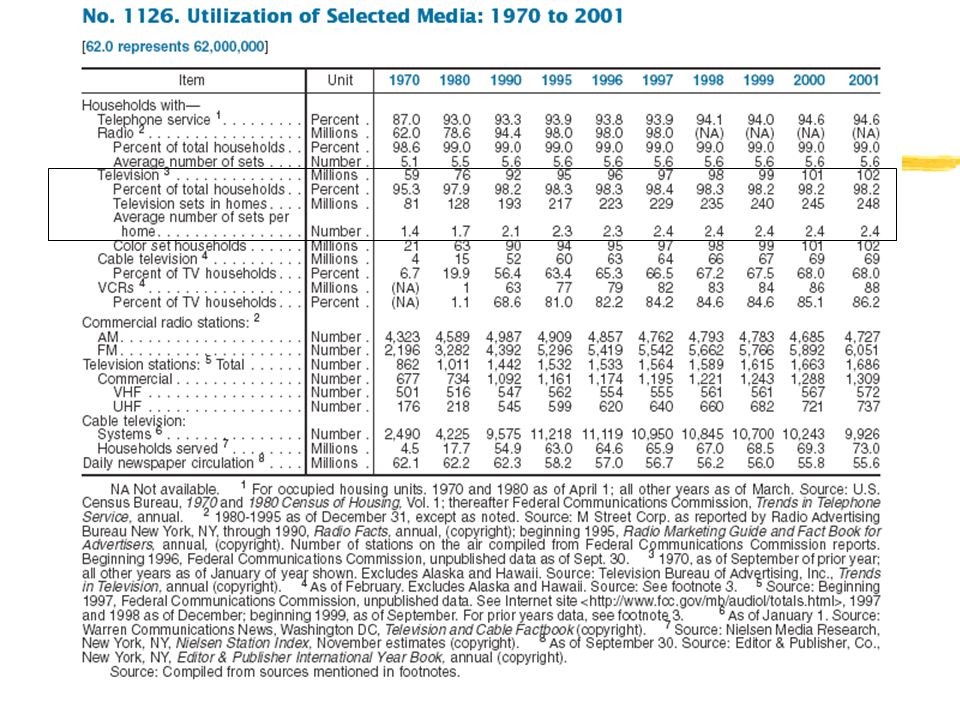
How many TV sets in the US? Can this be calculated? Estimation approach #1: Survey/similarity How many TV sets owned by class? Scale up by number of people in the US Should we consider the class a representative sample? Why not?

12
TV Sets in US – another way Estimation approach # 2 (segmenting): Work from # households and # TV’s per household - may survey for one input Assume x households in US Assume z segments of ownership (i.e. what % owns 0, owns 1, etc) Then estimated number of television sets in US = x*(4z 5 +3z 4 +2z 3 +1z 2 +0z 1 )
 Then estimated number of television sets in US = x*(4z 5 +3z 4 +2z 3 +1z 2 +0z 1 ).")
13
TV Sets in US – sample Estimation approach # 2 (segmenting): work from # households and # tvs per household - may survey for one input Assume 50,000,000 households in US Assume 19% have 4, 30% have 3, 35% 2, 15% 1, 1% 0 television sets Then 50,000,000*(4*.19+3*.3+2*.35+.15) = 125.5 M television sets
: work from # households and # tvs per household - may survey for one input Assume 50,000,000 households in US Assume 19% have 4, 30% have 3, 35% 2, 15% 1, 1% 0 television sets Then 50,000,000*(4*.19+3*.3+2* ) = M television sets")
14
TV Sets in US – still another way Estimation approach #3 – published data Source: Statistical Abstract of US Gives many basic statistics such as population, areas, etc. Done by accountants/economists - hard to find ‘mass of construction materials’ or ‘tons of lead production’. How close are we?

16
How well did we do? Most recent data = 2001 But ‘recently’ increasing < 2% per year TV/HH - 125.5 tvs, StatAb – 248M TVs, % error: (248M – 125.5M)/125.5M ~ 100% What assumptions are crucial in determining our answer? Were we right? What other data on this table validate our models? See ‘SAMPLE ESTIMATION’ linked on web page to see how you are expected to answer these types of questions. Also see “SAMPLE SPREADSHEET” for a suggested organization in Excel
/125.5M ~ 100% What assumptions are crucial in determining our answer. Were we right. What other data on this table validate our models. See ‘SAMPLE ESTIMATION’ linked on web page to see how you are expected to answer these types of questions. Also see SAMPLE SPREADSHEET for a suggested organization in Excel.")
17
Notes on Sample Files zThe text file gives the type and structure of documentation I expect when doing assumption-based analysis. There is a question like it on Homework 1, make sure your answer looks like that. zThe spreadsheet file suggests a framework for building assumptions into spreadsheets, i.e., placing them all at the top where you can see them. If needed, you can use the cell values as links in your equations. zNote the Excel plug-ins we will use later will want to see assumptions done like this.

18
Changing Assumptions zStatistical Abstract gave additional info: yAverage TVs/HH = 2.4 (ours was 2.5) yNumber of households: 100 million (ours 50) zThus to redo our analysis, we should do a better job at estimating households
 yNumber of households: 100 million (ours 50) zThus to redo our analysis, we should do a better job at estimating households")
19
Significant Figures zWe estimated 125,500,000 TVs in US zHow accurate is this - nearest 50,000, the nearest 500,000, the nearest 5,000,000 or the nearest 50,000,000? zShould only report estimates to your confidence - perhaps 1 or 2 “significant figures” could be reported here. zFigures are only carried along to document calculations or avoid rounding errors.

20
Some handy/often used data zPopulation of US btw 275-300 million zNumber of households ~ 100 million zAverage personal income ~$35,000

21
Avoiding Point Estimates zThe tradeoff in this kind of work is getting away with a guess yAnd giving an informed-enough answer that doesn’t sound like a guess! zReally what we should be doing is making ranges of estimates yWe will refer to these as lower bound, mean, and upper bound estimates yYou might think of lower bound as “5th percentile” and upper as “95th percentile” ySo they’re not true lower/upper bounds (which might be zero and infinity).
..")
22
Exercise #2: Estimate Annual Vehicle Miles Travelled (VMT) in the US zEstimate “How many miles per year are passenger automobiles driven in the US?” zTypes of models ySimilar to TVs: Guess number of cars, segment population into miles driven per year yFind fuel consumption data, guess at fuel economy ratio for passenger vehicles yOther ideas? Let’s try it on the board.

23
Estimate VMT in the US zTable 1093 of 2003 Stat. Abstract suggests 2001 VMT was 2.28 trillion miles (yes - twice as much as 1972 implied in the Mosteller handout)! y235 billion ‘passenger car trips’ per year yAbout 200 million cars yAvg VMT 21,000 mi., about 10,000 miles per car zNote the Dept of Transportation separately specifies “passenger car VMT” as 1.62 trillion miles - does better job of separating trucks yAbout 16k VMT per household yhttp://www.bts.gov/publications/national_transportat ion_statistics/2003/index.html (Table 1-32)http://www.bts.gov/publications/national_transportat ion_statistics/2003/index.html
. y235 billion ‘passenger car trips’ per year yAbout 200 million cars yAvg VMT 21,000 mi., about 10,000 miles per car zNote the Dept of Transportation separately specifies passenger car VMT as 1.62 trillion miles - does better job of separating trucks yAbout 16k VMT per household yhttp:// ion_statistics/2003/index.html (Table 1-32) ion_statistics/2003/index.html.")
24
More clever: Cobblers in the US zCobblers repair shoes zOn average, assume 20 min/task zThus 20 jobs / day ~ 5000/yr yHow many jobs are needed overall for US? zI get shoes fixed once every 5 years yAbout 280M people in US zThus 280M/4 = 56 M shoes fixed/year y56M/5000 ~ 11,000 => 10^4 cobblers in US zActual: Census dept says 5,120 in US

25
An Energy Example zEnergy measured in SI units = Watts (as opposed to BTUs, etc) zIn practice, we usually talk about kilowatts or kilowatt-hours of energy zRule: 1 Watt of energy used for one hour is One watt-hour (compound unit) = 1Wh y1000 Watts used for one hour = 1kWh z‘How much energy used by lighting in US residences?’
 zIn practice, we usually talk about kilowatts or kilowatt-hours of energy zRule: 1 Watt of energy used for one hour is One watt-hour (compound unit) = 1Wh y1000 Watts used for one hour = 1kWh z‘How much energy used by lighting in US residences ’")
26
‘How much energy used by lighting in US residences?’ zAssume 50 light fixtures per house zAssume each in use avg 2 hours per day zAssume average fixture is 50W zThus each fixture uses 100Wh/day zEach house uses 5000Wh/day (5kWh/day) z100 million households would use 500 million kWh/day y182,500 million kWh/yr
 z100 million households would use 500 million kWh/day y182,500 million kWh/yr")
27
‘How much energy used by lighting in US residences?’ zOur guess: 182,500 million kWh/yr yDOE: “lighting is 5-10% of household elec” yhttp://www.eren.doe.gov/erec/factsheets/eelight.html z2000 US residential Demand ~ 1.2 million million kWh (source below) y10% is 120,000 million kWh y5% is 60,000 million kWh y2000 demand source: http://www.eia.doe.gov/cneaf/electricity/epm/ epmt44p1.html
 y10% is 120,000 million kWh y5% is 60,000 million kWh y2000 demand source: epmt44p1.html")
28
A Random Example zSelect a random panel of data from the Statistical Abstract of the U.S. yCan you formulate an ‘estimation question’? yCan you estimate the answer? yHow close were you to the ‘actual answer’? zLet’s try this ourselves

29
Uncertainty zInvestment planning and benefit/cost analysis is fraught with uncertainties yforecasts of future are highly uncertain yapplications often made to preliminary designs ydata is often unavailable zStatistics has confidence intervals – we need them, too zWe will talk in more detail about uncertainty in a few weeks.

Similar presentations


>")


>")


