Download presentation
Presentation is loading. Please wait.

1
بسم الله الرحمن الرحیم Fariba Rezaeetalab Assistant professor,pulmonologist

2
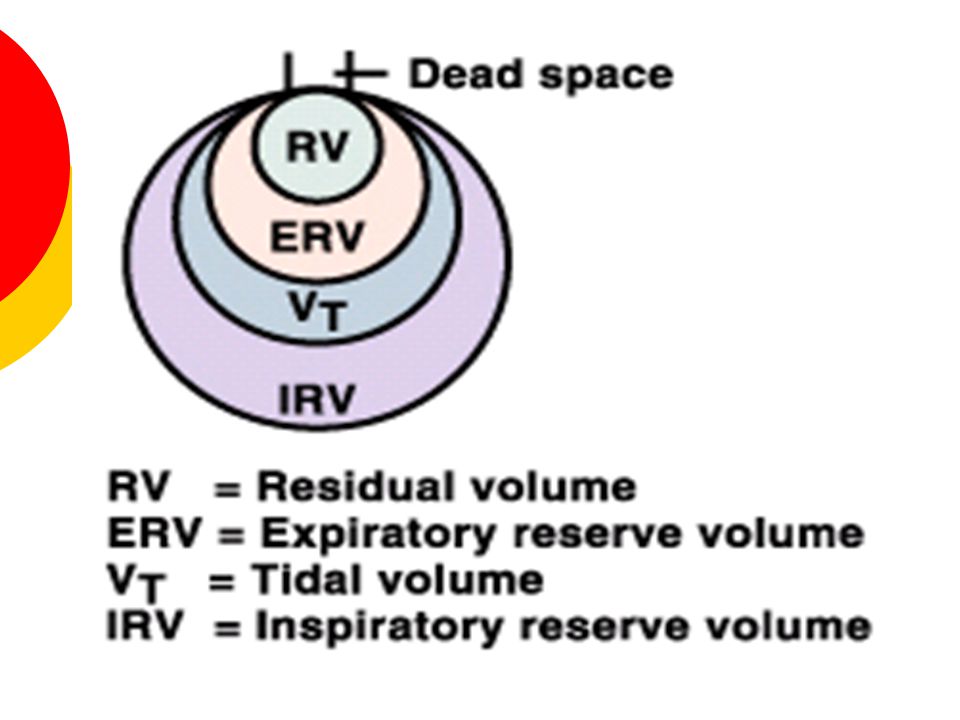
Lung Volumes 4 Lung Volumes, 3 of which can be measured with simple spirometry. Tidal Volume (V t ): The volume of air that normally moves into and out of the lungs in one “quiet” breath. Normal: 5-8 ml/kg (70 kg * 7 ml/kg = 500 ml). Inspiratory Reserve Volume (IRV): The maximum volume of air that can be inhaled after a normal tidal volume. Normal: 3,100 mL
: The volume of air that normally moves into and out of the lungs in one quiet breath. Normal: 5-8 ml/kg (70 kg * 7 ml/kg = 500 ml). Inspiratory Reserve Volume (IRV): The maximum volume of air that can be inhaled after a normal tidal volume. Normal: 3,100 mL.")
3
Expiratory Reserve Volume (ERV): The volume of air that can be exhaled after a normal tidal volume. Normal: 1,200 mL Residual Volume (RV): The amount of air remaining in the lung after a maximal exhalation. Normal: 1,200 mL Cannot be measured with simple spirometery
: The amount of air remaining in the lung after a maximal exhalation. Normal: 1,200 mL Cannot be measured with simple spirometery.")
6
Lung Volume

7
Directions for Lung Volume/Capacity Measurements Tidal Volume (V t ): Breathe normally in and out. Inspiratory Reserve Volume (IRV): Inhale as much as you can from a normal inhalation. Expiratory Reserve Volume (ERV): Exhale as much as you can from a normal exhalation..
: Inhale as much as you can from a normal inhalation. Expiratory Reserve Volume (ERV): Exhale as much as you can from a normal exhalation...")
8
Residual Volume (RV): This volume cannot be measured directly with simple spirometry. Slow Vital Capacity (SVC): Take a deep breath in, as deep as you can, and then blow it out slowly until you can’t blow out any more.
: Take a deep breath in, as deep as you can, and then blow it out slowly until you can’t blow out any more..")
9
Indirect Measurements of RV The residual volume (and the capacities which have it as a part – FRC & TLC) must be measured indirectly by one of three methods: Helium Dilution – Closed Circuit Method Nitrogen Washout – Open Circuit Method Body Plethysmography
 must be measured indirectly by one of three methods: Helium Dilution – Closed Circuit Method Nitrogen Washout – Open Circuit Method Body Plethysmography")
10
Lung Volumes / Gas Distribution Indirect Spirometry Two basic approaches Gas dilution Body plethysmography Measurements are in Liter or Milliliters Reported at BTPS

11
Lung Volumes / Gas Distribution Indirect Spirometry Required for the determination of RV, FRC and TLC Most often, indirect spirometry is performed to measure FRC volume FRC is the most reproducible lung volume and it provides a consistent baseline for measurement

12
Lung Volumes / Gas Distribution Gas dilution techniques All operate on a principle SIMILAR to Boyle’s Law (P 1 V 1 = P 2 V 2 ), which states, In isothermic conditions, the volume of a gas varies inversely with its pressure Fractional concentration of a known gas is used instead of its partial pressure C 1 V 1 = C 2 V 2
, which states, In isothermic conditions, the volume of a gas varies inversely with its pressure Fractional concentration of a known gas is used instead of its partial pressure C 1 V 1 = C 2 V 2")
13
Lung Volumes / Gas Distribution Gas dilution techniques By having a known (or measured) gas concentration at the start and end of the study and a single known volume, the unknown volume can be determined. For example: V 1 = C 2 V 2 C 1

14
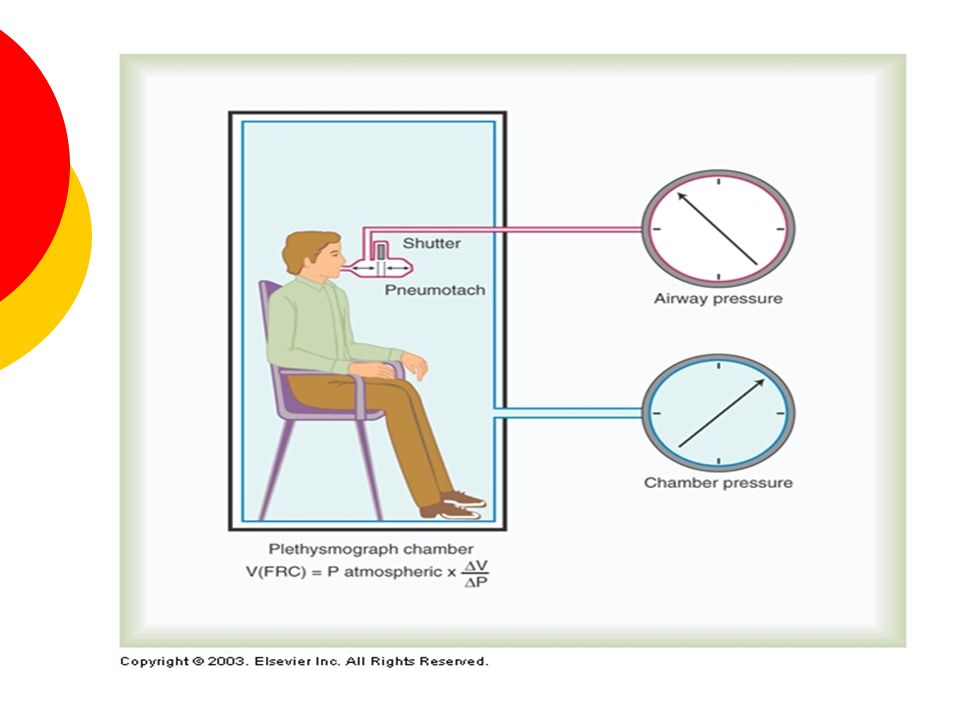
TOTAL LUNG CAPACITY By applying Boyle’s law (P · V = constant) TLC Measured by – body plethysmography – helium dilution – Nitrogen washout – Body plethysmography – mouthpiece obstructed with shutter – rapid panting chest volume expand and decompress the air in the lungs changes in pressure inside the box allow determination of the lungof the lung volume
 TLC Measured by – body plethysmography – helium dilution – Nitrogen washout – Body plethysmography – mouthpiece obstructed with shutter – rapid panting chest volume expand and decompress the air in the lungs changes in pressure inside the box allow determination of the lungof the lung volume")
16
HELIUM DILUTION

17
TOTAL LUNG CAPACITY Helium dilution - Spirometer of known volume and helium concentration connected to the patient- Closed circuit - Law of conservation of mass [He]initial.Vs=[He]final.( Vs+VL) Unknown lung volume canbe calculated [He] [He] initial · V s = {H.,.,.H{[[) initial · V s = [He] final · (V s + )
![TOTAL LUNG CAPACITY Helium dilution - Spirometer of known volume and helium concentration connected to the patient- Closed circuit - Law of conservation of mass [He]initial.Vs=[He]final.( Vs+VL) Unknown lung volume canbe calculated [He] [He] initial · V s = {H.,.,.H{[[) initial · V s = [He] final · (V s + )](http://images.slideplayer.com/16/4946463/slides/slide_17.jpg "TOTAL LUNG CAPACITY Helium dilution - Spirometer of known volume and helium concentration connected to the patient- Closed circuit - Law of conservation of mass [He]initial.Vs=[He]final.( Vs+VL) Unknown lung volume canbe calculated [He] [He] initial · V s = {H.,.,.H{[[) initial · V s = [He] final · (V s + )")
18
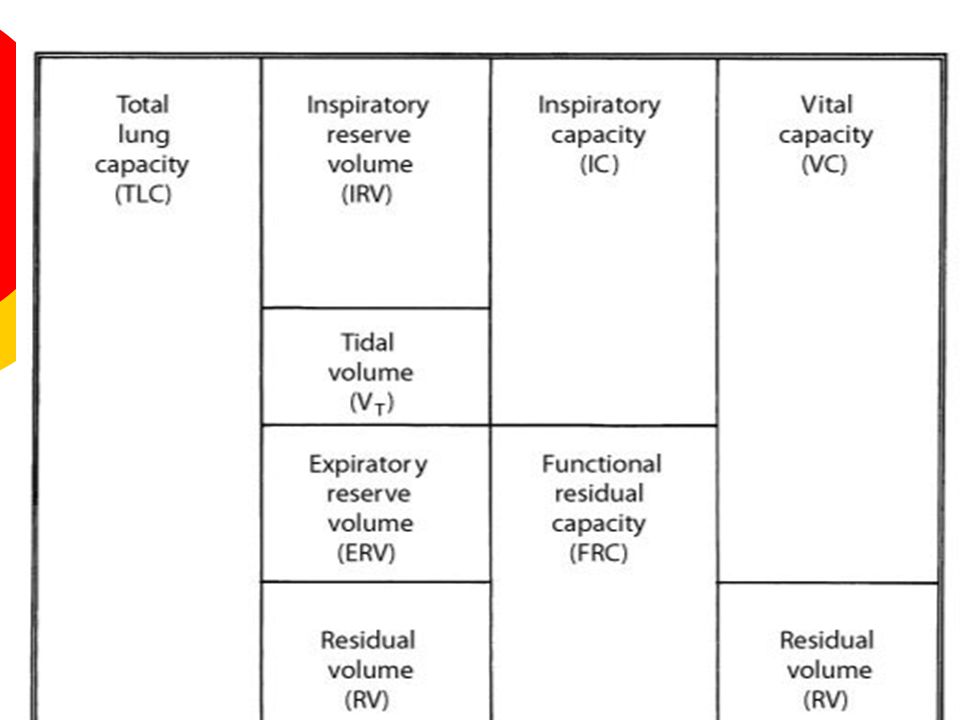
RV=TLC-VC FRC=TLC- IC

19
NITROGEN WASHOUT

20
Lung Volumes / Gas Distribution Objectives Describe the measurement of lung volume using direct and indirect spirometry Explain two advantages of measuring lung volumes using the body plethysmograph

21
Lung Volumes / Gas Distribution Objectives Calculate residual volume and total lung capacity from FRC and the subdivisions of VC Identify restriction from measuring lung volumes

22
Lung Volumes / Gas Distribution Direct Spirometry Used to measure all volumes and capacities EXCEPT for RV, FRC and TLC

23
Lung Volumes / Gas Distribution Gas dilution techniques Can only measure lung volumes in communication with conducting airways !!!

24
Lung Volumes / Gas Distribution Gas dilution techniques Obstruction or bullous disease can have trapped, noncommunicating air within the lungs FRC may be measured as being less than its actual volume

25
Lung Volumes / Gas Distribution Open-Circuit Nitrogen Washout The natural volume of nitrogen in the subject’s lungs at FRC is washed out and diluted with 100% oxygen Test must be carefully initiated from the FRC baseline level

26
Lung Volumes / Gas Distribution Open-Circuit Nitrogen Washout All exhaled gas is collected in a Tissot (large volume) spirometer for measurement of its volume Analyzer in the breathing circuit monitors nitrogen concentrations
 spirometer for measurement of its volume Analyzer in the breathing circuit monitors nitrogen concentrations")
27
Lung Volumes / Gas Distribution Open-Circuit Nitrogen Washout

28
Lung Volumes / Gas Distribution Open-Circuit Nitrogen Washout

29
Lung Volumes / Gas Distribution Open-Circuit Nitrogen Washout Approximately 3-7 minutes of breathing 100% O2 to wash out N2 from the lungs If oxygen-induced hypoventilation is a documented problem (as in COPD), a different method of FRC determination is needed
, a different method of FRC determination is needed")
30
Lung Volumes / Gas Distribution Open-Circuit Nitrogen Washout Test is successfully completed when the N2 levels decrease to become less than 1.5% for at least 3 successive breaths (subjects without obstructive disorders) Premature discontinuation may occur due to: System leak Patient unable to continue Tissot spirometer is full
 Premature discontinuation may occur due to: System leak Patient unable to continue Tissot spirometer is full")
31
Lung Volumes / Gas Distribution Open-Circuit Nitrogen Washout The FRC has a N2 concentration of approximately 0.75, based on the atmospheric nitrogen minus CO2 and water vapor at BTPS: (C Alv N2) = 0.75
 = 0.75")
32
Lung Volumes / Gas Distribution Open-Circuit Nitrogen Washout The final collected volume of exhaled gas in the Tissot spirometer (V Exh ) Has a measurable concentration of N2 (C Exh N2)
 Has a measurable concentration of N2 (C Exh N2)")
33
Lung Volumes / Gas Distribution Open-Circuit Nitrogen Washout FRC determination is based on the following equation: V FRC = (C Exh N2)(V Exh ) C Alv N2
(V Exh ) C Alv N2")
34
Lung Volumes / Gas Distribution Open-Circuit Nitrogen Washout In the actual FRC determination by this method, the calculation is more complex Do not get scared ! You will not be asked to do the calculation!

35
Lung Volumes / Gas Distribution Open-Circuit Nitrogen Washout The small final concentration of alveolar N2 remaining in the lung needs to be subtracted from the original CalvN2 Deep breath of O2 at the end of the test and slowly exhaled. The end- expiratory CN2 is used as the CFN2 (This volume should not be exhaled into the spirometer)
.")
36
Lung Volumes / Gas Distribution Open-Circuit Nitrogen Washout The second correction is the volume of nitrogen released from the body tissues during the washout procedure (body tissue N2 factor or BTN2) Rages from 30 – 50 ml/minute of the washout procedure (T Test )
 Rages from 30 – 50 ml/minute of the washout procedure (T Test )")
37
Lung Volumes / Gas Distribution Open-Circuit Nitrogen Washout Final Calculation VFRC = (C Exh N2 X (V Exh +VD) ) - BTN2 Factor X T Test C Alv N2 – C F N2 Must be BTPS converted Test can be repeated after 15 minutes (longer if COPD)
 ) - BTN2 Factor X T Test C Alv N2 – C F N2 Must be BTPS converted Test can be repeated after 15 minutes (longer if COPD)")
38
Lung Volumes / Gas Distribution Open-Circuit Nitrogen Washout Modern computer-operated pneumotachometer systems do not require collection of total V Exh or measurement of the C Exh N2 Breath-by-breath C Exh N2 and V Exh measurements are made

39
Lung Volumes / Gas Distribution Open-Circuit Nitrogen Washout

40
Lung Volumes / Gas Distribution Open-Circuit Nitrogen Washout

41
Lung Volumes / Gas Distribution Open-Circuit Nitrogen Washout Leak

42
Lung Volumes / Gas Distribution Open-Circuit Nitrogen Washout Criteria for Acceptability The washout tracing/display should indicate a continually falling concentration of alveolar N2 The test should be continued until the N2 concentration falls to <1.5% for 3 consecutive breaths

43
Lung Volumes / Gas Distribution Open-Circuit Nitrogen Washout Criteria for Acceptability Washout times should be appropriate for the subject tested. Healthy subjects should washout N2 completely in 3-4 minutes The washout time should be reported. Failure to wash out N2 within 7 minutes should be noted

44
Lung Volumes / Gas Distribution Open-Circuit Nitrogen Washout Criteria for Acceptability Multiple measurements should agree within 10% Average FRC from acceptable trials should be used to calculate lung volumes At least 15 minutes of room-air breathing should elapse between repeated trials, >1 hour for patients with severe obstructive or bullous disease

45
Lung Volumes / Gas Distribution Closed-Circuit Helium Dilution FRC is calculated indirectly by diluting the gas in the lungs at the end-expiration level with a known concentration of helium (an inert gas)
")
46
Lung Volumes / Gas Distribution Closed-Circuit Helium Dilution FRC

47
Lung Volumes / Gas Distribution Closed-Circuit Helium Dilution Procedure Spirometer is filled with a known volume of air with added oxygen of 25 – 30% A volume of He is added so that a concentration of approximately 10% is achieved System volume (spirometer, tubing) and He concentration are measured
 and He concentration are measured")
48
Closed-Circuit Helium Dilution C1 V1 = C2 V2 (C1 initial He concentration)(V1 system volume) Lung Volumes / Gas Distribution
(V1 system volume) Lung Volumes / Gas Distribution")
49
Closed-Circuit Helium Dilution Procedure The patient breathes through a free-breathing valve that allows either connection to both room air or the rebreathing system The patient is switched into the rebreathing system at end-expiration level (FRC) The patient rebreathes the gas in the spirometer, until the He concentration falls to a stable level
 The patient rebreathes the gas in the spirometer, until the He concentration falls to a stable level")
50
Lung Volumes / Gas Distribution Closed-Circuit Helium Dilution CO2 Absorbed O2 Added H2O Absorbed

51
Lung Volumes / Gas Distribution Closed-Circuit Helium Dilution He Concentration System Volume

52
Lung Volumes / Gas Distribution Closed-Circuit Helium Dilution

53
Lung Volumes / Gas Distribution Closed-Circuit Helium Dilution Procedure Once the He reaches equilibrium between the spirometer and the patient, the final concentration of He is recorded The FRC can then be calculated FRC

54
Closed-Circuit Helium Dilution C1 V1 = C2 V2 Lung Volumes / Gas Distribution (C I He)(S V ) = (C F He) (FRC) FRC = (%He Initial - %He Final ) x System volume %He Final
(S V ) = (C F He) (FRC) FRC = (%He Initial - %He Final ) x System volume %He Final")
55
Closed-Circuit Helium Dilution Volume Corrections A volume of 100 ml is sometimes subtracted from the FRC to correct loss of He to the blood The dead space volume of the breathing valve and filter should be subtracted from the FRC Lung Volumes / Gas Distribution

56
Closed-Circuit Helium Dilution Criteria for Acceptability Spirometer tracing should indicate no leaks (detected by a sudden decrease in He), which would cause an overestimation of FRC Test is successfully completed when He readings change by less than 0.02% in 30 seconds or until 10 minutes has elapsed Lung Volumes / Gas Distribution
, which would cause an overestimation of FRC Test is successfully completed when He readings change by less than 0.02% in 30 seconds or until 10 minutes has elapsed Lung Volumes / Gas Distribution")
57
Closed-Circuit Helium Dilution Criteria for Acceptability Multiple measurements of FRC should agree within 10% The average of acceptable multiple measurements should be reported Lung Volumes / Gas Distribution

58
Body Plethysmography (BP) Measurement of FRC by body plethysmograph is based on an application of Boyle’s law P 1 V 1 = P 2 V 2 or V 1 = P 2 V 2 P 1 Lung Volumes / Gas Distribution
 Measurement of FRC by body plethysmograph is based on an application of Boyle’s law P 1 V 1 = P 2 V 2 or V 1 = P 2 V 2 P 1 Lung Volumes / Gas Distribution")
59
Body Plethysmography (BP) Unlike gas dilution tests, BP includes both air in communication with open airways as well as air trapped within noncommunicating thoracic compartments In patients with air trapping, plethysmography lung volumes are usually larger those measured with gas dilution methods Volume measured is referred to as thoracic gas volume (TGV or V TG ) ATS is recommending term be dropped and changed to “plethysmographic lung volume” (VL, pleth), and “FRC by body plethysmography” or TGV at FRC (FRCpleth) Lung Volumes / Gas Distribution
 Unlike gas dilution tests, BP includes both air in communication with open airways as well as air trapped within noncommunicating thoracic compartments In patients with air trapping, plethysmography lung volumes are usually larger those measured with gas dilution methods Volume measured is referred to as thoracic gas volume (TGV or V TG ) ATS is recommending term be dropped and changed to plethysmographic lung volume (VL, pleth), and FRC by body plethysmography or TGV at FRC (FRCpleth) Lung Volumes / Gas Distribution")
60
Body Plethysmography (BP) Procedure Patient is required to support cheeks with both hands and pant with an open glottis at a rate of 0.5 - 1 Hz (30 – 60 breaths/min) BP shutter is suddenly closed at end-expiration prior to inspiration Panting is continued for several breaths against closed shutter (no air flow)
 Procedure Patient is required to support cheeks with both hands and pant with an open glottis at a rate of Hz (30 – 60 breaths/min) BP shutter is suddenly closed at end-expiration prior to inspiration Panting is continued for several breaths against closed shutter (no air flow)")
61
Lung Volumes / Gas Distribution Body Plethysmography (BP) Procedure The thoracic-pulmonary volume changes during panting produce air volume changes within the BP cabinet Decreases in cabinet volume are an equal inverse response to thoracic volume increase (As thoracic volumes increase with panting inspiration, BP cabinet volume decreases and visa versa)
 Procedure The thoracic-pulmonary volume changes during panting produce air volume changes within the BP cabinet Decreases in cabinet volume are an equal inverse response to thoracic volume increase (As thoracic volumes increase with panting inspiration, BP cabinet volume decreases and visa versa)")
62
Lung Volumes / Gas Distribution Body Plethysmography (BP) Criteria of Acceptability Panting maneuver shows a closed loop without drift Tracing does not go off the screen Panting is 0.5 – 1 Hz Tangents should be within 10% At least 3 FRC pleth values should agree within 5% and the mean reported
 Criteria of Acceptability Panting maneuver shows a closed loop without drift Tracing does not go off the screen Panting is 0.5 – 1 Hz Tangents should be within 10% At least 3 FRC pleth values should agree within 5% and the mean reported")
63
Lung Volumes / Gas Distribution Body Plethysmography (BP) Airway Resistance (Raw) and Specific Airway Conductance (SGaw) can be measured simultaneously during open- shutter panting (1.5-2.5 Hz) Most plethysmographs have built-in pneumotachometers and allow VC maneuvers to be performed during the same testing session
 Airway Resistance (Raw) and Specific Airway Conductance (SGaw) can be measured simultaneously during open- shutter panting ( Hz) Most plethysmographs have built-in pneumotachometers and allow VC maneuvers to be performed during the same testing session")
64
Lung Volumes / Gas Distribution Single-Breath Nitrogen Washout Measures Distribution of Ventilation Closing Volume Closing Capacity

65
Lung Volumes / Gas Distribution SBN 2 (SBO 2 ) Equipment
 Equipment")
66
Lung Volumes / Gas Distribution SBN 2 Procedure Patient exhales to RV Inspires a VC breath of 100% O2 Patient exhales slowly and evenly (0.3- 0.5L/s) N2 concentration is plotted against volume
 N2 concentration is plotted against volume")
67
Lung Volumes / Gas Distribution SBN 2 Phase I: upper airway gas from anatomical dead space (VDanat), consisting of 100% N2 Phase II: mixed airway gas in which the relative concentrations of O2 and N2 change abrubtly as VDanat volume is expired SBN 2 Phase I: upper airway gas from anatomical dead space (VDanat), consisting of 100% O2 Phase II: mixed airway gas in which the relative concentrations of O2 and N2 change abrubtly as VDanat volume is expired
, consisting of 100% N2 Phase II: mixed airway gas in which the relative concentrations of O2 and N2 change abrubtly as VDanat volume is expired SBN 2 Phase I: upper airway gas from anatomical dead space (VDanat), consisting of 100% O2 Phase II: mixed airway gas in which the relative concentrations of O2 and N2 change abrubtly as VDanat volume is expired")
68
Lung Volumes / Gas Distribution SBN 2 Phase III: a plateau caused by the exhalation of alveolar gas in which relative O2 and N2 concentrations change slowly and evenly Phase IV: an abrupt increase in the concentration of N2 that continues until RV is reached

69
Lung Volumes / Gas Distribution SBN2 % N2 750 – 1250 I s 1.5% or less in healthy adults; up to 3% in older adults Increased % N2 750 – 1250 is found in diseases characterized by uneven distribution of gas during inspiration or unequal emptying rates during expiration. Patients with severe emphysema may exceed 10%

70
Lung Volumes / Gas Distribution SBN2 Slope of Phase III Is an index of gas distribution Values in healthy adults range from 0.5% to 1.0% N2/L of lung volume

71
Lung Volumes / Gas Distribution SBN2 Closing Volume The onset of Phase IV marks the lung volume at which airway closure begins In healthy adults, airways begin closing after 80- 90% of VC has been expired, which equates to 30% of TLC Reported as a percentage of VC

72
Lung Volumes / Gas Distribution SBN2 Closing Capacity If RV has been determined, CV may added to it and expressed at Closing Capacity (CC) CC is recorded as a percentage of TLC
 CC is recorded as a percentage of TLC")
73
Lung Volumes / Gas Distribution SBN2 Normal Values for CC and CV ________________________________ MaleFemale CV/%VC7.7%8.7% CC/%TLC24.8%25.1%

74
Lung Volumes / Gas Distribution SBN2 CV and CC may be increased, indicating earlier onset of airway closure in: Elderly patients Smokers, early obstructive disease of small airways Restrictive disease patterns in which FRC becomes less than the CV Congestive heart failure when the caliber of the small airways is compromised by edema

75
Lung Volumes / Gas Distribution SBN2 Acceptability Criteria Inspired and expired VC should be within 5%or 200 ml The VC during SBN2 should be within 200 ml of a previously determined VC Expiratory flows should be maintained between 0.3 and 0.5 L/sec. The N2 tracing should show minimal cardiac oscillations

76
Lung Volumes The most significant volumes for evaluating the effects of pulmonary disorders are VC, FRC, RV, and TLC

77
Lung Volume Significance/Pathophysiology Obstructive Pattern Increase FRC is considered pathologic FRC values >120% of predicted represent air trapping Emphysematous changes Obstruction caused by asthma or bronchitis

78
Lung volume

79
Significance/Pathophysiology Restrictive Pattern FRC, RV and TLC typically decreased Usually lung volumes are decreased equally When TLC is <80% a restrictive process is present RV/TLC is relatively normal

80
TLC and RV/TLC Ratio RV/TLC% >35% + Normal TLC = Air trapping RV/TLC% >35% + >Normal TLC = hyperinflation

81
Lung Volume Changes Patterns of Lung Volume Changes Volume Restrictive Air Trapping Hyperinflation TLCN VCN FRC RV RV/TLC%N

Similar presentations


>")


 volume moved during either an inspiratory or expiratory phase of each breath (L)>")


