Download presentation
Presentation is loading. Please wait.

1
Chesapeake Bay Program Model Update Rich Batiuk Associate Director for Science U.S. EPA Chesapeake Bay Program

2
Everything You Ever Wanted to Know about Chesapeake Bay Program Modeling But Were Afraid to Ask a Modeler

3
Role of Models Modeling ResearchMonitoring Management Power Clarity What is the concentration? What are the filtering rates? Where are the streams? What is the environmental effect of any particular management scheme? How do we balance many different interests?

4
CBP Modeling Structure Watershed Model Chesapeake Bay Estuary Model Package Regional Acid Deposition Model

5
Purpose of Watershed Model Results help direct tributary strategy development What’s the impact of BMP implementation on Nitrogen/Phosphorus/Sediment loads? What yields the biggest bang and the biggest bang for the buck? Load allocations Equitably account for all load sources. Measure of cap maintenance

6
Purpose of Watershed Model Provide loads to the Estuarine Model What’s the impact of BMP implementation on living resources water quality? What yields the biggest bang and the biggest bang for the buck? Remove impairments by 2010

7
Watershed Model Inputs Nutrient Applications to Agricultural Land Landuses Non-Point Source BMP Implementation Point Sources Septic Loads Atmospheric Deposition

8
Watershed Model Inputs Nutrient Applications to Agricultural Land Landuses Non-Point Source BMP Implementation Point Sources Point Sources Septic Loads Septic Loads Atmospheric Deposition Atmospheric Deposition

9
Watershed Model Simulation Input Data Land Simulation River Simulation Output Opportunities for BMPs

10
Watershed Model Nonpoint Source BMPs Agricultural BMPsHow CreditedTN EfficiencyTP EfficiencySED Efficiency Conservation TillageLanduse ConversionN/A Riparian Forest Buffers (Agriculture) Landuse Conversion + Efficiency 25-85% depending on hydrogeomorphic region 50-75% depending on hydrogeomorphic region Riparian Grass Buffers (Agriculture) Landuse Conversion + Efficiency 17-58%depending on hydrogeomorphic region 50-75%depending on hydrogeomorphic region Wetland Restoration (Agriculture) Currently Solely Landuse Conversion Same as riparian forest buffers Land Retirement (Agriculture)Landuse ConversionN/A Tree Planting (Row Crop)Landuse ConversionN/A Nutrient Management Plan Implementation (Crop) Built into SimulationUnder Review N/A Conservation Plans (Excluding Conservation-Tillage and Nutrient Management) Total OR Reported by the Following Landuses: Conservation Plans on Conventional-Till Efficiency 8%15%25% Conservation Plans on Conservation-Till Efficiency 3%5%8% Conservation Plans on HayEfficiency 3%5%8% Conservation Plans on PastureEfficiency 5%10%14%
 Landuse Conversion + Efficiency 25-85% depending on hydrogeomorphic region 50-75% depending on hydrogeomorphic region Riparian Grass Buffers (Agriculture) Landuse Conversion + Efficiency 17-58%depending on hydrogeomorphic region 50-75%depending on hydrogeomorphic region Wetland Restoration (Agriculture) Currently Solely Landuse Conversion Same as riparian forest buffers Land Retirement (Agriculture)Landuse ConversionN/A Tree Planting (Row Crop)Landuse ConversionN/A Nutrient Management Plan Implementation (Crop) Built into SimulationUnder Review N/A Conservation Plans (Excluding Conservation-Tillage and Nutrient Management) Total OR Reported by the Following Landuses: Conservation Plans on Conventional-Till Efficiency 8%15%25% Conservation Plans on Conservation-Till Efficiency 3%5%8% Conservation Plans on HayEfficiency 3%5%8% Conservation Plans on PastureEfficiency 5%10%14%")
11
Agricultural BMPsHow CreditedTN EfficiencyTP EfficiencySED Efficiency Cover Crops Cover Crops on Conventional- Till Efficiency 30-45% depending on planting date 7-15% depending on planting date 10-20% depending on planting date Cover Crops on Conservation- Till Efficiency 30-45% depending on planting date 0% Commodity Cereal Cover Crops Efficiency 17-25% depending on planting date 0% Animal Waste Management Systems: Livestock Systems – Designate types of systems with associations to the number of Animal Units and types of animals each system is handling Efficiency 75% N/A Poultry Systems – Designate types of systems with associations to the number of Animal Units and types of animals each system is handling Efficiency 20% N/A Barnyard Runoff Control / Loafing Lot Management - Designate types of runoff controls with associations to the number of Animal Units and types of animals Efficiency 20% (10% Supplemental) 20% (10% Supplemental) 40% Watershed Model Nonpoint Source BMPs
 20% (10% Supplemental) 40% Watershed Model Nonpoint Source BMPs")
12
Agricultural BMPsHow CreditedTN EfficiencyTP EfficiencySED Efficiency Alternative Uses of Manure / Manure Transport Built into Preprocessor Reduction in nutrient mass applied to cropland N/A Off-stream Watering with Stream Fencing (Pasture) Efficiency 60% 75% Off-stream Watering without Fencing (Pasture) Efficiency 30% 38% Off-stream Watering with Stream Fencing and Rotational Grazing (Pasture) Efficiency 20% 40% Watershed Model Nonpoint Source BMPs
 Efficiency 60% 75% Off-stream Watering without Fencing (Pasture) Efficiency 30% 38% Off-stream Watering with Stream Fencing and Rotational Grazing (Pasture) Efficiency 20% 40% Watershed Model Nonpoint Source BMPs")
13
Urban and Mixed Open BMPs How CreditedTN EfficiencyTP EfficiencySED Efficiency Stormwater Management Reported by the Following Categories: Wet Ponds and WetlandsEfficiency 30%50%80% Dry Detention Ponds and Hydrodynamic Structures Efficiency 5%10% Dry Extended Detention PondsEfficiency 30%20%60% Infiltration PracticesEfficiency 50%70%90% Filtering PracticesEfficiency 40%60%85% Roadway SystemsTBDUnder Review Impervious Surface Reduction / Non-Structural Practices Landuse ConversionN/A Street Sweeping and Catch Basin Inserts TBDUnder Review Stream RestorationLoad Reduction 0.02 lbs/ft0.0035 lbs/ft2.55 lbs/ft Watershed Model Nonpoint Source BMPs

14
Urban and Mixed Open BMPs How CreditedTN EfficiencyTP EfficiencySED Efficiency Erosion and Sediment ControlEfficiency 33%50% Nutrient Management (Urban)Efficiency 17%22%N/A Forest Conservation (Urban)Landuse Conversion N/A Riparian Forest Buffers (Urban) Landuse Conversion + Efficiency 25%50% Riparian Grass Buffers (Urban)Landuse ConversionN/A Tree Planting (Urban)Landuse ConversionN/A Abandoned Mine ReclamationLanduse ConversionN/A Riparian Forest Buffers / Tree Planting (Mixed Open) Landuse ConversionN/A Nutrient Management (Mixed Open) Efficiency 17%22%N/A Watershed Model Nonpoint Source BMPs
Efficiency 17%22%N/A Forest Conservation (Urban)Landuse Conversion N/A Riparian Forest Buffers (Urban) Landuse Conversion + Efficiency 25%50% Riparian Grass Buffers (Urban)Landuse ConversionN/A Tree Planting (Urban)Landuse ConversionN/A Abandoned Mine ReclamationLanduse ConversionN/A Riparian Forest Buffers / Tree Planting (Mixed Open) Landuse ConversionN/A Nutrient Management (Mixed Open) Efficiency 17%22%N/A Watershed Model Nonpoint Source BMPs")
15
Resource BMPsHow CreditedTN EfficiencyTP EfficiencySED Efficiency Forest Harvesting PracticesEfficiency 50% Structural Tidal Shoreline Erosion Control Water Quality ModelN/A Non-Structural Tidal Shoreline Erosion Control Water Quality ModelN/A Septic BMPsHow CreditedTN EfficiencyTP EfficiencySED Efficiency Septic Connections/HookupsRemoval of SystemsN/A Septic DenitrificationEfficiency 50%N/A Septic PumpingEfficiency 5% N/A Watershed Model Nonpoint Source BMPs

16
Animal Feed Additives Yield Reserve Manure Additives Horse Pasture Management Carbon Sequesteration Mortality Composters Ammonia Emissions Controls in Animal Agriculture Voluntary Air Emission Controls within the Jurisdicitons (Utility, Industrial and Mobile) Street Sweeping Alternative Uses of Manure Alternative Cropping Systems/Ag Operations SAV Planting/Restoration; Oyster Reef Restoration NPS BMPs Efforts Not Currently Credited in the Model…But on the List
 Street Sweeping Alternative Uses of Manure Alternative Cropping Systems/Ag Operations SAV Planting/Restoration; Oyster Reef Restoration NPS BMPs Efforts Not Currently Credited in the Model…But on the List")
17
Adding to the “Approved”BMP List Review/approval through the Bay Program’s Tributary Strategy Workgroup BMP definition Recommended efficiency with technical literature documentation How the BMP will be handled by the watershed model How the BMP will be tracked (units, acres, etc.)
")
18
Opportunities for BMPs BMPs that revise inputs Alternative uses of manure Nutrient applications to cropland BMPs involving landuse conversions BMPs with nutrient and sediment reduction efficiencies BMPs with nutrient and sediment reduction efficiencies BMPs with both landuse conversions and reduction efficiencies BMPs with both landuse conversions and reduction efficiencies

19
Manure Applications to Cropland

20
Alternative Uses of Manure Alternative uses of manure encompasses removing from the Chesapeake Bay watershed nutrients available for crop applications. Jurisdictions need to track where the nutrients are removed from, how much, and manure/litter nutrient content.

21
Opportunities for BMPs BMPs that revise inputs Alternative uses of manure Nutrient applications to cropland BMPs involving landuse conversions BMPs with nutrient and sediment reduction efficiencies BMPs with nutrient and sediment reduction efficiencies BMPs with both landuse conversions and reduction efficiencies BMPs with both landuse conversions and reduction efficiencies

22
Nutrient Applications to Cropland BMP implementation levels tracked by state agencies and submitted to CBPO. Nutrient Management Plan Implementation is a separate module in the Watershed Model where crops receive only 130% of need/uptake for both nitrogen and phosphorus. Yellow areas represent “windows of opportunity” for traditional or tracked practices.

23
Nutrient Management Plan Implementation Watershed Model accounts for both N- and P-based nutrient management. Fertilizer application data from state agricultural agencies.

24
Nutrient Management Plan Implementation Watershed Model accounts for both N- and P-based nutrient management.

25
Opportunities for BMPs BMPs that revise inputs Alternative uses of manure Nutrient applications to cropland BMPs involving landuse conversions BMPs with nutrient and sediment reduction efficiencies BMPs with nutrient and sediment reduction efficiencies BMPs with both landuse conversions and reduction efficiencies BMPs with both landuse conversions and reduction efficiencies

26
Light orange generally represents agricultural land in 1990 EPA EMAP / LANSAT- derived imagery. Source of agricultural land categories and area in the model is U.S. Department of Agriculture “Census of Agriculture” - Published 1982/1987/1992/1997. County Census information is distributed to model segments. Agricultural land area projections directed by states. In 2001, agricultural land covered about 9.4 million acres or 23% of the total Bay watershed area. The watershed model estimates that agriculture accounts for 40% of the TN load, 47% of the TP load, and 62% of the land-based sediment load to the Bay in 2001.

27
Agricultural BMPs Involving Landuse Conversions BMP implementation levels tracked by state agencies and submitted to CBPO. Load reductions attributed to movement to a lower-exporting landuse. Yellow areas represent “windows of opportunity” for traditional or tracked practices.

28
Opportunities for BMPs BMPs that revise inputs BMPs that revise inputs Alternative uses of manure Nutrient applications to cropland BMPs involving landuse conversions BMPs with nutrient and sediment reduction efficiencies BMPs with both landuse conversions and reduction efficiencies BMPs with both landuse conversions and reduction efficiencies

29
Agricultural BMPs with Reduction Efficiencies BMP implementation levels tracked by state agencies and submitted to CBPO. BMP efficiencies for removing N, P, and SED are collaboration of TSWG participants after review of literature or agency/extension service recommendations. Yellow areas represent “windows of opportunity” for traditional or tracked practices.

30
BMP Implementation How “ Efficiency ” BMPs Are Credited In The Model Reduction = acres treated by BMP * BMP efficiency total segment acres By Landuse and Model Segment

31
BMP Implementation How “ Efficiency ” BMPs Are Credited In The Model BMPs that cannot be applied to same landuse Mutually exclusive – Additive in nutrient reduction capabilities i.e., streambank protection with and without protection Several BMPs on same landuse Consecutive One BMP reduces the nutrients available for subsequent BMPs Multiplicative in nutrient reduction i.e., forest buffers downhill from cover crops

32
Opportunities for BMPs BMPs that revise inputs BMPs that revise inputs Alternative uses of manure Nutrient applications to cropland BMPs involving landuse conversions BMPs with nutrient and sediment reduction efficiencies BMPs with nutrient and sediment reduction efficiencies BMPs with both landuse conversions and reduction efficiencies

33
BMPs with Landuse Conversions and Reduction Efficiencies Riparian buffer efficiencies are being revised so that they will vary according to hydro-geomorphic region. Yellow areas represent “windows of opportunity” and assume 100-ft. buffer widths on all un-buffered stream- miles associated with agricultural land.

34
Model BMP Simulation Input Data Land Simulation River Simulation Output Opportunities for BMPs

35
Chesapeake Bay Program Phase 4.3 Watershed Model Simulation

36
Watershed Model 64,000 square miles 9 Landuses 94 Segments 133 State-segment 464 County-segments 9 Major Tributaries 20 State-Basins 31 Tributary Strategy Basins

37
Lumped Parameter Physically-Based Model

38
Loading Sources in Watershed Model PastureHay Impervious Urban Conservation Till Pervious Urban Forest Conventional Till Manure RIVER REACH Atmospheric Deposition Point Source Septic

39
Land Simulation – 1 Acre Water Simulation - Physically Based Precipitation (time series) Percolation - f(soil properties, slope, temp) Evapotranspiration - f(time series, land properties) Runoff - f(soil properties, slope, temp)
 Percolation - f(soil properties, slope, temp) Evapotranspiration - f(time series, land properties) Runoff - f(soil properties, slope, temp)")
40
Nutrient and Sediment Simulation MeteorologyPrecipitation Runoff and Groundwater Land Morphology Nitrogen Cycle Sediment Export Phosphorus Cycle Nutrient Inputs

41
Nutrient Simulation Nitrogen Cycle

42
Watershed Model Forest Nitrogen Cycle

43
Agriculture Nutrient Balance Atmospheric Deposition, Manure, Chemical Fertilizer Denitrification Volatilization Export to Streams Uptake by Crops

44
Forest Nutrient Balance Atmospheric Deposition Denitrification Volatilization Export to Streams

45
Urban Nutrient Balance Atmospheric Deposition, Other sources Denitrification Volatilization Export to Streams Uptake by grasses

46
Land-Water Connection X 3000 acres X 400 acres X 100 acres X 200 acres X 900 acres X 1500 acres X 300 acres Forest Pervious Urban Impervious Urban Conventional Till Conservation Till HayPasture

47
Land-Water Connection X 3000 acres X 400 acres X 100 acres X 200 acres X 900 acres X 1500 acres X 300 acres Forest Pervious Urban Impervious Urban Conventional Till Conservation Till HayPasture Deposition, Point Source, Septic

48
Water Simulation - Physically Based

49
River Simulation - Nitrogen

50
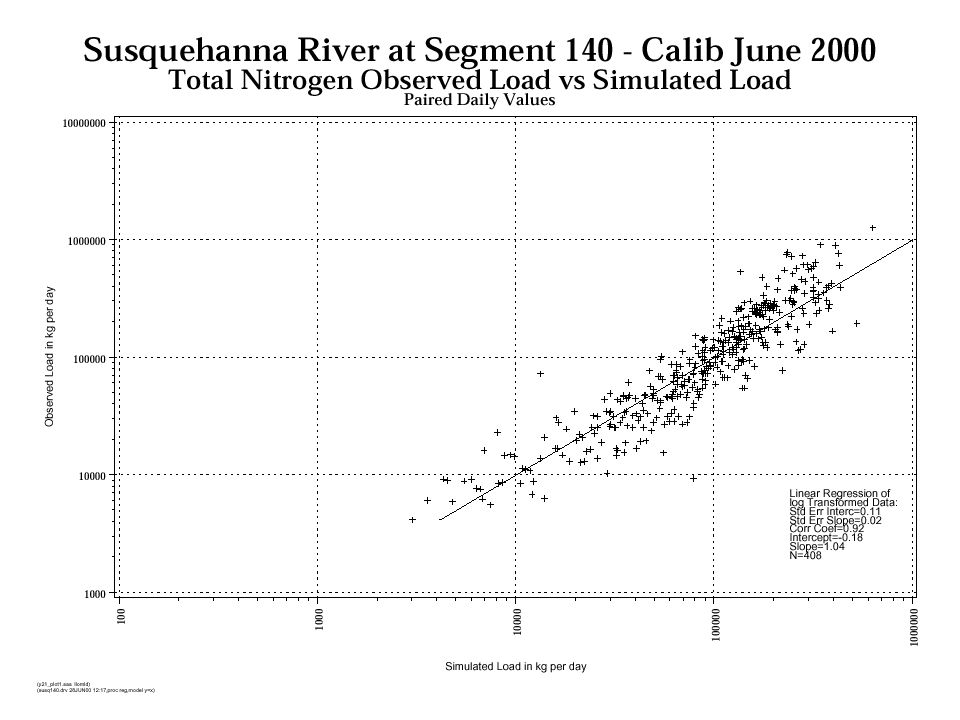
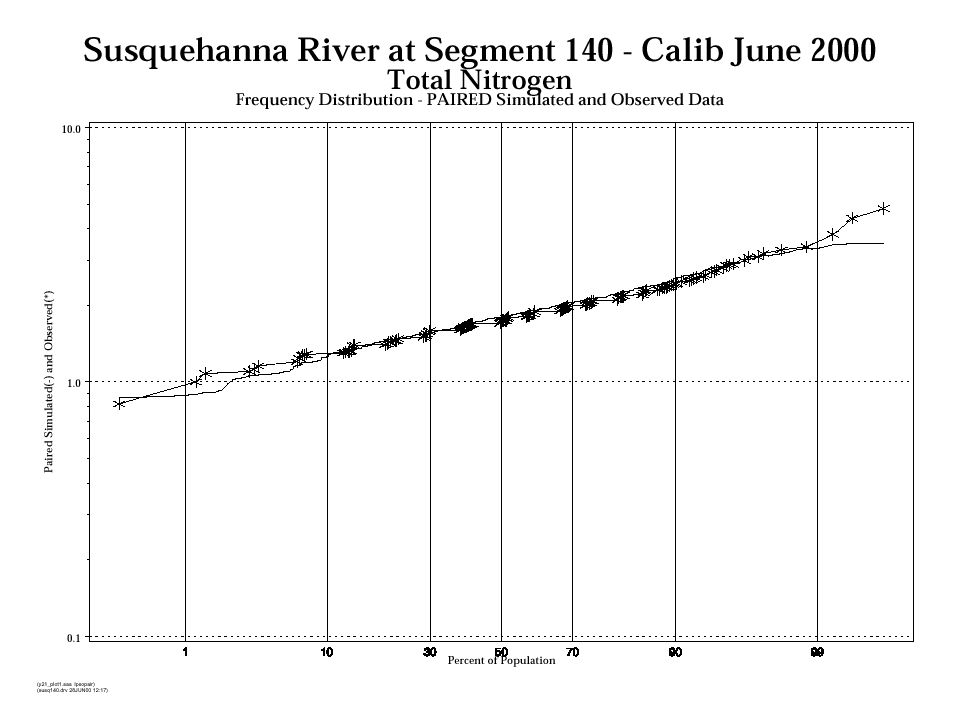
Two Points of Calibration Land Surface Rain River Reach

55
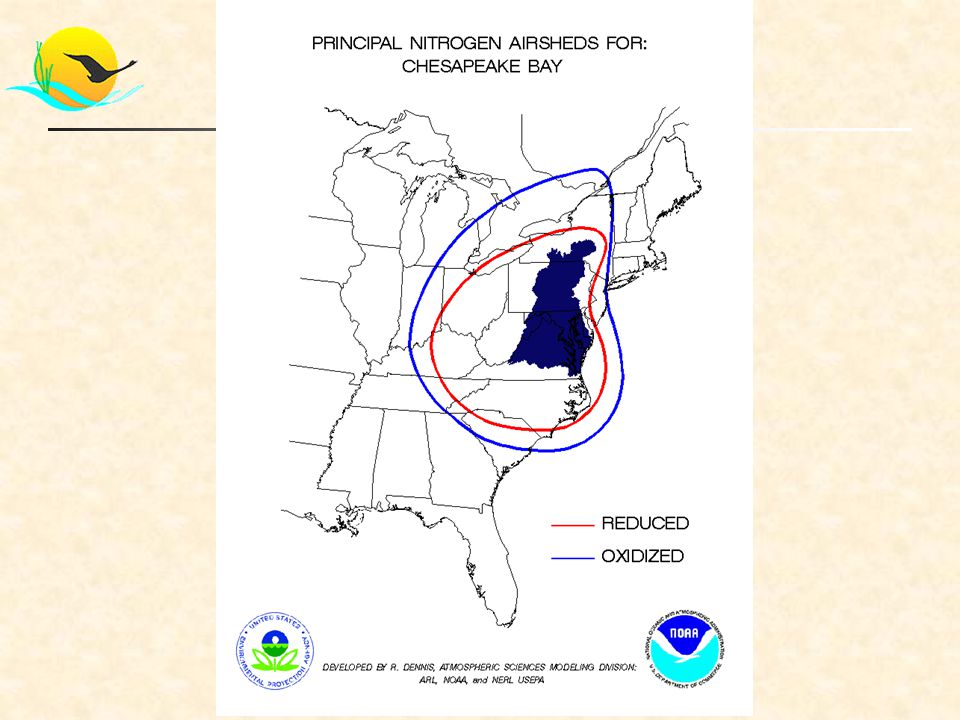
Chesapeake Bay Program Atmospheric Deposition Model And Impacts of Deposition on Loads

56
Atmospheric Deposition Model

58
Deposition to the watershed is calculated from monitoring data – NADP nutrient concentrations / precipitation. The Regional Acid Deposition Model (RADM) changes deposition to the watershed based on changes in emissions throughout the airshed from utility, mobile, and industrial sources.
 changes deposition to the watershed based on changes in emissions throughout the airshed from utility, mobile, and industrial sources..")
59
Nitrogen Deposition Versus Delivered Load Atmospheric Inputs: Of the total NOx deposition to the Chesapeake Bay watershed land area, about 50% originates from emissions in Bay-watershed states:__________________ PA = 17%, VA = 10%, MD = 9%, WV = 7%, NY = 5%, DE = 1% OH, NC, NY, KY, IN, TN, MI = 27% Other States in 37-State Area = 24% Delivered Loads From All Sources: Of the total nitrogen load delivered to the Chesapeake Bay watershed, about 32% is attributable to atmospheric deposition, based on the proportion of anthropogenic inputs.

60
Nitrogen Deposition Versus Delivered Load For all air scenarios, landuses, fertilizer applications, point sources, septic, and BMP implementation are held constant at 2000 levels - Only atmospheric deposition varies

61
Model BMP Simulation Input Data Land Simulation River Simulation Output Opportunities for BMPs

62
1985 Versus 2001 and Cap Load Allocations Nutrient and Sediment Loads Delivered to the Chesapeake Bay By Major Tributary

63
Nitrogen Loads Delivered to the Chesapeake Bay

64
Phosphorus Loads Delivered to the Chesapeake Bay

65
Land-Based Sediment Loads Delivered to the Chesapeake Bay

66
Phase 5 Calibration Phase 4.3 – 26 calibration stations Phase 5.0 – 236 hydrology and 100+ water quality calibration stations

67
Old vs. New Segments

68
Phase 5 Improvements Segmentation Calibration Land cover/land use (2000, year by year) Rainfall Atmospheric Deposition Urban BMPs (seasonality, extreme weather events, design life considerations) Lots more…so stay tuned!
 Rainfall Atmospheric Deposition Urban BMPs (seasonality, extreme weather events, design life considerations) Lots more…so stay tuned!")
69
Send Donuts to: Rich Batiuk U.S. EPA Chesapeake Bay Program Office 410-267-5731 batiuk.richard@epa.gov www.chesapeakebay.net

Similar presentations