Download presentation
Presentation is loading. Please wait.

1
Recent Finnish PM studies / 2 examples

2
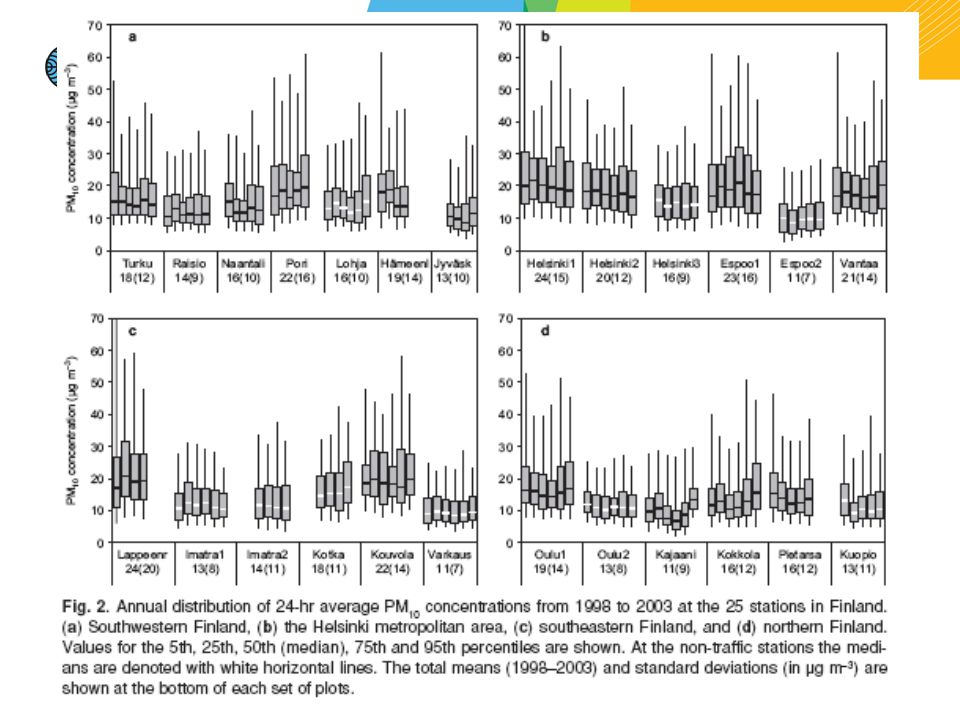
Characterizing temporal and spatial patterns of urban PM10 using six years of Finnish monitoring data Pia Anttila and Timo Salmi Finnish Meteorological Institute, Air Quality Research, P.O. Box 503, FI-00101 Helsinki, Finland Boreal Env. Res. 11:463-479 www.borenv.netwww.borenv.net (freely downloadable!)
.")
3
Location of the stations

6
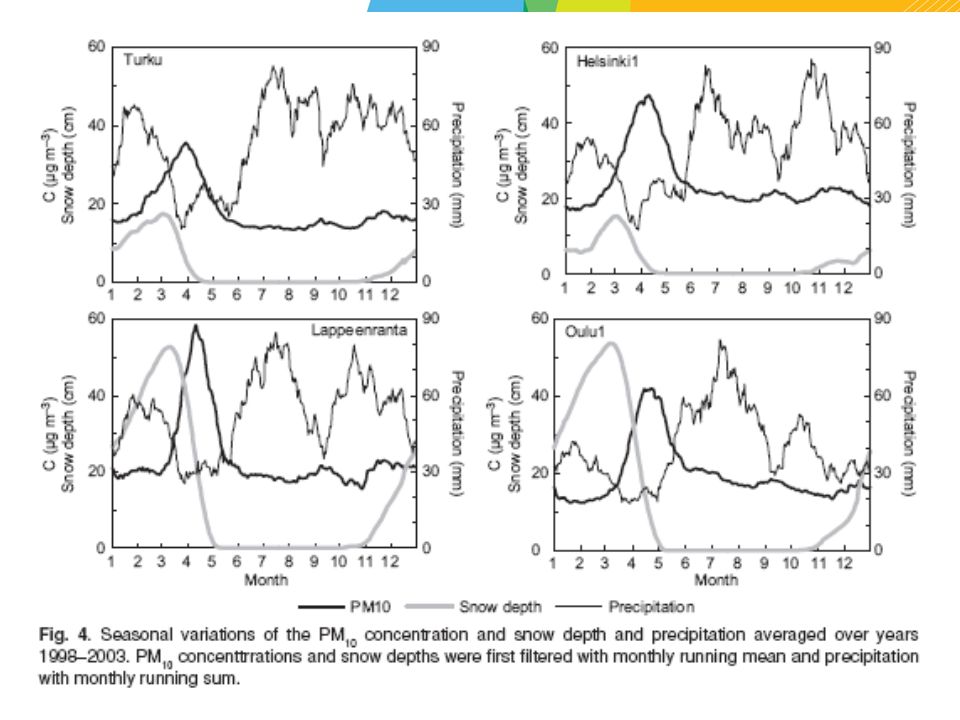
PM10 ”the spring peak”

7
Co-located PM10 & PM2.5 : Very few continuously monitoring stations at the moment!

8
Regional scale modeling As a practical example of FMI-SILAM application we present an analysis of an exceptionally severe and wide-spread pollution episode in (Northern) Europe in spring of 2006.
 Europe in spring of 2006.")
9
PM 2.5 and PM 10 (TEOM) Ion composition: Particle into Liquid Sampler (PILS), high time resolution (15 min) Black carbon: aethalometer, 5 min Filter samples,12 or 24 hours elemental and organic carbon, water-soluble organic carbon water-soluble ions levoglucosan Aerosol measurements at the station of Kumpula (urban background, Helsinki) SMEAR III
 Ion composition: Particle into Liquid Sampler (PILS), high time resolution (15 min) Black carbon: aethalometer, 5 min Filter samples,12 or 24 hours elemental and organic carbon, water-soluble organic carbon water-soluble ions levoglucosan Aerosol measurements at the station of Kumpula (urban background, Helsinki) SMEAR III")
10
Hourly averaged PM 2.5 ( g/m 3 ), Kumpula, Feb – May 2006 An episode of 12 days in April – May
, Kumpula, Feb – May 2006 An episode of 12 days in April – May")
11
Hourly averages of PM 2.5 at Virolahti (regional background), South-Eastern Finland, during 1.1.2006 – 13.8.2006 Two forest fire episodes, in April – May, and in July - August
, South-Eastern Finland, during – Two forest fire episodes, in April – May, and in July - August")
12
Visibility degradation: Views over North-Eastern Helsinki during and after the forest fire episode in April – May, 2006

13
The specific tracer of wood combustion, levoglucosan, was also clearly elevated during episodic periods (Kumpula).
.")
14
The measured composition of PM 2.5 at Kumpula,16 April – 10 May 2006 EC = Elemental carbon OC = Organic carbon POM = Particulate organic matter SO 4 = sulphate WIS = water insoluble WS = water soluble Organic carbon is elevated during episodes Mass closure varies from 69 to 76 %. Assumption: POM = 1.6 OC

15
Modelling Emissions: Near real-time information of fires from the MODIS instrument (onboard Aqua and Terra satellites) New computational method developed based on MODIS- measured temperature anomalies Atmospheric dispersion: Lagrangian dispersion model SILAM Meteorological input data from HIRLAM and ECMWF
 New computational method developed based on MODIS- measured temperature anomalies Atmospheric dispersion: Lagrangian dispersion model SILAM Meteorological input data from HIRLAM and ECMWF")
16
Total predicted PM 2.5 emission flux originated from wildland fires during 20.4 – 15.5.2006, computed based on the measured MODIS temperature anomalies, unit: tons PM. Extensive fire areas in Western Russia

17
The computed PM 2.5 concentrations from fires during one selected hour, at 12:00 on 27 April 2006 (unit: µg/m 3 ). The concentrations were transported over a wide area that extended from the Black Sea to Spitzbergen.

18
The computed PM 2.5 concentrations from fires at 12:00 on 9 May 2006 (unit: µg/m 3 ).
.")
19
2007: SILAM-model results (forecast) used for forecasting regional scale concentrations Ref:Saarikoski, S., et al., 2006. Major biomass burning episode in northern Europe in spring 2006: the chemical composition and atmospheric chemistry of aerosols. Atmos.Environ., http://dx.doi.org 10.1016/j.atmosenv.2006.12.053

20
Comparison of measured and predicted concentrations (Kumpula). The predicted primary PM 2.5 and sulphate from all European sources has also been shown.

21
Anthrop.: Birch: ENVISAT: Fires: Multi-component modelling, SILAM, 9 May 2006 Predicted PM 2.5 from forest fires Predicted birch pollen concentrations Satellite observations, ENVISAT Predicted anthropogenic primary PM 2.5

22
Operational air quality forecasts http://silam.fmi.fi Emissions: EMEP 2003 + forest fires (MODIS in near real time) Dispersion model SILAM Whole Europe, resolutions 1 hour, 30 km (Finland :9 km) Forecast horizon 54 hours Updates: daily, about noon PM2.5, PM10, SO2, SO4 The SILAM program is publicly available from the above www address.
 Dispersion model SILAM Whole Europe, resolutions 1 hour, 30 km (Finland :9 km) Forecast horizon 54 hours Updates: daily, about noon PM2.5, PM10, SO2, SO4 The SILAM program is publicly available from the above www address.")
23
Problems only in spring ? No! The summer of 2006 was exceptionally dry Easterly winds were prevailing for an exceptional long period in August 2006 Frequently occurring wild land fires, especially in Russia and Estonia led to elevated fine particle concentrations from 18 July to 28 August; H. Nyman 21.8.2007 The synoptic situation at 21 August 00UTC over Europe

24
MODIS rapid system 21.8 klo. 9.40 UTC Smoke plume MODIS rapid system 7.8 klo. 9.25UTC

25
PM 2.5 concentrations August 2006

26
SILAM operational simulations for the August episode

27
Research needs in forecasting fire plumes The propagation of fires in terrain, fire type (flaming, smouldering) and intensity The evaluation of PM emissions based on satellite data o Cloudiness can prevent the detection o The distinction of wild land and other fires o Combined use of data from several instruments The evaluation of initial dispersion, including plume rise Systematic evaluation of forecasts against data
 and intensity The evaluation of PM emissions based on satellite data o Cloudiness can prevent the detection o The distinction of wild land and other fires o Combined use of data from several instruments The evaluation of initial dispersion, including plume rise Systematic evaluation of forecasts against data")
28
Conclusions Exceptionally intensive wild-land fires in 2006 in Europe, especially in Western Russia Pronounced visibility degradation due to particulate matter from fires The concentrations of biomass burning tracers - levoglucosan, potassium and oxalate, and that of particulate organic matter substantially increased during the fires The model computations (spring) showed that the fire plumes covered an extensive area of Europe, extending, e.g., to Spitzbergen in the north Multicomponent modelling is needed to differentiate the various PM components
 showed that the fire plumes covered an extensive area of Europe, extending, e.g., to Spitzbergen in the north Multicomponent modelling is needed to differentiate the various PM components")
29
Ongoing: development and evaluation of SILAM-model PM2.5 (PM1/PM10 ) data from Europe needed for 4- 8 /2006 Invitation : please consider participating (writer/acknowl.) in the evaluation paper by providing your own PM2. 5 data contact:mikhail.sofiev@fmi.fi ; ari.karppinen@fmi.fi

Similar presentations


>")


 EMEP workshop on Particulate Matter.>")


