Download presentation
Presentation is loading. Please wait.

1
Concepts in Beef Cow Nutrition Aaron Stalker University of Nebraska-Lincoln

2
Introduction Feed costs –Major factor in economic efficiency Harvested forages –Majority of total feed costs

3
Annual operating costs per cow Northern Great Plains USDA, Economic Research Service, 2002 $419

4
Annual operating costs per cow Northern Great Plains USDA, Economic Research Service, 2002 $419 46%

5
Biological Priority for Nutrients Priority Function 1Maintenance 2Growth 3Milk Production 4Reproduction

8
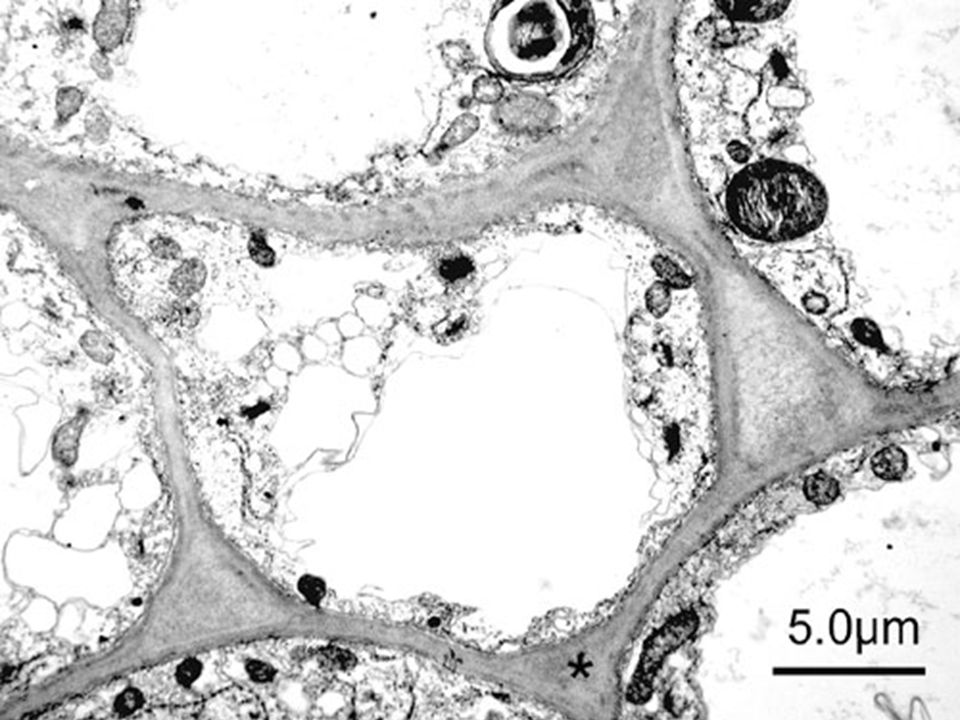
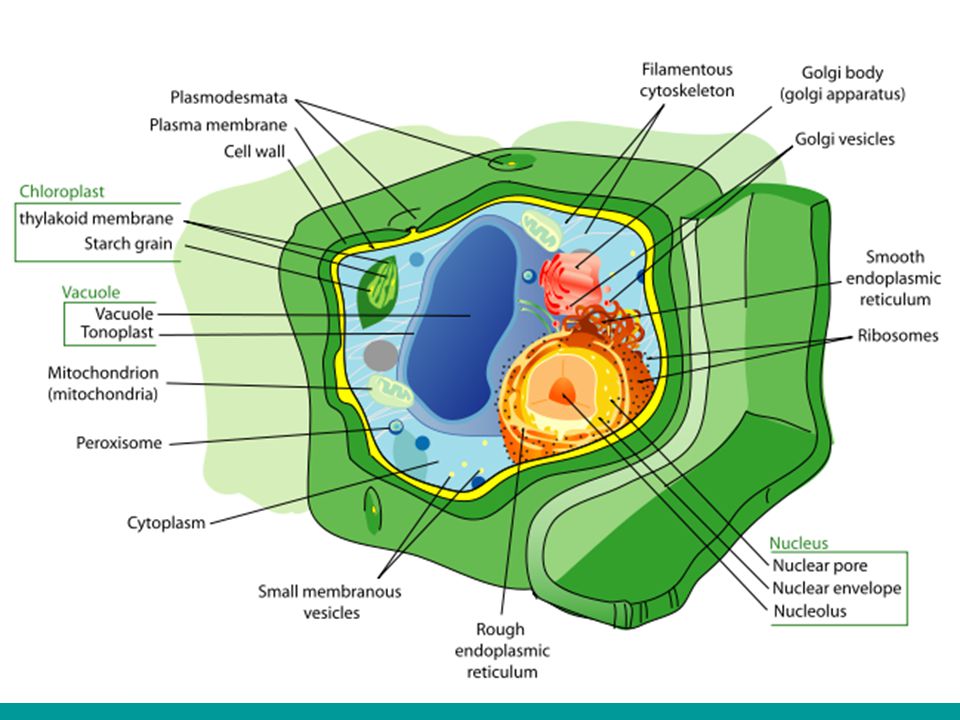
Plant Cell PROTEIN SUGARS STARCH PECTINS FATS PRIMARY WALL SECONDARY WALL CELL CONTENTS CROSS SECTION

9
Inside SECONDARY WALL PRIMARY WALL CELLULOSE HEMICELLULOSE LIGNINACID DETERGENT FIBER (ADF) NEUTRAL DETERGENT FIBER (NDF) OUTSIDE
 NEUTRAL DETERGENT FIBER (NDF) OUTSIDE")
13
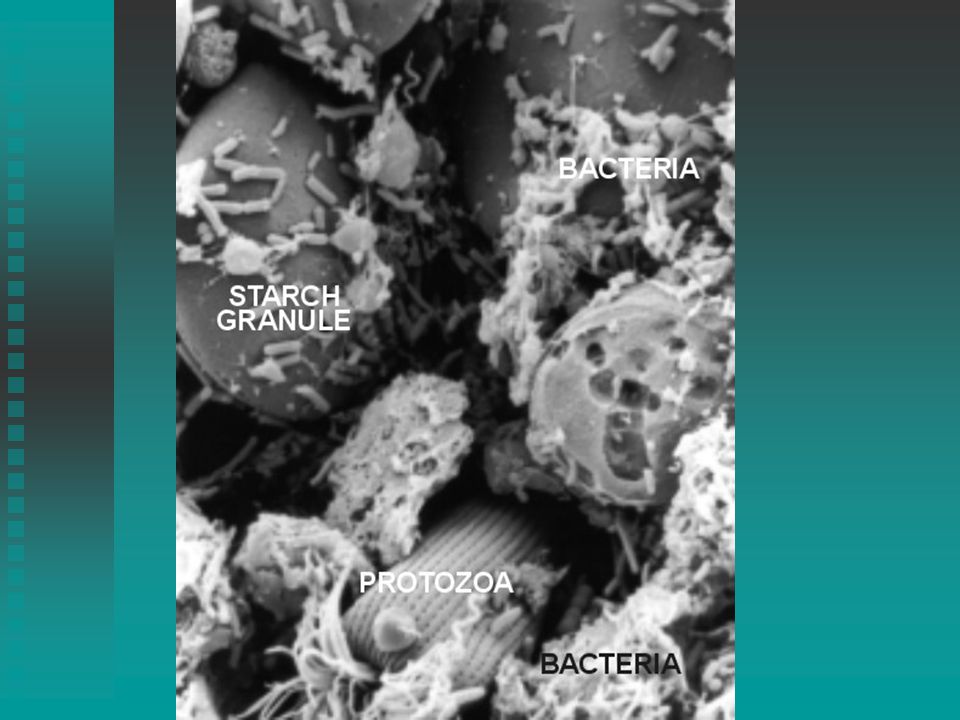
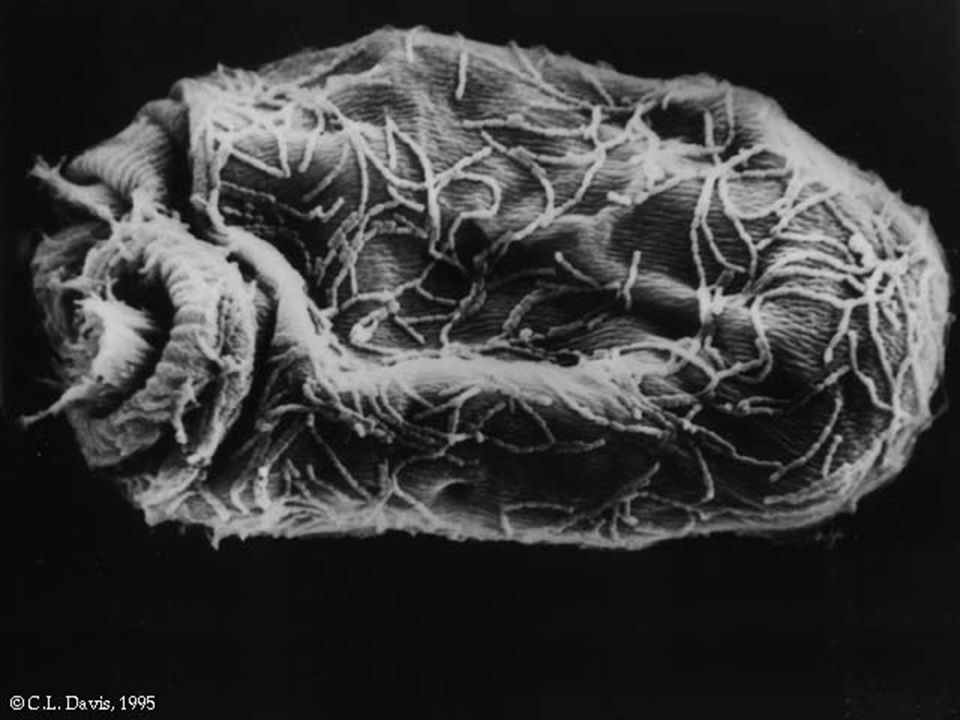
Ruminal Microorganisms n Ferment Structural Carbohydrates u Volatile Fatty Acids F Acetate, Propionate, Butyrate n Microbial Crude Protein

14
What is MP? n Metabolizable protein (MP) system (1996 NRC) u Acknowledges ruminal microorganisms F Protein (nitrogen) requirement F Separate from host u Degradable intake protein (DIP) F Fraction of total protein degraded in rumen u Primary source of nitrogen for microorganisms
 system (1996 NRC) u Acknowledges ruminal microorganisms F Protein (nitrogen) requirement F Separate from host u Degradable intake protein (DIP) F Fraction of total protein degraded in rumen u Primary source of nitrogen for microorganisms.")
15
What is MP? n Metabolizable protein (MP) system u Undegradable intake protein (UIP) F Fraction of total intake protein not degraded in rumen F Passes to small intestine u Metabolizable protein F Sum of digestible microbial protein and undegradable intake protein
 system u Undegradable intake protein (UIP) F Fraction of total intake protein not degraded in rumen F Passes to small intestine u Metabolizable protein F Sum of digestible microbial protein and undegradable intake protein.")
16
Dietary Protein SMALL INTESTINE RUMEN

17
Dietary Protein SMALL INTESTINE

18
Dietary Protein SMALL INTESTINE Degradable Intake Protein

19
Dietary Protein SMALL INTESTINE Degradable Intake Protein

20
Dietary Protein SMALL INTESTINE Degradable Intake Protein

21
Dietary Protein SMALL INTESTINE Degradable Intake Protein

22
Dietary Protein SMALL INTESTINE Degradable Intake Protein Undegraded Intake Protein aka Bypass or Escape

23
Dietary Protein SMALL INTESTINE Degradable Intake Protein Undegraded Intake Protein aka Bypass or Escape Metabolizable Protein

24
Dietary Protein SMALL INTESTINE Degradable Intake Protein

25
Dietary Protein SMALL INTESTINE Degradable Intake Protein

26
Dietary Protein SMALL INTESTINE Degradable Intake Protein

27
Dietary Protein SMALL INTESTINE

28
Demonstration of NRC software

29
Feed Costs Directly related to calving date Survey of cow calf producers –Western and North Central Nebraska –80% March-calving herd –Requires feeding hay 2427 kg per cow (Clark et al., 2004)
")
30
Reduce Harvested Forage Key Concepts –Cow nutrient requirements –Forage nutrient supply

31
Reduce Harvested Forage Key Concepts –Cow nutrient requirements –Forage nutrient supply

32
Metabolizable Protein Requirement of a 1200lb March-Calving Cow, 20 lb milk Peak Lactation Weaning Fetal Growth National Research Council, Nutrient Requirements of Beef Cattle, 1996

33
Biological Priority for Nutrients Priority Function 1Maintenance 2Growth 3Milk Production 4Reproduction

34
Potential metabolizable protein from native upland forage in Nebraska Sandhills Cow weighing 1200 lbs with 20 lbs peak milk, Adapted from Lardy et al., 2004

35
Metabolizable Protein Requirement of a March-Calving Cow and Forage Supply March Calving Cow weighing 1200 lbs with 20 lb peak milk production

36
Metabolizable Protein Requirement of a June-Calving Cow and Forage Supply June Calving Cow weighing 1200 lbs with 20 lb peak milk production

37
Hypothesis June-Calving –Annual operating costs decreased Extend grazing Limited Harvested Forage Match requirements with supply

38
Objectives Compare productivity –Traditional: March-calving –Extended Grazing: June-calving Develop net returns budgets

39
Study Site

40
*

41
*

42
Materials and Methods 195 cows –75 March-calving: Traditional –120 June-calving: Extended Grazing First two years not included 4 Years of data –4 production cycles

43
Materials and Methods 195 cows –75 March-calving: Traditional –120 June-calving: Extended Grazing 60 breeding season on meadow 60 breeding season on upland range 4 Years of data –4 production cycles

44
Herd Management Traditional system –Fed hay mid-January through April Extended Grazing system –Fed supplement –Fed hay post-calving and winter storms

45
Weaning Calves weaned at 210 days of age –Traditional: March-born October –Extended Grazing: June-born January Pregnancy status determined Weaning rates

46
Post-weaning management Traditional: March-born –Grazed sub-irrigated meadow for 21 days Extended Grazing: June-born –Fed hay and supplement for 21 days

47
Economic analysis Budgets include actual costs of: –Harvesting hay –Purchased feed –Grazing Fence and water maintenance Monitoring livestock –Labor –Operating interest and overhead –Heifer replacement –Veterinary and medicine

48
Economic analysis (cont.) Budgets do not include costs of: –Land –Property taxes –Insurance –Buildings –Management
 Budgets do not include costs of: –Land –Property taxes –Insurance –Buildings –Management")
49
Statistical Analysis Experimental design –Completely randomized Experimental unit –Calving system Replication year

50
Statistical Analysis (cont.) Proc GLM SAS Single degree of freedom orthogonal contrasts: –Traditional vs. Extended Grazing All measured responses –Range vs. Meadow within Extended system Pregnancy rate Weaning rate

51
Results and Discussion

52
TraditionalExtended Grazing ItemRange Meadow Pregnancy Rate, % ab 94.892.191.7 Weaning Rate, % ab 88.890.287.7 a Means were similar (P>0.10) for Traditional vs. Extended Grazing. b Means were similar (P>0.10) for Range vs. Meadow within Extended Grazing system. Pregnancy and weaning rates of cows in Traditional and Extended Grazing systems
 for Range vs. Meadow within Extended Grazing system. Pregnancy and weaning rates of cows in Traditional and Extended Grazing systems.")
53
TraditionalExtended Grazing ItemRange Meadow Pregnancy Rate, % ab 94.892.191.7 Weaning Rate, % ab 88.890.287.7 a Means were similar (P>0.10) for Traditional vs. Extended Grazing. b Means were similar (P>0.10) for Range vs. Meadow within Extended Grazing system.
 for Range vs. Meadow within Extended Grazing system..")
54
Weaning weight of calves in Traditional and Extended Grazing systems ItemTraditionalExtended Grazing Weaning weight, kg 220 a 189 b Gross value, $439428 Sale price, $/45 kg 90.51 102.72 Cow cost/weaned calf, $252176 ab Means differ (P<0.05) for Traditional vs. Extended Grazing.

55
Gross value of calves in Traditional and Extended Grazing systems ItemTraditionalExtended Grazing Weaning weight, kg 220 a 189 b Gross value, $439428 Sale price, $/45 kg 90.51 102.72 Cow cost/weaned calf, $252176 ab Means differ (P<0.05) for Traditional vs. Extended Grazing.

56
Seasonal price index of 227-271 kg steer calves 1993-2003 Source: USDA, Agricultural Marketing Service, western Nebraska-eastern Wyoming market 1993-1997, Nebraska auction markets 1998-2003.

57
Seasonal price index of 227-271 kg steer calves 1993-2003 Source: USDA, Agricultural Marketing Service, western Nebraska-eastern Wyoming market 1993-1997, Nebraska auction markets 1998-2003.

58
Seasonal price index of 227-271 kg steer calves 1993-2003 Source: USDA, Agricultural Marketing Service, western Nebraska-eastern Wyoming market 1993-1997, Nebraska auction markets 1998-2003.

59
Steer calf price 1998-2003 Source: USDA, Nebraska auction markets 1998-2003.

60
Sale price of calves in Traditional and Extended Grazing systems ItemTraditionalExtended Grazing Weaning weight, kg 220 a 189 b Gross value, $439428 Sale price, $/45 kg 90.51 102.72 Cow cost/weaned calf, $252176 ab Means differ (P<0.05) for Traditional vs. Extended Grazing.

61
Sale price of calves in Traditional and Extended Grazing systems ItemTraditionalExtended Grazing Weaning weight, kg 220 a 189 b Gross value, $439428 Sale price, $/45 kg 90.51 102.72 Cow cost/weaned calf, $252176 ab Means differ (P<0.05) for Traditional vs. Extended Grazing.

62
Average resource use for Traditional and Extended Grazing cows over 4 years ItemTraditionalExtended Grazing Hay fed, kg 1787 100 Commercial Supplement, kg 44 70 Grazing days 233 357 Feeding labor, hour/head 0.66 0.18 Calving labor, hour/head 0.57 0.30

63
Average resource use for Traditional and Extended Grazing cows over 4 years ItemTraditionalExtended Grazing Hay fed, kg 1787 100 Commercial Supplement, kg 44 70 Grazing days 233 357 Feeding labor, hour/head 0.66 0.18 Calving labor, hour/head 0.57 0.30

64
Average resource use for Traditional and Extended Grazing cows over 4 years ItemTraditionalExtended Grazing Hay fed, kg 1787 100 Commercial Supplement, kg 44 70 Grazing days 233 357 Feeding labor, hour/head 0.66 0.18 Calving labor, hour/head 0.57 0.30

65
Average resource use for Traditional and Extended Grazing cows over 4 years ItemTraditionalExtended Grazing Hay fed, kg 1787 100 Commercial Supplement, kg 44 70 Grazing days 233 357 Feeding labor, hour/head 0.66 0.18 Calving labor, hour/head 0.57 0.30

66
Average resource use for Traditional and Extended Grazing cows over 4 years ItemTraditionalExtended Grazing Hay fed, kg 1787 100 Commercial Supplement, kg 44 70 Grazing days 233 357 Feeding labor, hour/head 0.66 0.18 Calving labor, hour/head 0.57 0.30

67
Average post-weaning resource use for March and June born calves over 4 years ItemTraditionalExtended Grazing Feeding labor, hour/head- 0.15 Hay fed, kg- 200 Commercial Supplement, kg- 47.6 Grazing days21 -

68
Average post-weaning resource use for March and June born calves over 4 years ItemTraditionalExtended Grazing Feeding labor, hour/head- 0.15 Hay fed, kg- 200 Commercial Supplement, kg- 47.6 Grazing days21 -

69
Average post-weaning resource use for March and June born calves over 4 years ItemTraditionalExtended Grazing Feeding labor, hour/head- 0.15 Hay fed, kg- 200 Commercial Supplement, kg- 47.6 Grazing days21 -

70
Average post-weaning resource use for March and June born calves over 4 years ItemTraditionalExtended Grazing Feeding labor, hour/head- 0.15 Hay fed, kg- 200 Commercial Supplement, kg- 47.6 Grazing days21 -

71
Summary of Traditional and Extended Grazing systems Item Extended GrazingTraditionalDifference Gross value, $428439 -11 Cow cost, $17625276

72
Net returns per calf in Traditional and Extended Grazing systems Item Extended GrazingTraditionalDifference Gross value, $428439 -11 Cow cost, $17625276 Net returns$252$187$65

73
Conclusions Traditional vs. Extended Grazing system –Similar pregnancy rate –Similar weaning rate

74
Conclusions Traditional vs. Extended Grazing system –Weaned calf –Approximately equivalent value Seasonal price Price slide

75
Conclusions Traditional vs. Extended Grazing system –Extended Grazing Lower feed costs Greater net returns

76
Implications Changing calving date –Effective means of increasing net returns Match –Cow nutrient requirements –Forage nutrient supply Not March vs. June

77
Implications Date of calving varies –Geographic location –Forage resources

78
Metabolizable Protein Requirement of a 1200lb March-Calving Cow, 20 lb milk Peak Lactation Weaning Fetal Growth National Research Council, Nutrient Requirements of Beef Cattle, 1996

79
Metabolizable Protein Requirement of a 1200lb March-Calving Cow, 20 lb milk Peak Lactation Weaning Fetal Growth National Research Council, Nutrient Requirements of Beef Cattle, 1996

80
Metabolizable Protein Requirement of a March-Calving Cow and Forage Supply March Calving Cow weighing 1200 lbs with 20 lb peak milk production

81
Weaning Dates 8 weaning dates: –August 18, 1999 to November 24, 1999 –August 16, 2000 to November 22, 2000 (140 to 240 days after calving)
")
82
Effect of Weaning Date on Change in Cow Body Condition Score R 2 =.95

83
August weaning 1. No protein supplement during winter grazing 2. Protein supplement during winter grazing Weaning and Supplement Treatments for March Calving Cows November weaning 1. No protein supplement during winter grazing 2. Protein supplement during winter grazing

84
Effect of weaning date on cow body condition score

85
Effect of weaning date on pregnancy rate P = 0.56

86
Effect of weaning date on weaning weight P = <0.001

87
Effect of weaning date on carcass weight P = 0.56

88
Effect of supplement on cow body condition score

89
Effect of supplement on pregnancy rate P = 0.27

90
Effect of supplement on weaning weight P = <0.001

91
Effect of supplement on carcass weight P = 0.04

92
Effect of supplement on cow body condition score

93
P rotein supplement during winter grazing 1. Graze meadow pre breeding 2. Feed hay pre breeding No Protein supplement during winter grazing 1. Graze meadow pre breeding 2. Feed hay pre breeding Follow up study

94
Winter Protein Supplement No Protein Supplement

95
Spring Meadow Hay

96
Effect of supplement on cow body condition score *** **

97
Effect of supplement on pregnancy rate P = 0.46

98
Effect of supplement on percentage of live calves at weaning P = 0.02

99
Effect of supplement on calf weight P = 0.29 P = 0.02

100
Effect of supplement on carcass weight P = 0.23

101
Effect of meadow grazing on cow body condition score ***

102
Effect of meadow grazing on pregnancy rate P = 0.88

103
P = 0.15 Effect of meadow grazing on percentage of live calves at weaning

104
Effect of meadow grazing on calf weight P = 0.20 P = 0.01

105
Effect of meadow grazing on carcass weight P = 0.67

106
How much supplemental protein? Cows grazing native winter range, Nebraska Sandhills: 0.4 lb CP mid-late gestation (Dec-Feb) 0.6 lb CP 30 days pre-calving 1.0 lb CP 30-45 days post calving
 0.6 lb CP 30 days pre-calving 1.0 lb CP days post calving.")
107
How much supplemental protein? Cows grazing native winter range, Nebraska Sandhills: 0.4 lb CP mid-late gestation (Dec-Feb) 1.5 lb DDG (as fed) 0.6 lb CP 30 days pre-calving 2.2 lb DDG (as fed) 1.0 lb CP 30-45 days post calving 3.0 lb DDG (as fed)
 1.5 lb DDG (as fed) 0.6 lb CP 30 days pre-calving 2.2 lb DDG (as fed) 1.0 lb CP days post calving 3.0 lb DDG (as fed).")
108
How much supplemental protein? Cows grazing native winter range, Nebraska Sandhills: 0.4 lb CP mid-late gestation (Dec-Feb) 2.0 lb of CP in total diet 0.6 lb CP 30 days pre-calving 2.2 lbs of CP in total diet 1.0 lb CP 30-45 days post calving 2.6 lbs of CP in total diet
 2.0 lb of CP in total diet 0.6 lb CP 30 days pre-calving 2.2 lbs of CP in total diet 1.0 lb CP days post calving 2.6 lbs of CP in total diet.")
109
Price Shop Calculate the cost per unit of the nutrient(s) you need. Evaluate other factors. Purchase in most economical way. EXAMPLE: $/Ton of Feed # of CP/Ton $200/ton of DDG 600# of CP/Ton DDG = $/lb of CP = $.33/lb of CP

110
Cost of Supplements $/Ton % CP Cost of CP Cottonseed Pellets300 32 0.47 20% Cube (AN) 265 20 0.66 32% Liquid (16% NPN) 285 21 0.68 12% Tub 600 12 2.50 32% Cube 320 32 0.50 19% Alf. Hay (Lg Rd. ) 110 19 0.33 17% Alf. Hay 85 17 0.25
 % Alf. Hay")
111
Feed Cost Calculator www.westcentral.unl.edu Ag manager’s tool box

112
A measure of energy reserves Influences animal –Reproduction/lactation –Feed efficiency/gain –Health –Maintenance requirements Scale 1 – 9 (emaciated to obese) Body Condition Score
 Body Condition Score")
113
BCS 2 Ribs and bone structure easily visible, but no signs of physical weakness.

114
BCS 3 Very thin. No visible fat is on the ribs or brisket. Individual muscles in the hindquarters are easily visible and spinous processes are very apparent.

115
BCS 5 There is less than 0.2 inches of fat over the ribeye. Last one or two ribs may be apparent. No fat is present in the brisket.

116
BCS 6 Appearance is smooth throughout. Some fat deposition is apparent in the brisket. Individual ribs are not visible.

117
BCS 7 Brisket is full. Tail head and pin bones have protruding deposits of fat on them. Back appears square due to fat.

Similar presentations


 calorie.>")


