Download presentation
Presentation is loading. Please wait.

1
Adrian Grocott *, Steve Milan, Mark Lester, Tim Yeoman University of Leicester, U.K. *currently visiting NIPR, Japan Mervyn Freeman British Antarctic Survey, U.K. Jo Baker Virginia Tech., U.S. Dynamic sub-auroral ionospheric electric fields observed by the Falkland Islands radar during the course of a geomagnetic storm 日本学術振興会 Japan Society for the Promotion of Science

3
The Falkland Islands radar (FIR) Deployed in February 2010 at mid-latitudes to extend the existing antarctic SuperDARN fields-of-view to provide: (a) continued auroral observations during severe geomagnetic storms (b) sub-auroral observations during modest geomagnetic storms
 Deployed in February 2010 at mid-latitudes to extend the existing antarctic SuperDARN fields-of-view to provide: (a) continued auroral observations during severe geomagnetic storms (b) sub-auroral observations during modest geomagnetic storms")
4
Observations of ionospheric electric fields in the auroral zone and polar cap provide direct evidence for magnetospheric driving by the solar wind During magnetospheric substorms, processes in the inner magnetosphere drive sub-auroral electric fields which couple to the auroral zones adding to the complexity of the electrodynamics A variety of sub-auroral electric fields have been reported as polarisation jets (PJ), sub-auroral ion drifts (SAID), substorm associated radar auroral surges (SARAS), sub-auroral electric fields (SAEF), sub- auroral polarisation streams (SAPS), and auroral-westward flow channels (AWFC) These observations have tended to be described in terms of phenomenology, rather than in relation to the magnetospheric physics with which they are associated In this talk we present observations of an interval of dynamic sub- auroral ionospheric electric fields and relate them to the prevailing interplanetary and geomagnetic activity Introduction
, sub-auroral ion drifts (SAID), substorm associated radar auroral surges (SARAS), sub-auroral electric fields (SAEF), sub- auroral polarisation streams (SAPS), and auroral-westward flow channels (AWFC) These observations have tended to be described in terms of phenomenology, rather than in relation to the magnetospheric physics with which they are associated In this talk we present observations of an interval of dynamic sub- auroral ionospheric electric fields and relate them to the prevailing interplanetary and geomagnetic activity Introduction")
5
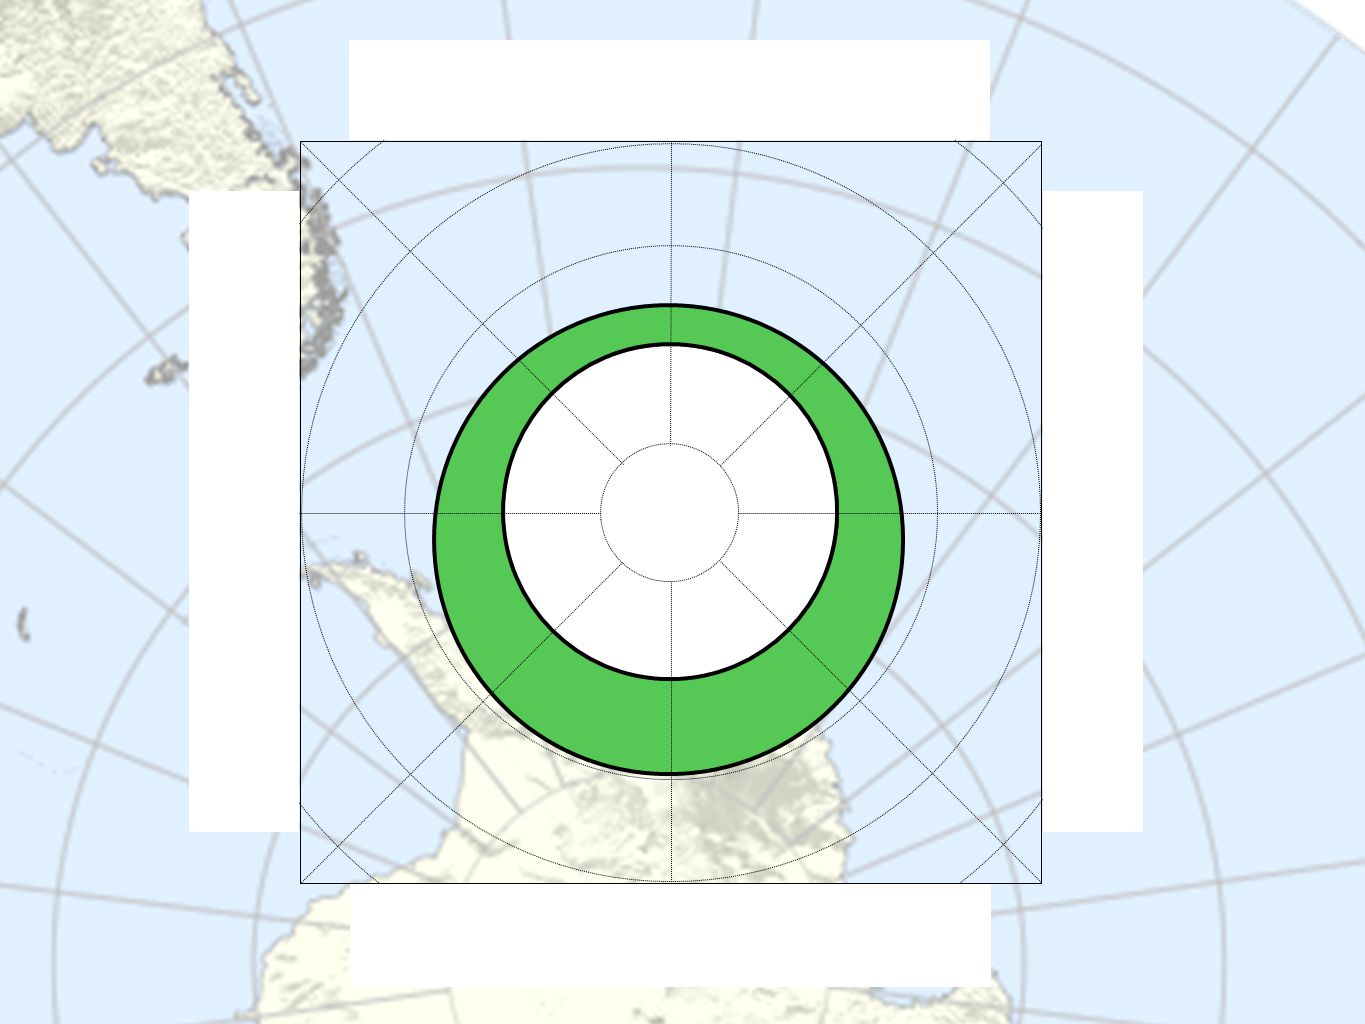
Observations of ionospheric electric fields in the auroral zone and polar cap provide direct evidence for magnetospheric driving by the solar wind Polar Cap and Auroral Convection Convection Electric Field 12 MLT 00 MLT 06 MLT18 MLT Auroral Oval Ionospheric Plasma Streamlines E

6
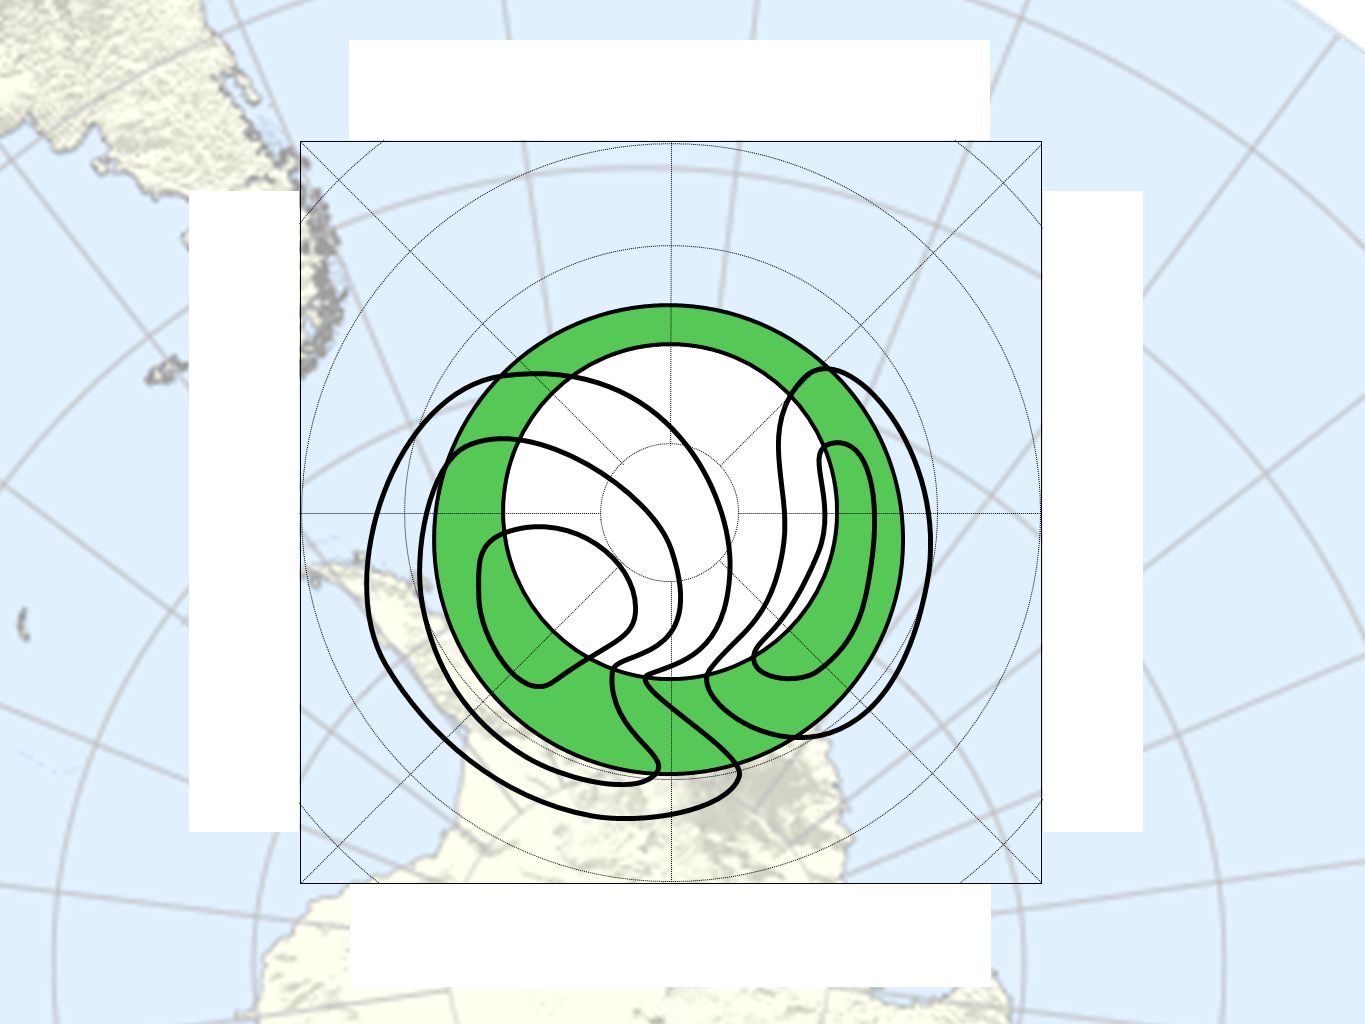
Sub-auroral Electric Field 12 MLT 00 MLT 06 MLT18 MLT During magnetospheric substorms, processes in the inner magnetosphere drive sub-auroral electric fields which couple to the auroral zones adding to the complexity of the electrodynamics [e.g. Grocott et al., 2006, 2010]. Substorm ‘Harang’ Electric Fields Auroral Oval Ionospheric Plasma Streamlines E Polar Cap and Auroral Convection

7
Polarisation jets (PJ) [Galperin et al., 1973] Sub-auroral ion drifts (SAID) [Spiro et al., 1979] Substorm associated radar auroral surges (SARAS) [Freeman et al., 1992] Sub-auroral electric fields (SAEF) [Karlsson et al., 1998] Sub-auroral polarisation streams (SAPS) [Foster and Burke, 2002] Auroral westward flow channels (AWFC) [Parkinson et al., 2003] Generally observed to be westward, pre-midnight phenomena The term SAPS used to encompass the full range of electric fields observed in the sub-auroral region including the broad ( ∼ 5 ◦ ), weak ( ∼ 100 m s −1 ) background flows which persist beyond midnight into the pre- dawn sector. SAID are fast (1 − 4 km s −1 ), latitudinally narrow ( ∼ 1 ◦ − 2 ◦ ) regions of rapid westward ion drift explicitly associated with substorm electrodynamics. Sub-Auroral Ionospheric Convection
![Polarisation jets (PJ) [Galperin et al., 1973] Sub-auroral ion drifts (SAID) [Spiro et al., 1979] Substorm associated radar auroral surges (SARAS) [Freeman et al., 1992] Sub-auroral electric fields (SAEF) [Karlsson et al., 1998] Sub-auroral polarisation streams (SAPS) [Foster and Burke, 2002] Auroral westward flow channels (AWFC) [Parkinson et al., 2003] Generally observed to be westward, pre-midnight phenomena The term SAPS used to encompass the full range of electric fields observed in the sub-auroral region including the broad ( ∼ 5 ◦ ), weak ( ∼ 100 m s −1 ) background flows which persist beyond midnight into the pre- dawn sector.](http://images.slideplayer.com/16/4907340/slides/slide_7.jpg "SAID are fast (1 − 4 km s −1 ), latitudinally narrow ( ∼ 1 ◦ − 2 ◦ ) regions of rapid westward ion drift explicitly associated with substorm electrodynamics. Sub-Auroral Ionospheric Convection.")
8
Sub-auroral Electric Field 12 MLT 00 MLT 06 MLT18 MLT Substorm ‘Harang’ Electric Fields Auroral Oval Ionospheric Plasma Streamlines E Sub-Auroral Ionospheric Convection Falkland Islands Radar (FIR) field-of-view This study focusses on storm-time radar observations of an interval of dynamic sub-auroral electric fields and their relationship to the prevailing interplanetary conditions, auroral particle precipitation, and geomagnetic activity
 field-of-view This study focusses on storm-time radar observations of an interval of dynamic sub-auroral electric fields and their relationship to the prevailing interplanetary conditions, auroral particle precipitation, and geomagnetic activity")
9
Introduction A variety of sub-auroral electric fields have been reported... auroral-westward flow channels (AWFC) polarisation jets (PJ) sub-auroral polarisation streams (SAPS) sub-auroral electric fields (SAEF) sub-auroral ion drifts (SAID) 12 MLT 00 MLT 06 MLT18 MLT Substorm ‘Harang’ Electric Fields Auroral Oval Ionospheric Plasma Streamlines...but their relationship to geomagnetic storms is yet to be fully elucidated substorm associated radar auroral surges (SARAS) E
 polarisation jets (PJ) sub-auroral polarisation streams (SAPS) sub-auroral electric fields (SAEF) sub-auroral ion drifts (SAID) 12 MLT 00 MLT 06 MLT18 MLT Substorm ‘Harang’ Electric Fields Auroral Oval Ionospheric Plasma Streamlines...but their relationship to geomagnetic storms is yet to be fully elucidated substorm associated radar auroral surges (SARAS) E.")
11
SuperDARN radar propagation E F Mesospheric scatter, e.g. meteor scatter E-region ionospheric scatter Different propagation paths lead to radar backscatter from different physical regimes: F-region ionospheric scatter Ground backscatter Multiple ‘hop’ and 1 / 2 ‘hop’ paths are also possible, enabling ranges of > 3000 km to be reached

12
Instrumentation SuperDARN FIR and BKS radar observations of sub-auroral electric fields (BKS is northern hemisphere near-conjugate radar to FIR) Upstream Driving: ACE solar wind and IMF data Magnetospheric Morphology: DMSP auroral precipitation boundaries Ring Current Dynamics: Ground geomagnetic storm-time indices 0300 UT FIR BKS
 Upstream Driving: ACE solar wind and IMF data Magnetospheric Morphology: DMSP auroral precipitation boundaries Ring Current Dynamics: Ground geomagnetic storm-time indices 0300 UT FIR BKS")
13
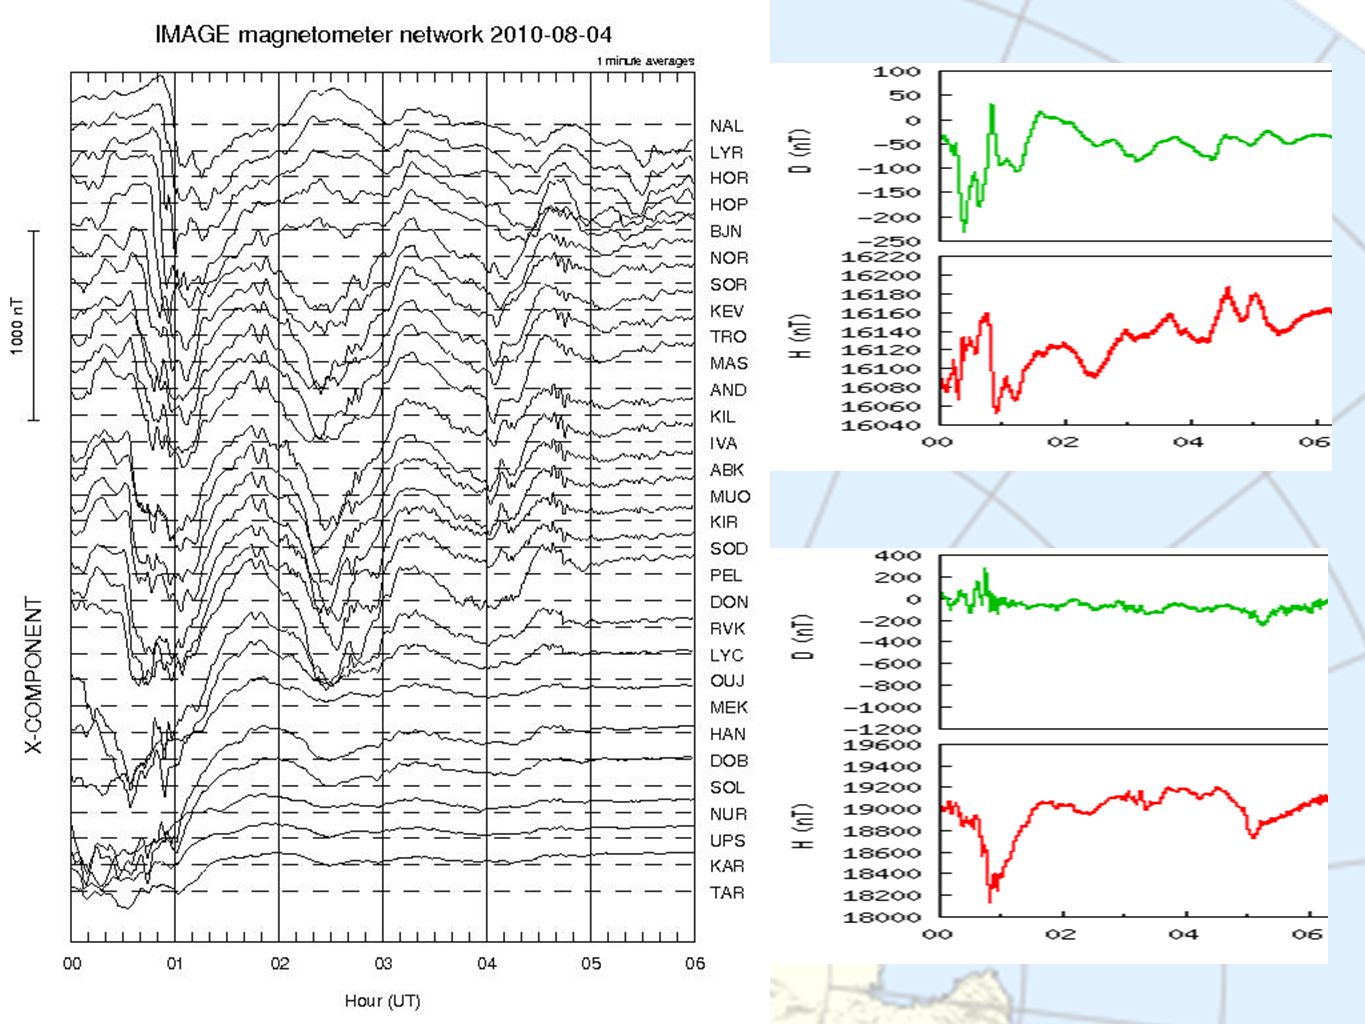
Observations: Storm Overview Time-series of data spanning 5 days between 3 and 7 August 2010 Solar wind and IMF data indicate the arrival of a fast solar wind front at ~1800 UT on 3 August AE indices reveal intervals of enhanced auroral electrojet activity Sym-H index shows the characteristic signature of a geomagnetic storm At the peak of storm activity on Aug 4th an interval of ionospheric backscatter was observed Pwr (dB)
")
14
Observations: Storm Main Phase Vel (ms -1 ) Time-series of data from 1600 UT on 3 August to 0900 UT on 4th i. Solar wind shock and sudden storm commencement (SSC) ii. Start of a ~3 h interval of strongly southward IMF iii. Peak in Asym-H index iv. Start of a sequence of 4 substorms and appearance of ionospheric radar scatter v. Start of storm recovery phase Between (iv) and (v) the radar scatter, IMF, and ground magnetic indices all exhibit oscillatory behaviour
 ii. Start of a ~3 h interval of strongly southward IMF iii. Peak in Asym-H index iv. Start of a sequence of 4 substorms and appearance of ionospheric radar scatter v. Start of storm recovery phase Between (iv) and (v) the radar scatter, IMF, and ground magnetic indices all exhibit oscillatory behaviour.")
15
Observations: Flow Channel Characteristics Comparing the FIR data with BKS data reveals a similar fast flow region at similar latitudes in both hemispheres. BKS observed a wider band of scatter, illustrating that the high speed, narrow flow channel is embedded within a wider, slower band of flow. This is consistent with previous studies of sub-auroral ion drifts (SAID) [Spiro et al., 1979] and sub-auroral polarisation streams (SAPS) [Foster and Burke, 2002]. SAID S A P S sub-auroral polarisation streams (SAPS) sub-auroral ion drifts (SAID)
 [Spiro et al., 1979] and sub-auroral polarisation streams (SAPS) [Foster and Burke, 2002]. SAID S A P S sub-auroral polarisation streams (SAPS) sub-auroral ion drifts (SAID).")
16
00 MLT 18 MLT sub-auroral electric fields (SAEF) sub-auroral polarisation streams (SAPS) sub-auroral ion drifts (SAID) Sub-auroral electric fields are associated with charge separation - caused by the penetration of partial ring current ions to lower L-shells than plasma sheet electrons [Foster, 1995]. Sub-Auroral Convection
![00 MLT 18 MLT sub-auroral electric fields (SAEF) sub-auroral polarisation streams (SAPS) sub-auroral ion drifts (SAID) Sub-auroral electric fields are associated with charge separation - caused by the penetration of partial ring current ions to lower L-shells than plasma sheet electrons [Foster, 1995].](http://images.slideplayer.com/16/4907340/slides/slide_16.jpg "Sub-Auroral Convection.")
17
00 MLT 18 MLT This study focusses on storm-time radar observations of an interval of dynamic sub-auroral ion drifts and their relationship to the prevailing interplanetary conditions and geomagnetic activity Falkland Islands Radar (FIR) field-of-view E Sub-Auroral Convection
 field-of-view E Sub-Auroral Convection")
18
Observations: Flow Channel Location Fast westward flows Electron precipitation boundary a. Polar projections of FIR data with DMSP overpasses b. Electron and c. ion energy spectrograms Circle fits to electron and ion equatorward boundaries

19
Observations: Flow Channel Location Comparison of FIR backscatter location with DMSP spectrogram data reveals the location of the flow channel to be close to, or equatorward of, the electron precipitation boundary and generally poleward of the ion boundary e-e- i+i+

20
Observations: Flow Channel Velocity Vel (ms -1 ) Vel (ms -1 ) The velocity varies across the field-of-view such that with increasing MLT it changes from strongly negative to positive i.e. the direction of flow is generally westward Time series reveal smaller-scale variations within the flow channel The data from all beams reveal the evolution of the flow with time along the length of the channel 2 6 10 14

21
Observations: Flow Channel Velocity Vel (ms -1 ) The lowest velocities were observed in beam 10 We therefore assume that the direction of the flow is perpendicular to this direction A simple beam swinging analysis then enables estimation of the full vector velocity along each beam Non-uniformity of the velocity estimated on each beam indicates variability within the flow channel
 The lowest velocities were observed in beam 10 We therefore assume that the direction of the flow is perpendicular to this direction A simple beam swinging analysis then enables estimation of the full vector velocity along each beam Non-uniformity of the velocity estimated on each beam indicates variability within the flow channel")
22
Observations: Flow Channel Velocity The lowest velocities were observed in beam 10 We therefore assume that the direction of the flow is perpendicular to this direction A simple beam swinging analysis then enables estimation of the full vector velocity along each beam Non-uniformity of the velocity estimated on each beam indicates variability within the flow channel

23
Reconnection rates and changes in open flux Reconnection rates [after Milan et al. 2006, 2007] : V D = v sw B L sin 4 ( θ / 2 ) : commonly used empirical formula for dayside reconnection rate V N = −AL × c : proxy for nightside reconnection rate, derived from studies of flux closure observed during substorms c, a constant, was chosen to give quasi-steady long-term level of open flux over the whole interval
 : commonly used empirical formula for dayside reconnection rate V N = −AL × c : proxy for nightside reconnection rate, derived from studies of flux closure observed during substorms c, a constant, was chosen to give quasi-steady long-term level of open flux over the whole interval.")
24
Flow Channel Analysis Location of flow channel and ion / electron precipitation equatorward boundary latitudes Flow channel velocity variability fluctuates on similar time-scales to channel latitude Magnetic indices AU, AL and Sym-H variations of a similar nature to the flow channel latitude variation Rec’n rates [after Milan et al. 2006, 2007] : V D = v sw B L sin 4 ( θ / 2 ), V N = −AL × c c, a constant, was chosen to give net zero flux change over the interval Shorter time-scale open flux variations match the inverse flow channel latitude
, V N = −AL × c c, a constant, was chosen to give net zero flux change over the interval Shorter time-scale open flux variations match the inverse flow channel latitude.")
25
Summary and Conclusions 1.Continuous observations of a highly dynamic, narrow channel of enhanced flow, spanning a number of substorm cycles during the main phase of a geomagnetic storm 2.Conjugate, hemisphere observations place the flows at the poleward edge of the SAPS, consistent with satellite observations of SAID [e.g. Foster and Burke, 2002] 3.Simultaneous particle precipitation data place the SAID close to the equatorward boundary of auroral electron precipitation, but generally poleward of the ion boundary 4.The separation of these boundaries increases following the onset of substorm activity; the electron boundary moves poleward with the SAID, whereas the ion boundary remains at lower latitudes 5.This latitudinal motion of the SAID is well correlated with changes in polar cap open flux content, substorm injections, small-scale velocity variations, and peaks in Asym-H - indicates a direct relationship with large-scale magnetospheric dynamics

26
Future Work Relationship between polar cap and auroral convection, and the large- scale modification of this relationship during magnetospheric substorms is well understood Next is to study the coupling of the polar cap, auroral and sub-auroral convection With the FIR radar we now have continuous coverage from 40 ◦ magnetic latitude to the pole

28
Geomagnetic Storm Overview Time-series of data spanning 5 days between 3 and 7 August 2010 Solar wind and IMF data indicate the arrival of a fast solar wind front at ~1800 UT on 3 August AE indices reveal intervals of enhanced auroral electrojet activity Sym-H index shows the characteristic signature of a geomagnetic storm At the peak of storm activity on Aug 4th an interval of ionospheric backscatter was observed Pwr (dB)
")
29
PWR (dB) An Interhemispheric survey of travelling ionospheric disturbances and their relationship to geomagnetic activity Adrian Grocott 1,2, Steve Milan 1, and Sessai Yukimatu 2 1 Dept. of Physics & Astronomy, University of Leicester, Leicester, U.K. 2 Upper Atmospheric Physics Group, NIPR, Tachikawa, Tokyo, Japan.

Similar presentations


, J. B. H. Baker.>")
 pulse of southward IMF. Magnetospheric storms are large,>")


 and A. Marchaudon (2) (1) Centre d’études des Environnements Terrestre et Planétaires UMR 8615 IPL/CNRS/UVSQ.>")