Download presentation
Presentation is loading. Please wait.

8
Store CheckoutInventory Management Customer Estimation Store Circulation Analysis and Security Interactive Signage Sales Device Customer Demographics Behavioral Data Generate Added Value Marketing Utilization Digital Media Solution generates added value for Retail Establishments Conventional Data New Value Added Data Analyze ERP / CRM Headquarters Real-time Data Weather TVSNS Call Centers Big Data/ Devise Strategy Power BI

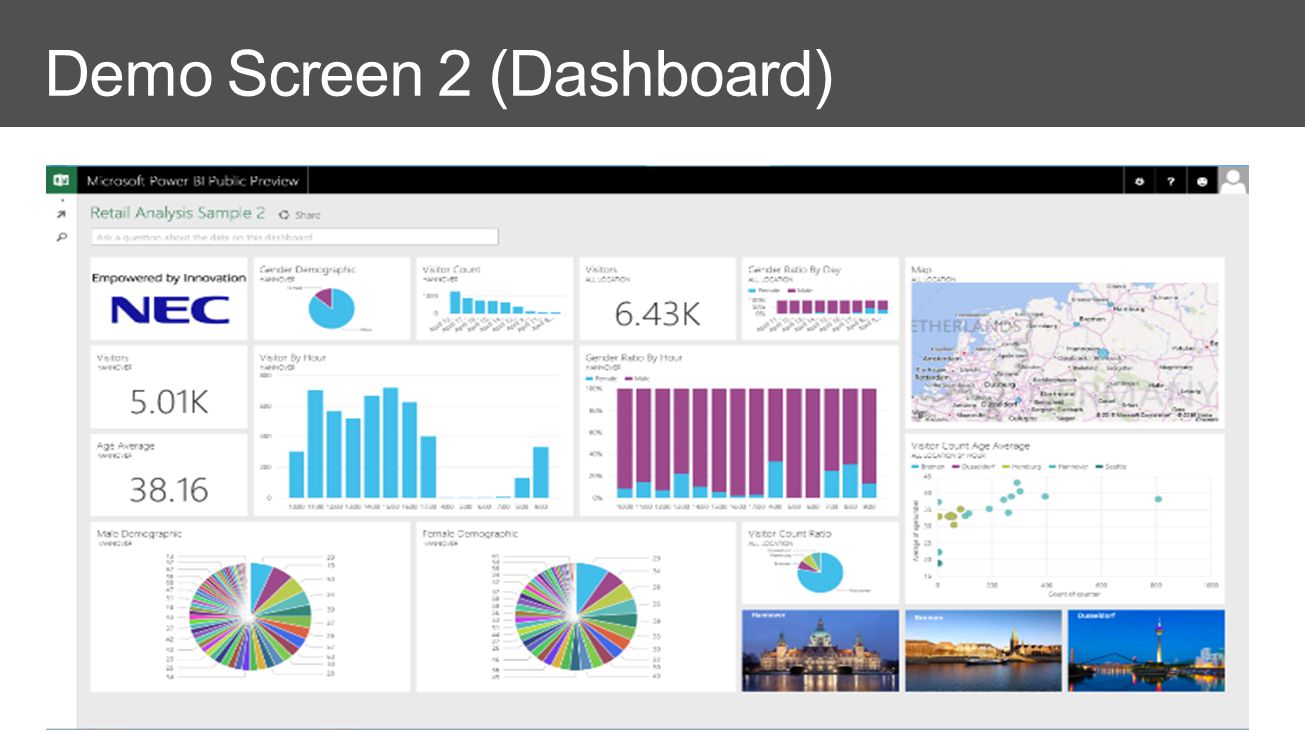
9
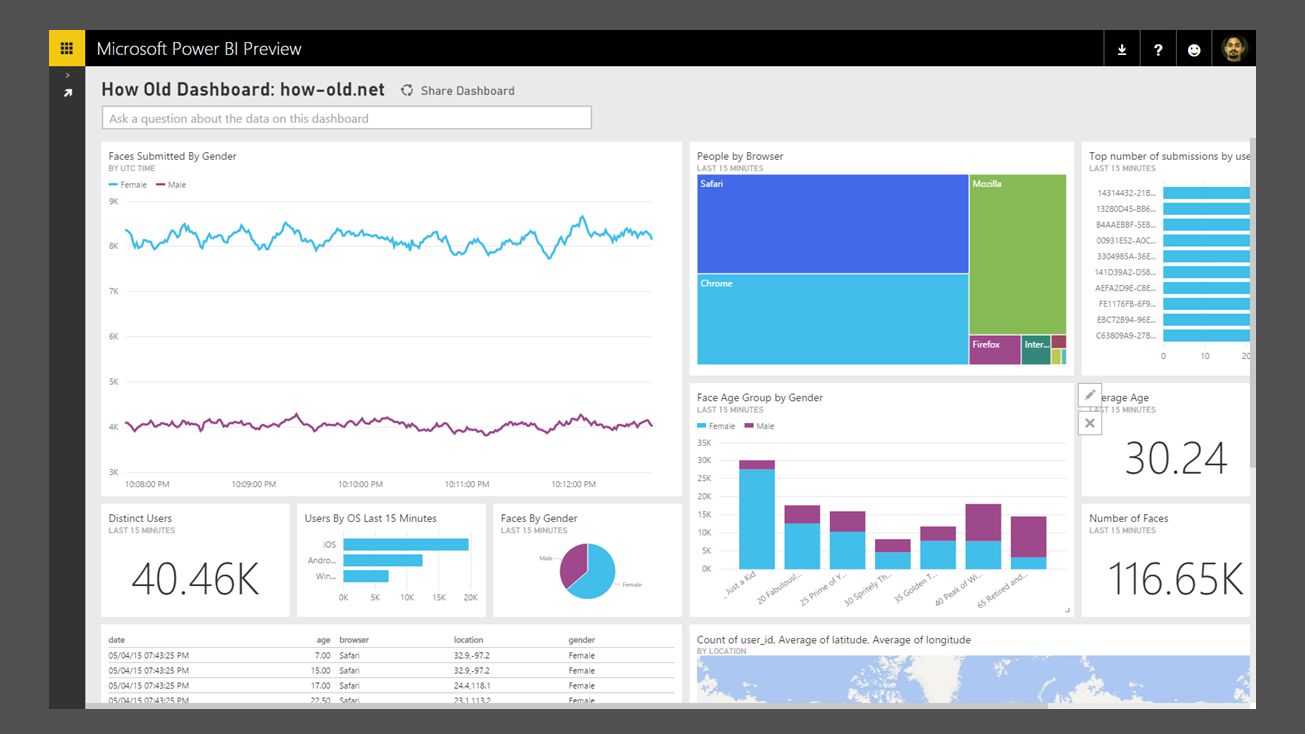
NEC FieldAnalyst (People count / Age / Gender) data to Azure in real-time
 data to Azure in real-time")
11
Solutions Audience Measurement User Behavior Displays & Digital Signage Interactivity, NUI POS, Kiosk, Devices CRM ERP Business Intelligence & Analytics Traffic Measurement Customer RecognitionBehavior Analysis In-Store Outside of Store Omni-ChannelDigital SignageInteractivity

12
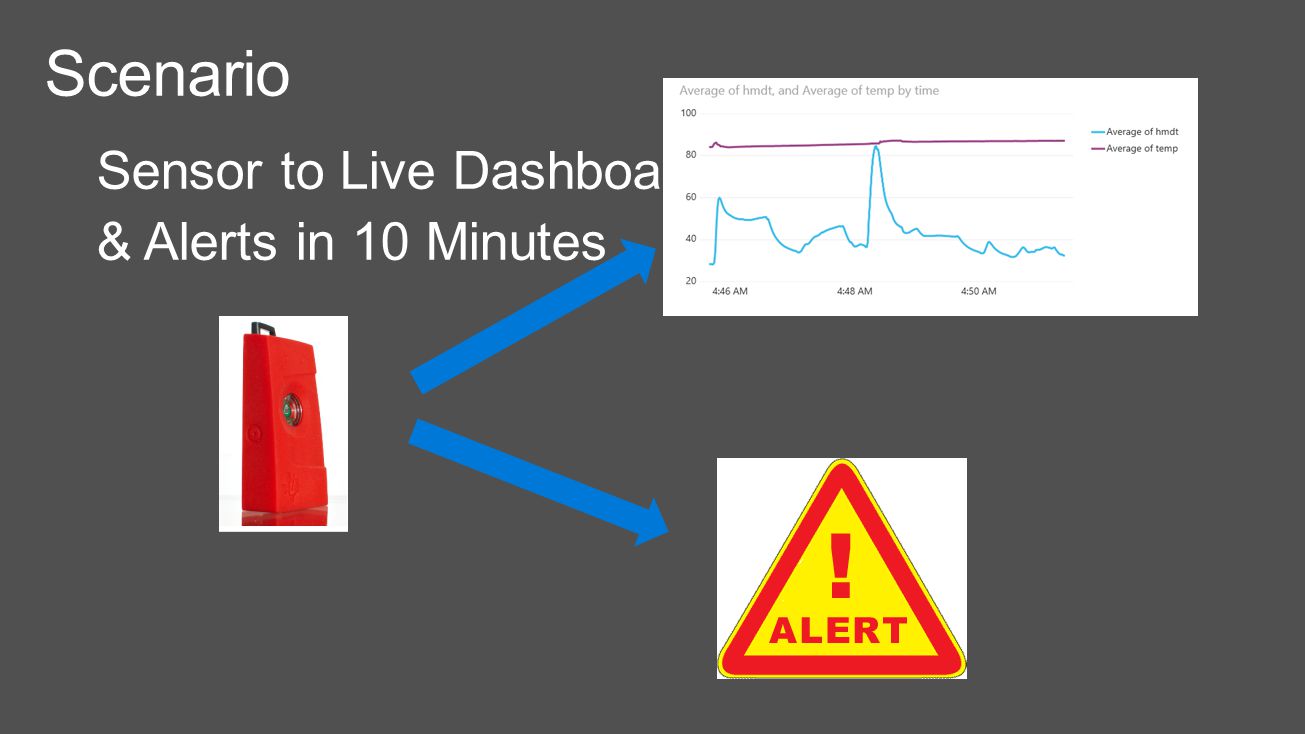
Stream Analytics Producing High Quality Lettuce based on Real time insights Multiple Sensor Data from the Lettuce factory being analyzed real time to product Lettuce that is both delicious and low in potassium so that dialysis patients and people with chronic disease can consume it. Live Dashboard and Alerts Machine Learning Timely Actions based on real time dashboard and alerts Read Press Release Read Press Release Watch video Watch video

15
Infrastructure – Procure and setup Develop solution (code) for ingress, processing and egress Develop solutions to integrate with other components like ML, BI etc Develop solutions to manage resiliency, such as infrastructure failures Develop solutions and infrastructure for increasing scale with business growth Monitoring and Troubleshooting of solution From Event or Data Streams to Real Time Insights in less time with less people resources
 for ingress, processing and egress Develop solutions to integrate with other components like ML, BI etc Develop solutions to manage resiliency, such as infrastructure failures Develop solutions and infrastructure for increasing scale with business growth Monitoring and Troubleshooting of solution From Event or Data Streams to Real Time Insights in less time with less people resources")
18
Real-time Analytics Intake millions of events per second (up to 1 GB/s) Low processing latency, auto adaptive (sub-second to seconds) Correlate between different streams, or with reference data Find patterns or lack of patterns in data in real-time Fully Managed Cloud Service No hardware acquisition and maintenance No platform/infrastructure deployment and maintenance Easily expand your business globally leveraging Azure regions
 Low processing latency, auto adaptive (sub-second to seconds) Correlate between different streams, or with reference data Find patterns or lack of patterns in data in real-time Fully Managed Cloud Service No hardware acquisition and maintenance No platform/infrastructure deployment and maintenance Easily expand your business globally leveraging Azure regions")
19
Mission Critical Reliability Guaranteed event delivery Guaranteed business continuity: Automatic and fast recovery Effective Audits Privacy and security properties of solutions are evident Azure integration for monitoring and ops alerting Easy To Scale Scale from small to large on demand

20
Rapid Development with SQL like language High-level: focus on stream analytics solution Concise: less code to maintain Fast test: Rapid development and debugging First-class support for event streams and reference data Built in temporal semantics Built-in temporal windowing and joining Built for IoT scenarios

21
Ingestor (broker) CollectionPresentation and action Event producers TransformationLong-term storage Event hubs Storage adapters Stream processing Cloud gateways (web APIs) Field gateways Applications Legacy IOT (custom protocols) Devices IP-capable devices (Windows/Linux) Low-power devices (RTOS) Search and query Data analytics (Excel) Web/thick client dashboards Service bus Azure DBs Azure storage HDInsight Stream Analytics Devices to take action PowerBI
 CollectionPresentation and action Event producers TransformationLong-term storage Event hubs Storage adapters Stream processing Cloud gateways (web APIs) Field gateways Applications Legacy IOT (custom protocols) Devices IP-capable devices (Windows/Linux) Low-power devices (RTOS) Search and query Data analytics (Excel) Web/thick client dashboards Service bus Azure DBs Azure storage HDInsight Stream Analytics Devices to take action PowerBI")
22
Ingestor (broker) CollectionPresentation and action Event producers TransformationLong-term storage Event hubs Storage adapters Stream processing Field gateways Stream Analytics PowerBI Sensor / Device Store Manager Dashboard External Source ERP Social
 CollectionPresentation and action Event producers TransformationLong-term storage Event hubs Storage adapters Stream processing Field gateways Stream Analytics PowerBI Sensor / Device Store Manager Dashboard External Source ERP Social")
28
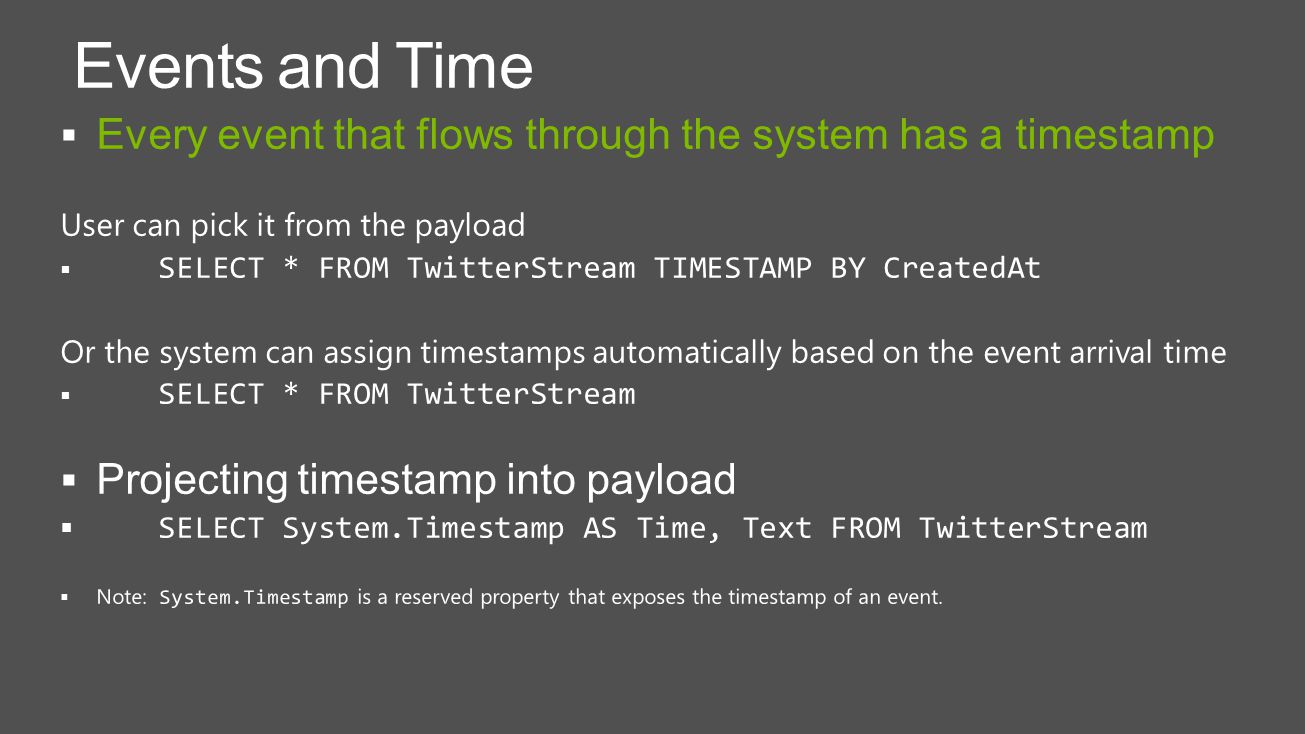
DML SELECT FROM WHERE GROUP BY HAVING CASE WHEN THEN ELSE INNER/LEFT OUTER JOIN UNION CROSS/OUTER APPLY CAST INTO ORDER BY ASC, DSC SAQL – Language & Library Scaling Extensions WITH PARTITION BY OVER Date and Time Functions DateName DatePart Day Month Year DateTimeFromParts DateDiff DateAdd Windowing Extensions TumblingWindow HoppingWindow SlidingWindow Aggregate Functions Sum Count Avg Min Max StDev StDevP Var VarP String Functions Len Concat CharIndex Substring PatIndex Temporal Functions Lag, IsFirst CollectTop

29
IDCreatedAt UserNam e TimeZoneText Languag e Topic Sentiment Score 1 2015-4- 30T12:23:07 Bosc1 Mountain Time (US & Canada) Microsoft Hololens is a very cool device enMicrosoft4 2 2015-4- 30T12:25:01 ToddLaneHawaiiWhen its football I say Go Hawks…enfootball4 … “A news media website wants to increase site traffic by covering trending topics on social media.” To determine which topics are immediately relevant to customers, they need real-time analytics about the tweet volume and sentiment for each topic. TwitterStream

30
Filters SELECT UserName, SentimentScore FROM TwitterStream WHERE Topic = ‘Azure’ Show me the user name and sentiment score of tweets on the topic Ebola "Haroon”, 2 "XO", 4 “Zach Dotseth“, 4, “Xbox”,(…) "Haroon”, 2, “Azure”,(…) "XO", 4, “Azure“, (…)
 Haroon , 2, Azure ,(…) XO , 4, Azure , (…)")
32
SELECT TimeZone, COUNT(*) AS Count FROM TwitterStream TIMESTAMP BY CreatedAt GROUP BY TimeZone, TumblingWindow(second,10) Tell me the count of tweets per time zone every 10 seconds 1542686 5 Time (secs) 15426 86 A 10-second Tumbling Window 361 5361
 AS Count FROM TwitterStream TIMESTAMP BY CreatedAt GROUP BY TimeZone, TumblingWindow(second,10) Tell me the count of tweets per time zone every 10 seconds Time (secs) A 10-second Tumbling Window")
33
SELECT Topic, COUNT(*) AS TotalTweets, AVG(SentimentScore) FROM TwitterStream TIMESTAMP BY CreatedAt GROUP BY Topic, HoppingWindow(second, 10, 5) Every 5 seconds give me the count of tweets and the average sentiment score over the last 10 seconds 1542687 A 10-second Hopping Window with a 5-second “Hop” 426 86 5361 15 426 8653 61 53
 AS TotalTweets, AVG(SentimentScore) FROM TwitterStream TIMESTAMP BY CreatedAt GROUP BY Topic, HoppingWindow(second, 10, 5) Every 5 seconds give me the count of tweets and the average sentiment score over the last 10 seconds A 10-second Hopping Window with a 5-second Hop")
34
SELECT Topic, COUNT(*) FROM TwitterStream TIMESTAMP BY CreatedAt GROUP BY Topic, SlidingWindow(second, 10) HAVING COUNT(*) > 10 Give me the count of tweets for all topics which are tweeted more than 10 times in the last 10 seconds 15 A 10-second Sliding Window 8 8 51 9 5 1 9 1
 FROM TwitterStream TIMESTAMP BY CreatedAt GROUP BY Topic, SlidingWindow(second, 10) HAVING COUNT(*) > 10 Give me the count of tweets for all topics which are tweeted more than 10 times in the last 10 seconds 15 A 10-second Sliding Window")
35
{“XO”, 4, “Ebola”}{“Jo”, 0, “ALS”} {“Foo”,4, “ALS”} {“Dip”, 2, “XBox”} {“XO”, 0, “Ebola”} {“Dip”, 0, “Xbox”} {“Jo”, 4, “ALS”} {“Foo”, 0, “ALS”} Twitter Stream: SELECT TS1.UserName, TS1.Topic FROM TwitterStream TS1 TIMESTAMP BY CreatedAt JOIN TwitterStream TS2 TIMESTAMP BY CreatedAt ON TS1.UserName = TS2.UserName AND TS1.Topic = TS2.Topic AND DATEDIFF(second, TS1, TS2) BETWEEN 1 AND 60 WHERE TS1.SentimentScore != TS2.SentimentScore List all users and the topics on which they switched their sentiment within a minute
 BETWEEN 1 AND 60 WHERE TS1.SentimentScore != TS2.SentimentScore List all users and the topics on which they switched their sentiment within a minute")
36
Reference Data

37
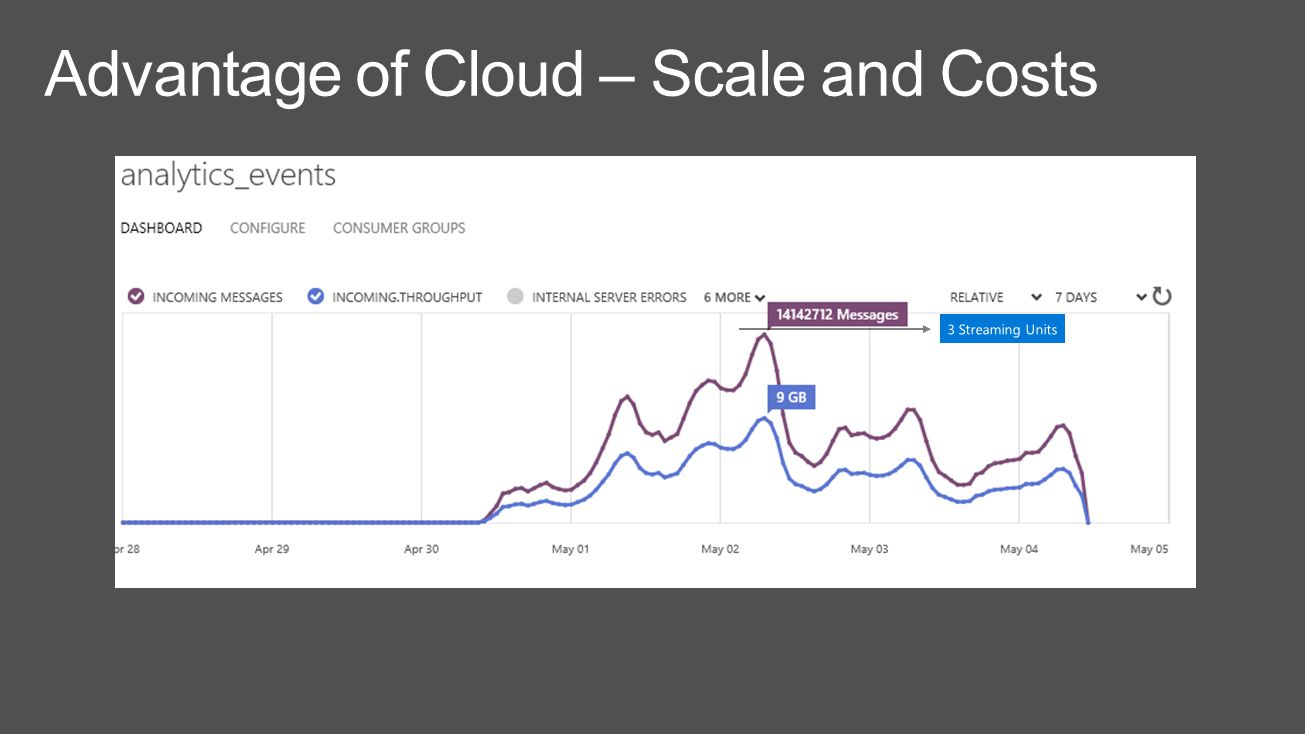
Stream Analytics is priced on two variables: Volume of data processed Streaming units required to process the data stream MeterPrice (USD) Volume of Data Processed Volume of data processed by the streaming job (in GB) $.001 per GB Streaming Unit Blended measure of cores, memory, and bandwidth $0.031 per hour * Streaming unit is a unit of compute capacity with a maximum throughput of 1MB/s
 Volume of Data Processed Volume of data processed by the streaming job (in GB) $.001 per GB Streaming Unit Blended measure of cores, memory, and bandwidth $0.031 per hour * Streaming unit is a unit of compute capacity with a maximum throughput of 1MB/s")
38
Daily Azure Stream Analytics cost for 1 MB/sec of average processing Volume of Data Processed Cost - $0.001 /GB * 84.375 GB = $0.08 per day, streaming max 1 MB/s non-stop Streaming Unit Cost - $.031 /hr * 24 hrs = $0.74 per day, for 1 MB/sec max. throughput Total cost - $0.74 + $0.08 = $0.82 per day -or- ~ $25 per month

39
Machine Learning Azure ML and Stream Analytics are now integrated The integration is in limited preview as of today! Azure ML can publish web endpoints for operationalized models Azure Stream Analytics can bind custom function names to such web endpoints Example: apply bound function event-by-event sentiment mapped to endpoint/API key SELECT text, sentiment(text) FROM myStream
 FROM myStream.")
43
Ingestor (broker) CollectionPresentation and action Event producers TransformationLong-term storage Event hubs Stream processing Gateways (web APIs) Live Dashboard – PowerBI Alert – Client Application Service Bus Azure DBs PowerBI Stream Analytics Alert – SSMS in SQL
 CollectionPresentation and action Event producers TransformationLong-term storage Event hubs Stream processing Gateways (web APIs) Live Dashboard – PowerBI Alert – Client Application Service Bus Azure DBs PowerBI Stream Analytics Alert – SSMS in SQL")
45
Business Overviewhttp://azure.microsoft.com/en-us/services/stream-analytics/http://azure.microsoft.com/en-us/services/stream-analytics/ Documentationhttp://azure.microsoft.com/en- us/documentation/services/stream-analytics/http://azure.microsoft.com/en- us/documentation/services/stream-analytics/ ASA Bloghttp://blogs.msdn.com/b/streamanalytics/rss.aspxhttp://blogs.msdn.com/b/streamanalytics/rss.aspx Follow us on Twitterhttps://twitter.com/AzureStreaming (follow @AzureStreaming)https://twitter.com/AzureStreaming@AzureStreaming ASA Forumhttps://social.msdn.microsoft.com/Forums/en- US/home?forum=AzureStreamAnalyticshttps://social.msdn.microsoft.com/Forums/en- US/home?forum=AzureStreamAnalytics Vote for ideashttp://feedback.azure.com/forums/270577-azure-stream-analyticshttp://feedback.azure.com/forums/270577-azure-stream-analytics Email ASA Teamazstream@microsoft.comazstream@microsoft.com

Similar presentations


 for ingress, processing and egress Develop.>")


: Technical Level: 200 Intended Audience: Developers Objectives (what do.>")


