Download presentation
Presentation is loading. Please wait.

1
Interactive Data Visualization for Rapid Understanding of Scientific Literature Cody Dunne Dept. of Computer Science and Human-Computer Interaction Lab, University of Maryland cdunne@cs.umd.edu STM Annual Spring Conference 2011 April 26-28, 2010 Washington, DC Links from this talk: http://bit.ly/stmase

2
nochamo.com

3
Roadmap Network Analysis 101 Action Science Explorer (ASE) Getting Started with Visualization
 Getting Started with Visualization")
4
Central tenet – Social structure emerges from the aggregate of relationships (ties) Phenomena of interest – Emergence of cliques and clusters – Centrality (core), periphery (isolates) Source: Richards, W. (1986). The NEGOPY network analysis program. Burnaby, BC: Department of Communication, Simon Fraser University. pp.7-16 Network Theory
. The NEGOPY network analysis program. Burnaby, BC: Department of Communication, Simon Fraser University. pp.7-16 Network Theory.")
5
Terminology Node –“actor” on which relationships act; 1-mode versus 2-mode networks Edge –Relationship connecting nodes; can be directional Cohesive Sub-Group –Well-connected group; clique; cluster; community Key Metrics –Centrality (group or individual measure) Number of direct connections that individuals have with others in the group (usually look at incoming connections only) Measure at the individual node or group level –Cohesion (group measure) Ease with which a network can connect Aggregate measure of shortest path between each node pair at network level reflects average distance –Density (group measure) Robustness of the network Number of connections that exist in the group out of 100% possible –Betweenness (individual measure) # shortest paths between each node pair that a node is on Measure at the individual node level Node roles –Peripheral – below average centrality –Central connector – above average centrality –Broker – above average betweenness E D F A C B H G I C D E ABCDE?
 Number of direct connections that individuals have with others in the group (usually look at incoming connections only) Measure at the individual node or group level –Cohesion (group measure) Ease with which a network can connect Aggregate measure of shortest path between each node pair at network level reflects average distance –Density (group measure) Robustness of the network Number of connections that exist in the group out of 100% possible –Betweenness (individual measure) # shortest paths between each node pair that a node is on Measure at the individual node level Node roles –Peripheral – below average centrality –Central connector – above average centrality –Broker – above average betweenness E D F A C B H G I C D E ABCDE")
6
Action Science Explorer

7
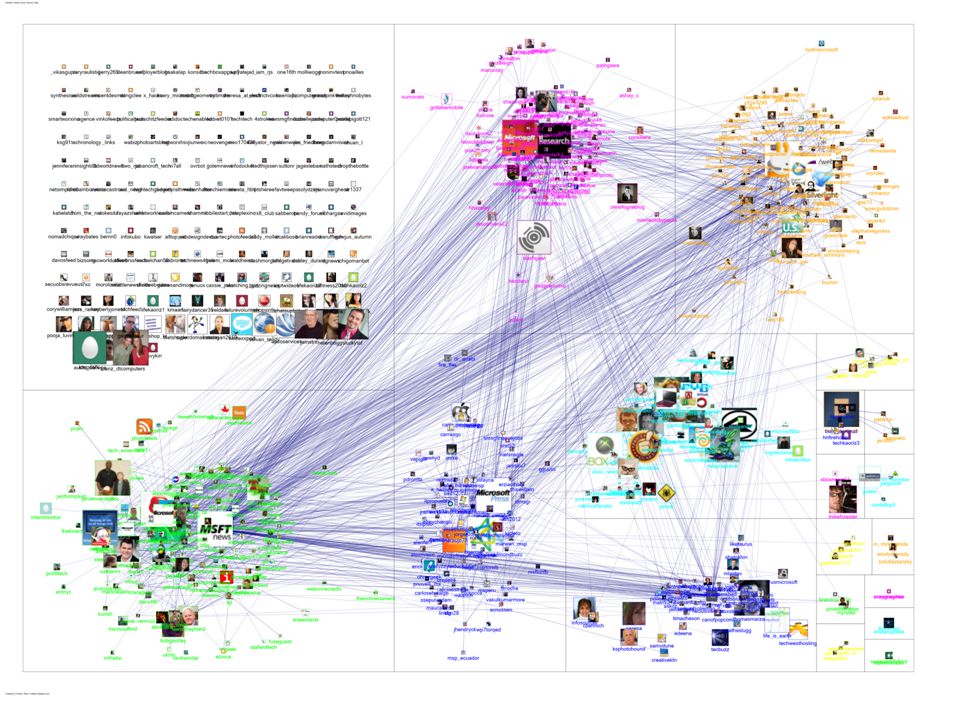
NodeXL FOSS Social Network Analysis add-in for Excel 2007/2010

9
World Wide Web

10
Now Available

11
Open Tools, Open Data, Open Scholarship

13
Treemaps can find papers & patents missed by searches

14
Rocha, L.M.; Simas, T.; Rechtsteiner, A.; Di Giacomo, M.; Luce, R.;, "MyLibrary at LANL: proximity and semi-metric networks for a collaborative and recommender Web service," Web Intelligence, 2005. Proceedings. The 2005 IEEE/WIC/ACM International Conference on, vol., no., pp. 565- 571, 19-22 Sept. 2005. doi: 10.1109/WI.2005.106

15
McKechnie, E.F., Goodall, G.R., Lajoie-Paquette, D. and Julien, H. (2005). "How human information behaviour researchers use each other's work: a basic citation analysis study." Information Research, 10(2) paper 220 [Available at http://InformationR.net/ir/10-2/paper220.html]
. How human information behaviour researchers use each other s work: a basic citation analysis study. Information Research, 10(2) paper 220 [Available at")
17
Overview Network Analysis 101 Action Science Explorer (ASE) Getting Started with Visualization
 Getting Started with Visualization")
18
Interactive Data Visualization for Rapid Understanding of Scientific Literature Cody Dunne Dept. of Computer Science and Human-Computer Interaction Lab, University of Maryland cdunne@cs.umd.edu This work has been partially supported by NSF grant "iOPENER: A Flexible Framework to Support Rapid Learning in Unfamiliar Research Domains", jointly awarded to UMD and UMich as IIS 0705832. Links from this talk: http://bit.ly/stmase

Similar presentations


 Observes that Internet graphs can be described by “power.>")


 Sponsored by:>")
 >")

