Download presentation
Presentation is loading. Please wait.

1
MSmcDESPOT: Follow-Ups November 1, 2010

2
Where We Are Baseline cross-section conclusions: – DVF is sensitive to early stages of MS where other measures are not – DVF correlates with EDSS (R^2 = 0.37 in NAWM) – The addition of a quantitative measure significantly improves EDSS prediction compared to volumetric atrophy measures alone 1yr follow-up scans – 23/26 patients scanned – 5/26 normals scanned and more incoming
 – The addition of a quantitative measure significantly improves EDSS prediction compared to volumetric atrophy measures alone 1yr follow-up scans – 23/26 patients scanned – 5/26 normals scanned and more incoming")
3
Patient Overview

8
Correlation Plots

10
Discussion Our correlations for DV and DVF were consistent between the baseline and follow up Change in DV has a large scale – Could mean we’re quite sensitive to changes in the brain – Need to quantify how much DV varies due to repeatability error DV increased for almost every patient, only P020 had a drop (not shown because no EDSS data) Currently, we unexpectedly observe a negative correlation between change in EDSS and change in DV
 Currently, we unexpectedly observe a negative correlation between change in EDSS and change in DV")
11
Normals N004, N008, N012 First glimpse at the repeatability of the DV measure and mcDESPOT-derived MWF maps We would like to see little change between the baseline and follow up MWF maps Mean MWF BaselineStd. Dev.Mean MWF 1yrStd. Dev. N0040.1030.09550.09520.0896 N0080.1250.09820.09210.0882 N0120.09390.09350.08340.0877

12
Correlations

15
Histograms

18
DV Baseline DV (mm^3) 1yr DV (mm^3) N0041653072 N00801636 N0124671158 P02212171802 Using the old baseline mean and std. dev. MWF maps, computed DV for the new normal scans Disconcertingly large increase in DV Why? – Biased using the baseline mean derived from normals to get their baseline DV – Follow-up scan quality?

19
Baseline SPGR_fa13 Images

20
1yr SPGR_fa13 Images

21
Discussion I would argue that the reduction in quality in the follow-up scans is comparable between the normals and P022 Are there ways to deal with the bias? – Cross-validation Try many random subsets of the normal population to generate mean and std. dev., choose the map pair that minimizes total DV among all normals – Ensemble methods Use all the map pairs and for each, generate a DV mask, then a voxel is considered demyelinated only if a majority of the DV masks have it as demyelinated

22
MSmcDESPOT: Looking at Maps October 29, 2010

23
Motivation Thus far we’ve been studying DV and DVF, which collapses all of our data into a single metric for each patient One of the key advantages of mcDESPOT is that it acquires whole brain maps We should start looking at our data as whole brain maps – Perhaps different subtypes of MS are associated with different spatial distributions of MWF

24
Baseline: Mean MWF Normals

25
Baseline: Mean MWF CIS

26
Baseline: Mean MWF RRMS

27
Baseline: Mean MWF SPMS

28
Baseline: Mean MWF PPMS

29
Discussion There’s clearly a drop in overall MWF as we progress from CIS to RR to SP to PP Can’t really discern any favoring for locations of low MWF other than around the ventricles – DV maps would probably show this better than anything, should generate a probabilistic DV map

30
Baseline: Std. Dev. MWF Normals

31
Baseline: Std. Dev. MWF CIS

32
Baseline: Std. Dev. MWF RRMS

33
Baseline: Std. Dev. MWF SPMS

34
Baseline: Std. Dev. MWF PPMS

35
Discussion In normals, MWF has a much lower standard deviation in WM areas RR patients seem to have an overall lower standard deviation than CIS – One interpretation might be that CIS patients are only starting to lose myelin so there is a lot of variability among them PP is by far the worst, the variance of MWF among the subjects seems to be the same throughout the brain – This means that the amount and location of myelin lost among PP patients varies wildly Of course standard deviation is a group based measure, not sure about the direct clinical application for one patient The 1yr cross-section maps looks like the baseline

36
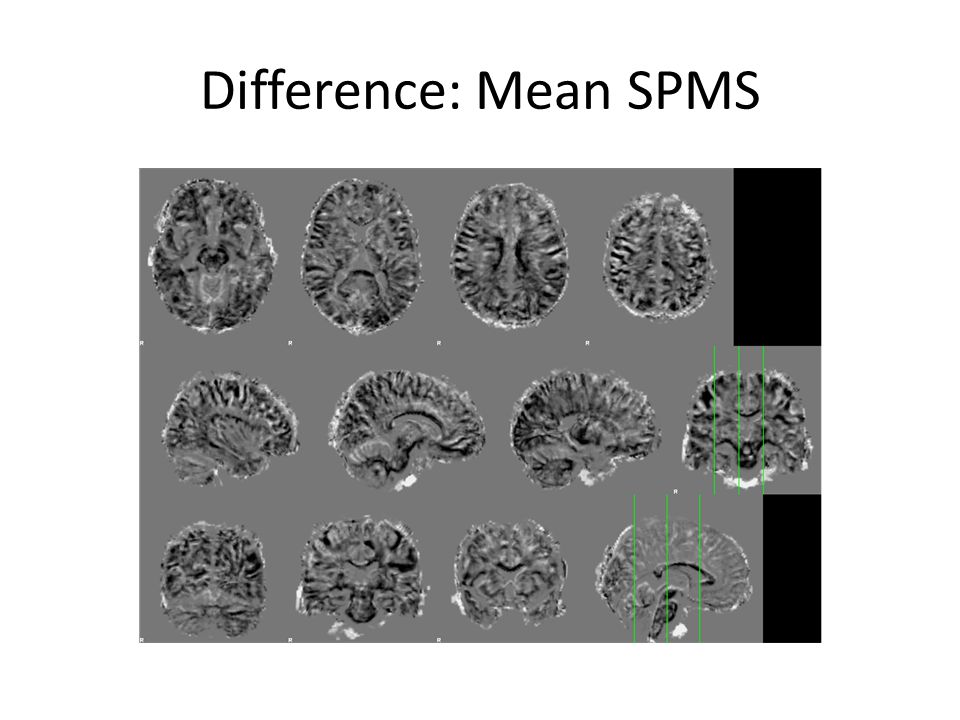
Difference Maps For each subject, the difference map was computed as MWF_1yr – MWF_baseline – Then the mean difference between patients was computed for each subtype as well as the standard deviation of the differences The following maps may be hard to look at, they are highly non-traditional and probably it’s the first time anyone has ever seen such images

37
Difference: Mean CIS

38
Difference: Mean RRMS

39
Difference: Mean SPMS

41
Discussion There is a clear different between CIS and RR, with RR patients having much larger drops in MWF Actually, I feel like RR patients have the most actively changing MWF among all the subtypes looking at these images – Consistent with early stages being the most active? Have to check the ages of our RR patients.

42
Ratio Maps For each subject, the ratio map was computed as MWF_1yr/MWF_baseline – Then the mean ratio between patients was computed for each subtype as well as the standard deviation of the ratios These maps are ugly, it is tough to tell what’s going on – Ignore the white fringing around the brain, caused by regions of low MWF – Inside the brain, they would indicate places where lesions with low MWF are Maybe even they show lesions that have remyelinated a little as (not as small MWF)/(really small MWF) = big number
/(really small MWF) = big number")
43
Ratio: Mean CIS

44
Ratio: Mean RRMS

45
Ratio: Mean SPMS

46
Ratio: Mean PPMS

47
Discussion Hard to decipher these – CIS seems the most uniform, so the percent change in MWF is perhaps low, which may not be clear based on just the mean difference maps

48
Thoughts This is more data than someone can humanly process, need to identify key regions Unsupervised exploratory data mining techniques could be worth pursuing, since our outcomes of EDSS and ΔEDSS are problematic – Goal here is to find patterns in the data rather than trying to predict an outcome

Similar presentations


 is a chronic neurological disease involving demyelination of the nervous system. There are three key MS sub-types:>")


: Outliers Fall, 2008.>")


