Download presentation
Presentation is loading. Please wait.

1
Association Predicting One Variable from Another

2
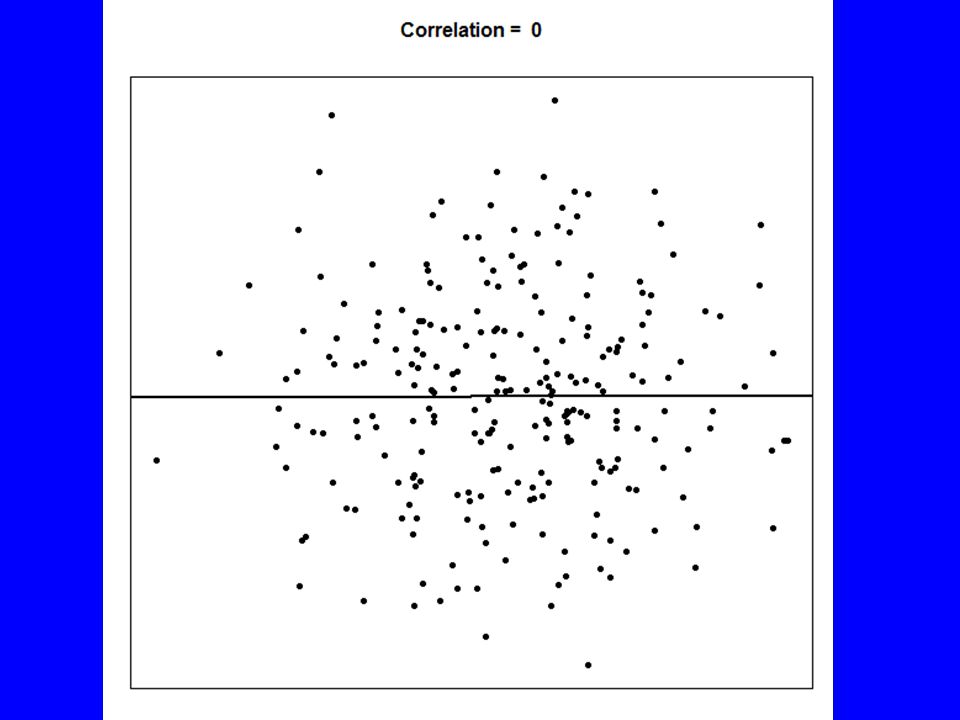
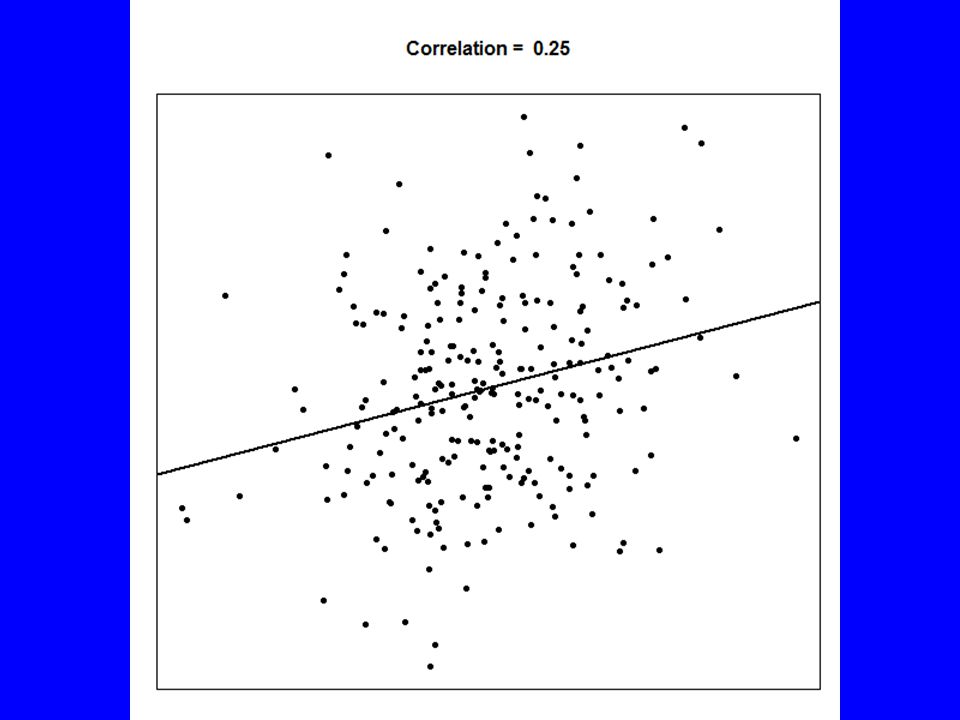
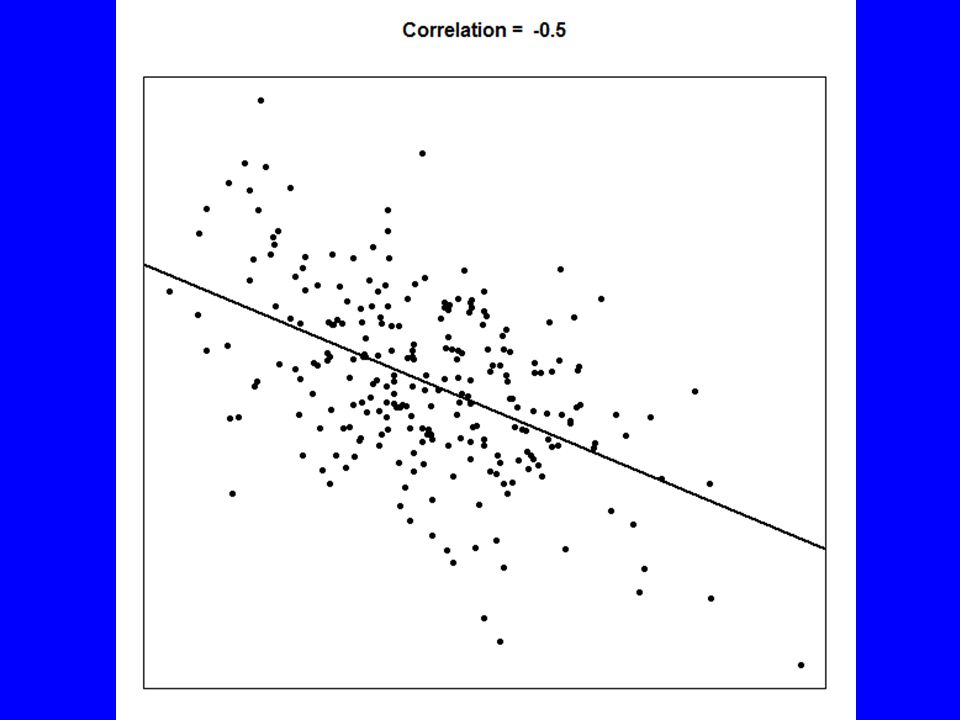
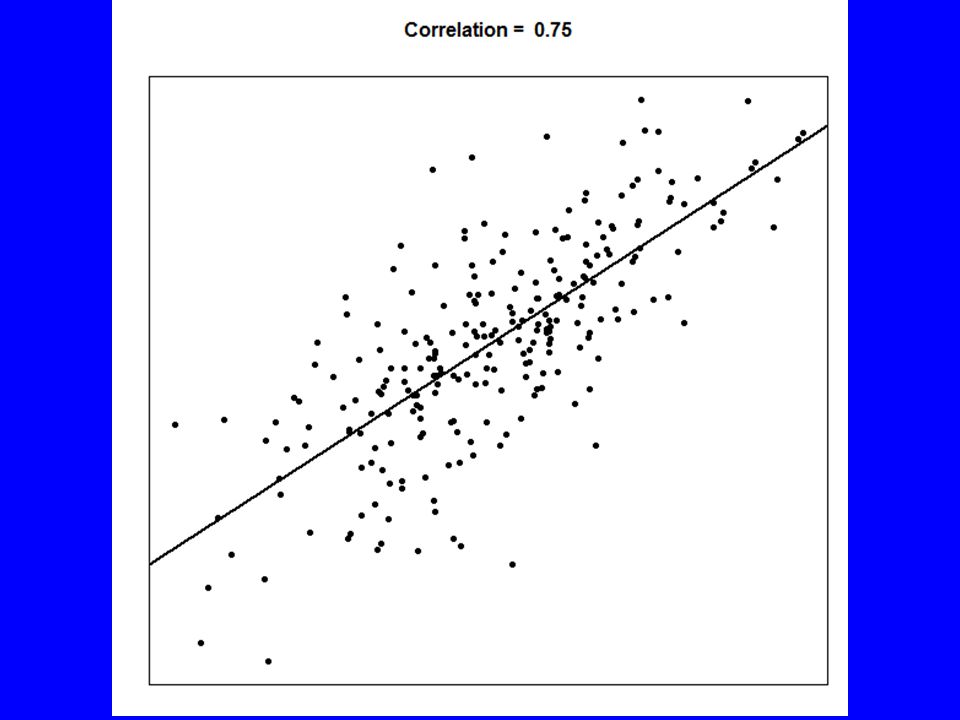
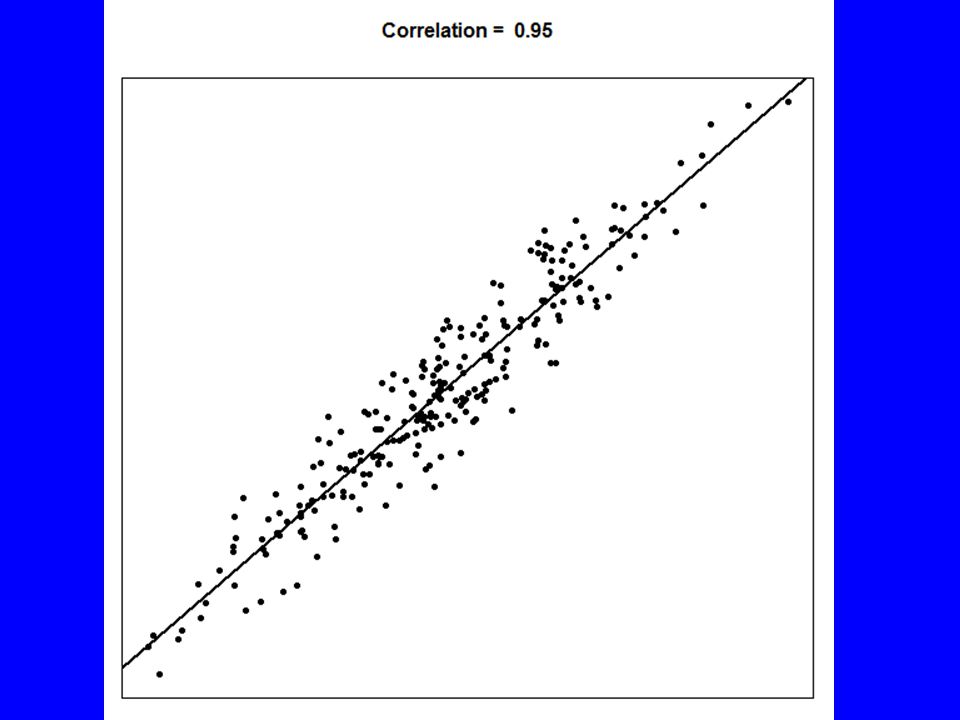
Correlation Usually refers to Pearson’s r computed on two interval/ratio scale variables. It measures the degree to which variance in one variable is “explained” by a second variable It measures the strength of a linear relationship between the variables

3
Definition of r

4
Properties of r r is symmetrical and varies from -1 to +1 0 indicates no correlation or relationship ±1 indicates a perfect correlation (knowledge of one variable makes it possible to predict the second one without any error).
.")
5
Properties of r 2 r 2 is symmetrical and varies from 0 to 1 r 2 is the proportion of the variability in one variable that is “explained by” the other variable cor.test(x, y, method=“pearson”) cor(x, y, method=“pearson”)
 cor(x, y, method= pearson )")
12
Spearman’s rho For rank/ordinal data. Pearson correlation computed on ranks If Spearman coefficient is larger than Pearson, it may indicate a non- linear relationship Ties make it difficult to compute p values

13
Kendall’s tau For rank/ordinal data Evaluate pairs of observations (x i, y i ) and (x j, y j ) Concordant – (x i > x j ) and (y i > y j ) OR (x i < x j ) and (y i < y j ) Discordant – (x i > x j ) and (y i y j )
 and (x j, y j ) Concordant – (x i > x j ) and (y i > y j ) OR (x i < x j ) and (y i < y j ) Discordant – (x i > x j ) and (y i y j )")
14
Kendall’s tau-a

15
Kendall’s tau b Divide by total number of pairs adjusted for all ties

16
Kendall’s tau c For grouped (tabled data) where the table is not square (rows ≠ columns)
 where the table is not square (rows ≠ columns)")
17
Nominal Measures Measures based on Chi-Square: –Phi coefficient –Cramer’s V –Contingency coefficient –Odds ratio

18
Phi and Cramer’s V Phi ranges from 0 to 1 in a 2x2 table but can exceed 1 in larger tables. Cramer’s V adds a correction to keep the maximum value at 1 or less:

19
Contingency Coefficient Ranges from 0 to <1 depending on the number of rows and columns with 1 indicating a high relationship and 0 indicating no relationship

20
Odds Ratio For 2 x 2 tables it shows the relative odds between the two variables ab cd

21
> Table <- xtabs(~Sex+Goods, data=EWG2) > Table Goods Sex Absent Present Female 38 28 Male 16 30 > ChiSq <- chisq.test(Table) > ChiSq Pearson's Chi-squared test with Yates' continuity correction data: Table X-squared = 4.7644, df = 1, p-value = 0.02905
 > Table Goods Sex Absent Present Female Male > ChiSq <- chisq.test(Table) > ChiSq Pearson s Chi-squared test with Yates continuity correction data: Table X-squared = , df = 1, p-value =")
22
library(vcd) > assocstats(Table) X^2 df P(> X^2) Likelihood Ratio 5.7073 1 0.016894 Pearson 5.6404 1 0.017552 Phi-Coefficient : 0.224 Contingency Coeff.: 0.219 Cramer's V : 0.224 > cor(as.numeric(EWG2$Sex), as.numeric(EWG2$Goods), use="complete.obs") [1] 0.2244111 > oddsratio(Table, log=FALSE) [1] 2.544643
![library(vcd) > assocstats(Table) X^2 df P(> X^2) Likelihood Ratio Pearson Phi-Coefficient : Contingency Coeff.: Cramer s V : > cor(as.numeric(EWG2$Sex), as.numeric(EWG2$Goods), use= complete.obs ) [1] > oddsratio(Table, log=FALSE) [1]](http://images.slideplayer.com/15/4859705/slides/slide_22.jpg "library(vcd) > assocstats(Table) X^2 df P(> X^2) Likelihood Ratio Pearson Phi-Coefficient : Contingency Coeff.: Cramer s V : > cor(as.numeric(EWG2$Sex), as.numeric(EWG2$Goods), use= complete.obs ) [1] > oddsratio(Table, log=FALSE) [1]")
Similar presentations

>")


 –Difference of proportions –Ratios of proportions –the odds ratio Measures.>")


