Download presentation
Presentation is loading. Please wait.

1
Next Generation Sequencing Platforms
Sequencing by synthesis (SBS) 454/Pyrosequencing Illumina/Solexa Helicos Pacbio (Charge-based detection system, Now-sequencing) Sequencing by hybridization SOLiD
 454/Pyrosequencing. Illumina/Solexa. Helicos. Pacbio. (Charge-based detection system, Now-sequencing) Sequencing by hybridization. SOLiD.")
2
Pyrosequencing: Sequencing-By-Synthesis

4
UCSC Sequencing Center
454 Sequencing System Chemistry & Platform Sequencing-by-synthesis Library Preparation Emulsion Based Clonal Amplification SOLiD Bioanalyzer Chemistry & Platform Library Construction Emulsion PCR Applications Fragment Sequencing Transcriptome Studies Paired-End Sequencing Targeted sequencing Small RNA CSB2008 August 2008 UCSC Sequencing Center

5
Overview of The 454 Sequencing System
1) Prepare Adapter Ligated ssDNA Library (A-[insert]-B) 2) EmPCR: Clonal Amplification on 28 µ beads followed by enrichment 3) Load beads and enzymes in PicoTiter Plate™ 4) Perform sequencing-by-synthesis on the 454 Sequencer CSB2008 August 2008 UCSC Sequencing Center
 Prepare Adapter Ligated ssDNA Library (A-[insert]-B) 2) EmPCR: Clonal Amplification on 28 µ beads followed by enrichment. 3) Load beads and enzymes. in PicoTiter Plate™ 4) Perform sequencing-by-synthesis. on the 454 Sequencer. CSB2008 August UCSC Sequencing Center.")
6
Emulsion Based Clonal Amplification
+ PCR Reagents + Emulsion Oil B Micro-reactors Adapter carrying library DNA Mix DNA Library & capture beads (limited dilution) Create “Water-in-oil” emulsion “Break micro-reactors” Isolate DNA containing beads Perform emulsion PCR Generation of millions of clonally amplified sequencing templates on each bead No cloning and colony picking CSB2008 August 2008 UCSC Sequencing Center
 Create. Water-in-oil emulsion. Break micro-reactors Isolate DNA containing beads. Perform emulsion PCR. Generation of millions of clonally amplified sequencing templates on each bead. No cloning and colony picking. CSB2008 August UCSC Sequencing Center.")
7
Depositing DNA Beads into the PicoTiter™Plate
Load Enzyme Beads Load beads into PicoTiter™Plate Centrifuge Step 44 μm CSB2008 August 2008 UCSC Sequencing Center

8
Sequencing-By-Synthesis
Simultaneous sequencing of the entire genome in hundreds of thousands of picoliter-size wells Pyrophosphate signal generation DNA Capture Bead Containing Millions of Copies of a Single Clonal Fragment A A T C G G C A T G C T A A A A G T C A T Anneal Primer Sulfurylase Luciferase PP i APS ATP luciferin Light + oxy luciferin CSB2008 August 2008 UCSC Sequencing Center

9
Sequencing Workflow Overview
Generation of small DNA fragments via nebulization Ligation of A/B-Adaptors flanking single-stranded DNA fragments Emulsification of beads and fragments in water-in-oil microreactors Sequencing and base calling Sample input: Genomic DNA, BACs, amplicons, cDNA One Fragment One Bead Clonal amplification of fragments bound to beads in microreactors One Read ,000 reads per run CSB2008 August 2008 UCSC Sequencing Center

10
Sequencing Workflow Library Preparation
Genome fragmented by nebulization sstDNA library created with adaptors A/B fragments selected using streptavidin-biotin purification Library generation: Nebulization of genomic DNA: 300 – 800 bp fragments Low molecular weight DNA is used without fragmentation and sample preparation begins with adaptor ligation. For amplicon sequencing A and B sequences are added during PCR using FusionPrimers Polishing, blunting and adaptor ligation (A and B): mixture of AA, BB and AB molecules; A adaptor is biotinylated on one strand Adding of streptavidin coated magnetic beads: Only AA and AB molecules bind (A-adaptor biotin marker) Denaturation of double strands: only single stranded fragments flanked by A and B sequences can be collected from supernatant after magnetic separation of beads. Single stranded fragments are substrate for sequencing process. 8.0 h 7.5 h 4.5 h and 10.5 h DNA library preparation and titration emPCR Sequencing CSB2008 August 2008 UCSC Sequencing Center
: mixture of AA, BB and AB molecules; A adaptor is biotinylated on one strand. Adding of streptavidin coated magnetic beads: Only AA and AB molecules bind (A-adaptor biotin marker) Denaturation of double strands: only single stranded fragments flanked by A and B sequences can be collected from supernatant after magnetic separation of beads. Single stranded fragments are substrate for sequencing process. 8.0 h. 7.5 h. 4.5 h. and 10.5 h. DNA library preparation and titration. emPCR. Sequencing. CSB2008 August UCSC Sequencing Center.")
11
Sequencing Workflow Emulsion PCR
Emulsion-based clonal amplification Anneal sstDNA to an excess of DNA Capture Beads Emulsify beads and PCR reagents in water-in-oil microreactors Clonal amplification occurs inside microreactors Break microreactors, enrich for DNA-positive beads emPCR: Anneal to an excess of DNA capture beads: Making sure that statistically only one fragment is captured in a microreactor Emulsion generation: Oil and water and PCR reagents are mixed and shaked in a tissue lyser Clonal amplification results in beads carrying ca. 106 fragments on a bead Subsequently, the emulsion is broken and enrichment using streptavidin coated magnetic beads is perfomrmed (the A-PCR primer is biotinylated), 8.0 h 7.5 h 4.5 h and 10.5 h DNA library preparation and titration emPCR Sequencing CSB2008 August 2008 UCSC Sequencing Center
, 8.0 h. 7.5 h. 4.5 h. and 10.5 h. DNA library preparation and titration. emPCR. Sequencing. CSB2008 August UCSC Sequencing Center.")
12
Sequencing Workflow Loading of PicoTiterPlate Device
Depositing DNA beads into the PicoTiterPlate device Well diameter: average of 44 µm > 400,000 reads obtained in parallel A single clonally amplified sstDNA bead is deposited per well Amplified sstDNA library beads Quality filtered bases Loading of beads on PicoTiterPlates Current protocol: Sample beads are loaded on PicoTiterPlate: Gravitation; mention size exclusion: Only one bead per well: sample bead has a diameter of around 30µ, diameter of a well: 44µ Brown packing beads are loaded on top: Centrifugation 1 Enzyme beads are loaded on top: Centrifugation 2 CSB2008 August 2008 UCSC Sequencing Center

13
Sequencing Workflow Sequencing by Synthesis
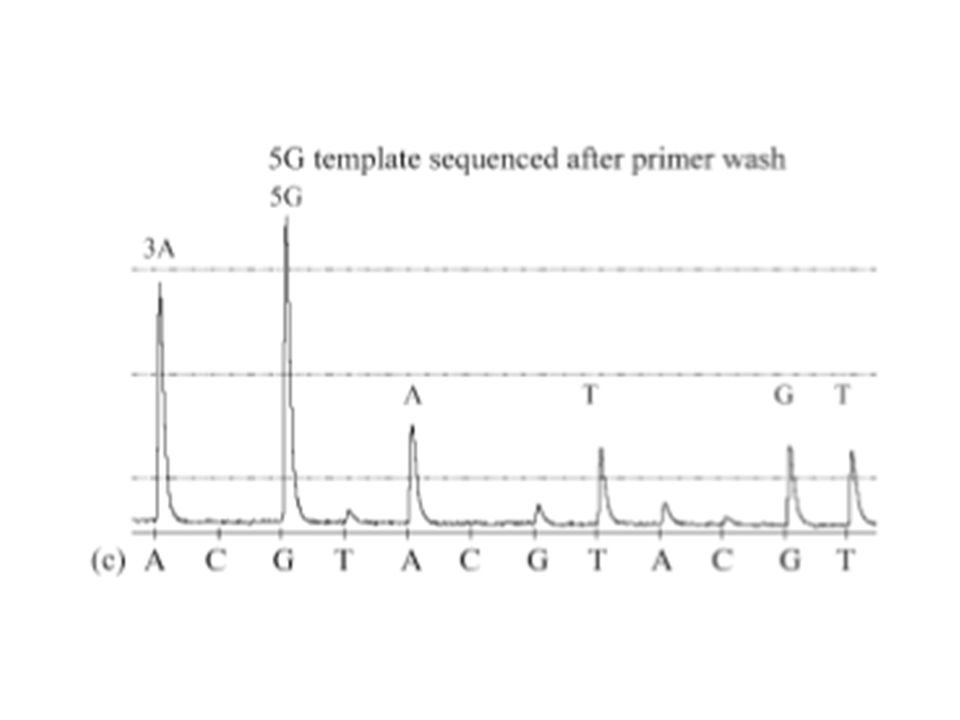
Bases (TACG) are flowed sequentially and always in the same order (100 times for a large GS FLX run) across the PicoTiterPlate device during a sequencing run. A nucleotide complementary to the template strand generates a light signal. The light signal is recorded by the CCD camera. The signal strength is proportional to the number of nucleotides incorporated. Flowgram Key sequence Nucleotides are added sequentially: When the first of the four deoxynucleosid triphosphates is flowed over the plate and if it is complementary to the template strand, DNA polymerase catalyzes the incorporation of the nucleotide into the DNA strand. Pyrophasphate is released in a quantity equimolar to the amount of incorporated nucleotide and is converted by ATP. Luciferase uses this ATP to convert luciferin to oxyluciferin and light, which is detected by a charge-coupled device (CCD) camera and recorded as a peak. Each light signal is proportional to the number of nucleotides incorporated. In parallel, apyrase continuously degrades unincorporated dNTPs and execc ATP. When the degradation is complete, the next dNTP is added. 8.0 h 7.5 h 4.5 h and 10.5 h DNA library preparation and titration emPCR Sequencing CSB2008 August 2008 UCSC Sequencing Center
 are flowed sequentially and always in the same order (100 times for a large GS FLX run) across the PicoTiterPlate device during a sequencing run. A nucleotide complementary to the template strand generates a light signal. The light signal is recorded by the CCD camera. The signal strength is proportional to the number of nucleotides incorporated. Flowgram. Key sequence. Nucleotides are added sequentially: When the first of the four deoxynucleosid triphosphates is flowed over the plate and if it is complementary to the template strand, DNA polymerase catalyzes the incorporation of the nucleotide into the DNA strand. Pyrophasphate is released in a quantity equimolar to the amount of incorporated nucleotide and is converted by ATP. Luciferase uses this ATP to convert luciferin to oxyluciferin and light, which is detected by a charge-coupled device (CCD) camera and recorded as a peak. Each light signal is proportional to the number of nucleotides incorporated. In parallel, apyrase continuously degrades unincorporated dNTPs and execc ATP. When the degradation is complete, the next dNTP is added. 8.0 h. 7.5 h. 4.5 h. and 10.5 h. DNA library preparation and titration. emPCR. Sequencing. CSB2008 August UCSC Sequencing Center.")
14
GS FLX Data Analysis Flowgram Generation
Key sequence = TCAG for signal calibration Flow Order 1-mer 2-mer 3-mer 4-mer TACG Flowgram TTCTGCGAA Background information: Keypass and normalization (signal per base & signal per flow) a) Noise to signal calculation: Noise is calculated by averaging the well signals from negative flows of the key. Signal flow pattern is checked against the known and expected key sequence pattern. If both match and signal to noise ratio exceeds a certain threshold, a signal per base value is generated for every well separately by averaging the signals of the 4 matching keys. c) Signal normalization within a well: The normalized signal per flow (per base) is calculated by dividing each flow signal by the signal per base value. d) Normalization across wells, i.e. calculation of final signal: Normalized signals (see c) from the first x T C, A and G flows of all wells are averaged. Thereafter the normalized signal from an individual flow in a well (see c) is divided by this “across well average”, thus resulting in the final normalized signal displayed in the flowgram. CSB2008 August 2008 UCSC Sequencing Center
 a) Noise to signal calculation: Noise is calculated by averaging the well signals from negative flows of the key. Signal flow pattern is checked against the known and expected key sequence pattern. If both match and signal to noise ratio exceeds a certain threshold, a signal per base value is generated for every well separately by averaging the signals of the 4 matching keys. c) Signal normalization within a well: The normalized signal per flow (per base) is calculated by dividing each flow signal by the signal per base value. d) Normalization across wells, i.e. calculation of final signal: Normalized signals (see c) from the first x T C, A and G flows of all wells are averaged. Thereafter the normalized signal from an individual flow in a well (see c) is divided by this across well average , thus resulting in the final normalized signal displayed in the flowgram. CSB2008 August UCSC Sequencing Center.")
15
GS FLX Data Analysis Overview
GS De Novo Assembler GS Reference Mapper GS Amplicon Variant Analyzer Image capture Image processing Signal processing GS Run Browser The Genome Sequencer FLX software package includes four unique software modules used for data analysis and results display: GS De Novo Assembler Software The De Novo Assembler software generates a consensus sequence of the whole DNA sample by assembly of de novo shotgun sequencing reads into contigs and subsequent ordering of these contigs into scaffolds. Contig ordering is done by generation and assembly of paired-end reads. The GS De Novo Assembler Software allows for de novo assembly of up to 120 Megabases of sequencing data. GS Reference Mapper Software The Reference Mapper software generates a consensus DNA sequence by mapping, or alignment, of the sequencing reads to a reference sequence. In addition, it generates a list of high-confidence mutations by identification of individual bases that differ between the generated consensus DNA sequence and the reference sequence. The GS Reference Mapper Software facilitates the re-sequencing of up to three Gigabases of sequencing data. GS Amplicon Variant Analyzer Software The Amplicon Variant Analyzer software compares amplicon sequencing reads to a reference sequence. Multiple alignment of several hundreds of clonal amplicon reads (ultra-deep amplicon sequencing) and comparison of these reads against a reference sequence allows for the detection of rare sequence variations even in heterogeneous specimens. GS Run Browser Software The Run Browser software is an interactive application that displays the results of a sequencing run as well as raw images and graphic representations of various metrics files. Run Browser software can be used to assess the general quality of a run, and therefore is a useful tool for troubleshooting if problems are observed. The application also facilitates evaluation of the results of titration experiments. Data generated by Run Browser software can be exported to an Excel spreadsheet. CSB2008 August 2008 UCSC Sequencing Center
 and comparison of these reads against a reference sequence allows for the detection of rare sequence variations even in heterogeneous specimens. GS Run Browser Software. The Run Browser software is an interactive application that displays the results of a sequencing run as well as raw images and graphic representations of various metrics files. Run Browser software can be used to assess the general quality of a run, and therefore is a useful tool for troubleshooting if problems are observed. The application also facilitates evaluation of the results of titration experiments. Data generated by Run Browser software can be exported to an Excel spreadsheet. CSB2008 August UCSC Sequencing Center.")
16
GS FLX System Performance Read Length
CSB2008 August 2008 UCSC Sequencing Center

17
The Genome is comprised of repeat regions
Depending upon the specific genome characteristics, microreads (~25 bp’s) cover only a portion of the genome In human – 25 base pair reads can only be mapped uniquely to 80% of the genome Short reads are limiting in known genomes – What about unknown genomes? Mapping versus de novo assemblies Mapping will miss genome rearrangements Mapping is only as good as the reference CSB2008 August 2008 UCSC Sequencing Center
 cover only a portion of the genome. In human – 25 base pair reads can only be mapped uniquely to 80% of the genome. Short reads are limiting in known genomes – What about unknown genomes Mapping versus de novo assemblies. Mapping will miss genome rearrangements. Mapping is only as good as the reference. CSB2008 August UCSC Sequencing Center.")
18
UCSC Sequencing Center
Why Does Length Matter? Longer sequencing reads mean more applications Identify and characterize small and short RNA’s Full length cDNA sequencing for expression levels and variations Amplicon resequencing for genetic variation including somatic mutations Sequencing of micro-organisms in a single instrument run Sequencing of complex genomes – mammalian & plant Sequencing of complex samples – Metagenomics, Ancient DNA CSB2008 August 2008 UCSC Sequencing Center

19
Longer sequencing reads mean more applications
HIV Studies (3) ChIP-Sequencing (8) Boyle et al, Cell: Mixed technologies for mapping open chromatin Metagenomics (12) Palacios et al, New England Journal of Medicine, Pathogenic Virus Detection Whole Genome Sequencing (30) Velasco et al, PLoS: Pinot Noir Genome Paired-End sequencing Detecting Structural Variations across two human genomes Technology and Bioinformatics (11) Meyer et al, NAR,: Using Picogram quantities of sample Transcriptome studies – cDNA (17) Small RNA (32) Amplicon and Methylation Studies (9) CSB2008 August 2008 UCSC Sequencing Center
 ChIP-Sequencing (8) Boyle et al, Cell: Mixed technologies for mapping open chromatin. Metagenomics (12) Palacios et al, New England Journal of Medicine, Pathogenic Virus Detection. Whole Genome Sequencing (30) Velasco et al, PLoS: Pinot Noir Genome. Paired-End sequencing. Detecting Structural Variations across two human genomes. Technology and Bioinformatics (11) Meyer et al, NAR,: Using Picogram quantities of sample. Transcriptome studies – cDNA (17) Small RNA (32) Amplicon and Methylation Studies (9) CSB2008 August UCSC Sequencing Center.")
20
UCSC Sequencing Center
Applications of Whole Genome, Ultra Broad and Ultra Deep HT- Sequencing HT- Sequencing Technology Applications Whole Genome Ultra Broad Ultra Deep Sequencing Sequencing Sequencing Virus Small RNA HIV Bacteria SAGE / CAGE Resistance Tropism Fungus Expression Higher Eukaryotes Transcriptome Amplicons Human Metagenomics Population Biology Novel strain ID Bacterial 16S HLA Typing CSB2008 August 2008 UCSC Sequencing Center

21
The power of Metagenomics
How to Identify an environment based upon the microbial organisms that are present Microbial Population Structures in the Deep Marine Biosphere Huber et al., Science, 318, p97, 2007 Determining the state of an environment based upon the presence and mixture of microbial organisms The interdependence of Coral and it’s microbial environment Wegley et al., Environmental Microbiology, 9, p2707, 2007 Detecting viral pathogens – quickly and accurately Less than 12 months from first identification of affected hives to possible pathogen Cox-Foster et al., Science, 2007 Transplant victims from Australia Palacios et al, New England Journal of Medicine, 2008 CSB2008 August 2008 UCSC Sequencing Center

22
Transcriptome Analysis Workflow Comparison
GS FLX (clonal sequencing ensured through emPCR) Sanger (E. coli cloning, often concatemerization) cDNA libraries (short tag library, EST library) Concatemerization, insert fragments into vectors and clone into bacteria Grow, pick colonies Template Generation Sequencing Time: Weeks emPCR Time: Days CSB2008 August 2008 UCSC Sequencing Center
 Sanger (E. coli cloning, often concatemerization) cDNA libraries. (short tag library, EST library) Concatemerization, insert fragments into vectors. and clone into bacteria. Grow, pick colonies. Template Generation. Sequencing. Time: Weeks. emPCR. Time: Days. CSB2008 August UCSC Sequencing Center.")
23
UCSC Sequencing Center
Sequencing of approximately 400,000 small RNAs from C. elegans Another 18 unknown miRNA genes were detected Thousands of endogenous siRNAs acting preferentially on transcripts associated with spermatogenesis and transposons were identified A new class of small RNAs was identified: 21U-RNAs. They all begin with an U and are precisely 21 nt long. The Genome Sequencer System is perfectly suited for the discovery of small non coding RNAs on a genome wide level Meanwhile > 15 papers dealing with the detection and characterization of sncRNAs based on GS have been published This is a typical example: The researchers have found a new sncRNA class. This occurs frequently because not much is known about these regulatory elements Advantages compared to Sanger: No cloning No bias No concatenation High throughput and low cost per clonal read allows for genome wide analysis CSB2008 August 2008 UCSC Sequencing Center

24
Multiplex Identifier Basics
What is it? Two new kits, each with 6 different library adapters (total of 12 adapters) Each MID library adapter has an added, specially encoded 10-base region Used to “bar-code” up to 12 different genomic library samples to be run in the same region of a single sequencing run Standard Library Seq. primer Read Primer A Key Library fragment Primer B #bases: MID Library Seq. primer Read Primer A Key MID 1 Library fragment Primer B #bases: Primer A Key MID 2 Library fragment Primer B Primer A Key MID n Library fragment Primer B CSB2008 August 2008 UCSC Sequencing Center
 Each MID library adapter has an added, specially encoded 10-base region. Used to bar-code up to 12 different genomic library samples to be run in the same region of a single sequencing run. Standard Library. Seq. primer. Read. Primer A. Key. Library fragment. Primer B. #bases: MID. Library. Seq. primer. Read. Primer A. Key. MID 1. Library fragment. Primer B. #bases: Primer A. Key. MID 2. Library fragment. Primer B. Primer A. Key. MID n. Library fragment. Primer B. CSB2008 August UCSC Sequencing Center.")
25
Paired-End Applications
~100 bp sequencing tags separated by 3 kb spacing Use for de novo assembly Order contigs Use for Structural Variation studies Inversions, Deletions, Insertions… High resolution detection – 3kb spacing vs 10 to 40 kb CSB2008 August 2008 UCSC Sequencing Center

26
UCSC Sequencing Center
Paired-Ends workflow CSB2008 August 2008 UCSC Sequencing Center

27
Targeted Enrichment of Human gDNA
Exon 1 Exon 2 Exon 3 Exon 4 Exon 5 Fragment and hybridize to NimbleGen capture array Elute HT-Sequencing Analyze Exon Sequences CSB2008 August 2008 UCSC Sequencing Center

28
Sequencing all the known exons from the human genome
“Direct selection of human genomic loci by microarray hybridization,” Albert et al., Nature Methods, (4) 11, , 2007 ~6,700 gDNA loci selected BRCA1 region 2 MB Region CSB2008 August 2008 UCSC Sequencing Center
 11, , ~6,700 gDNA loci selected. BRCA1 region. 2 MB Region. CSB2008 August UCSC Sequencing Center.")
29
Another Sequence-Capture Example
19 Kb region from Chromosome 4 Targeted Exons Seq-Cap Array Probes GS FLX Seq Reads Sequencing Coverage CSB2008 August 2008 UCSC Sequencing Center

30
SOLiD Library Preparation
The SOLiD system uses either a fragment library or a mate-paired library depending on the user’s desired information or application. CSB2008 August 2008 UCSC Sequencing Center

31
Emulsion PCR and Bead Enrichment
PCR takes place in oil in water microreactors. Post-PCR, templated beads are separated from non-templated beads, and modified at the 3’ end to allow covalent linkage to the SOLiD sequencing slide. CSB2008 August 2008 UCSC Sequencing Center

32
Bead Deposition Beads are deposited into 1,2,4, or 8 segmented chambers on a slide. CSB2008 August 2008 UCSC Sequencing Center

33
Sequencing By Ligation and Data Analysis
Primers hybridize to adaptors and a set of 4 dye labeled probes competes for ligation to the primer with probe specificity determined by the 4th and 5th base interrogation during each ligation series, for 5-7 rounds. After each round of ligation, a new primer offset by 1 base is hybridized for a new round of ligations bp are generated through 5 sequential primer reset and ligation rounds. CSB2008 August 2008 UCSC Sequencing Center

34
UCSC Sequencing Center
Library Construction 2 different libraries can depending on the application and desired information. CSB2008 August 2008 UCSC Sequencing Center

35
UCSC Sequencing Center
Fragment Library DNA is fragmented and PCR primer adaptors are ligated to the DNA CSB2008 August 2008 UCSC Sequencing Center

36
UCSC Sequencing Center
Mate-Pair Library DNA is sheared, selected for a desired input size, and circularized around an internal adaptor. CSB2008 August 2008 UCSC Sequencing Center

37
Mate-Pair Library (cont.)
The circularized DNA is enzymatically cleaved to yield 2 DNA fragments separated by an internal adaptor. PCR primer adaptors are ligated on to the end of this piece of DNA. CSB2008 August 2008 UCSC Sequencing Center

38
UCSC Sequencing Center
Emulsion PCR (ePCR) PCR takes place in oil in water microreactors containing P1-coupled beads, templates, primers, and all required PCR reaction components.. CSB2008 August 2008 UCSC Sequencing Center 38
 PCR takes place in oil in water microreactors containing P1-coupled beads, templates, primers, and all required PCR reaction components.. CSB2008 August UCSC Sequencing Center. 38.")
39
UCSC Sequencing Center
ePCR CSB2008 August 2008 UCSC Sequencing Center

40
UCSC Sequencing Center
Emulsion PCR yields both monoclonal (unique templates and polyclonal beads (multiple templates), as well as some non-templated beads. CSB2008 August 2008 UCSC Sequencing Center
, as well as some non-templated beads. CSB2008 August UCSC Sequencing Center.")
41
UCSC Sequencing Center
Clonal Amplification CSB2008 August 2008 UCSC Sequencing Center

42
Post-Emulsion and ePCR
CSB2008 August 2008 UCSC Sequencing Center

43
UCSC Sequencing Center
Bead Enrichment Templated beads are separated from non-templated beads via polystyrene beads CSB2008 August 2008 UCSC Sequencing Center

44
Pre- and Post-Bead Enrichment P2-hybridization
CSB2008 August 2008 UCSC Sequencing Center

45
UCSC Sequencing Center
Bead Deposition Templated beads are modified at their 3’-end and covalently attached to a glass slide. CSB2008 August 2008 UCSC Sequencing Center

46
UCSC Sequencing Center
Slide Configurations CSB2008 August 2008 UCSC Sequencing Center

47
UCSC Sequencing Center
CSB2008 August 2008 UCSC Sequencing Center

48
SOLiD Sequencing Chemistry
CSB2008 August 2008 UCSC Sequencing Center

49
4-color Ligation Reaction
CSB2008 August 2008 UCSC Sequencing Center

50
UCSC Sequencing Center
A complementary dye-labeled probe hybridizes is ligated to the universal sequencing primer. CSB2008 August 2008 UCSC Sequencing Center

51
UCSC Sequencing Center
De-phosphorylation A phosphatase cleaves the 3’-phosphate from the universal sequencing primer preventing ligation to templates where no probe was ligated. CSB2008 August 2008 UCSC Sequencing Center

52
UCSC Sequencing Center
Visualization The fluorescently labeled dyes attached to each probe are visualized. CSB2008 August 2008 UCSC Sequencing Center

53
UCSC Sequencing Center
Cleavage Fluorescent dye labeled nucleotides are cleaved from hybridized probe. CSB2008 August 2008 UCSC Sequencing Center

54
UCSC Sequencing Center
2nd Ligation Cycle The next set of labeled probes hybridize and are ligated to the previously hybridized probe. CSB2008 August 2008 UCSC Sequencing Center

55
2nd Cycle Visualization
CSB2008 August 2008 UCSC Sequencing Center

56
UCSC Sequencing Center
2nd cycle cleavage CSB2008 August 2008 UCSC Sequencing Center

57
Every 5th base is interrogated
CSB2008 August 2008 UCSC Sequencing Center

58
UCSC Sequencing Center
Reset Template is stripped CSB2008 August 2008 UCSC Sequencing Center

59
UCSC Sequencing Center
1st cycle after reset A new set of universal sequencing primers is hybridized, offset by (n-1). CSB2008 August 2008 UCSC Sequencing Center
. CSB2008 August UCSC Sequencing Center.")
60
UCSC Sequencing Center
1st cycle after reset CSB2008 August 2008 UCSC Sequencing Center

61
UCSC Sequencing Center
2nd round CSB2008 August 2008 UCSC Sequencing Center

62
Sequential Rounds of Sequencing with Fragment Library
In each round of sequencing ………….?????????????? CSB2008 August 2008 UCSC Sequencing Center

63
Sequential Rounds of Sequencing with Mate-Paired Library
In each round of sequencing ………….?????????????? CSB2008 August 2008 UCSC Sequencing Center

64
UCSC Sequencing Center
Di-Base Encoding CSB2008 August 2008 UCSC Sequencing Center

65
Advantages of di-Base Encoding
CSB2008 August 2008 UCSC Sequencing Center

66
Advantages of di-Base Encoding Real SNPs
CSB2008 August 2008 UCSC Sequencing Center

67
Advantages of di-Base Encoding Miscall
CSB2008 August 2008 UCSC Sequencing Center

68
Only Certain Transitions are Allowed for Real SNPs
CSB2008 August 2008 UCSC Sequencing Center

69
Only Allowed Transitions
CSB2008 August 2008 UCSC Sequencing Center

70
Two color changes not allowed
CSB2008 August 2008 UCSC Sequencing Center

71
UCSC Sequencing Center
Benefits or solid CSB2008 August 2008 UCSC Sequencing Center

72
Thank you for your attention
CSB2008 August 2008 UCSC Sequencing Center

Similar presentations


 Isolate total RNA Isolate mRNA from total RNA (poly.>")


 Isolate total RNA Isolate mRNA from total RNA (poly.>")


