Download presentation
Presentation is loading. Please wait.

1
C HARACTERIZATION OF S WELLING OF L IQUID C RYSTAL E LASTOMERS Sarah Hicks Palffy lab Spring 2007

2
O UTLINE Introduction Liquid crystal elastomers (LCE) New Liquid Crystal Materials Facility Experiment Swelling/Deswelling Dynamic Swelling Results
 New Liquid Crystal Materials Facility Experiment Swelling/Deswelling Dynamic Swelling Results")
3
INTRODUCTION: LIQUID CRYSTAL ELASTOMERS (LCE) LCE: combination of polymer rubber with anisotropic liquid crystal 1 coupling of orientational order and mechanical strain 2 sample orientation can be achieved by applying mechanical stretching 3,4 or by cross- linking 5
 LCE: combination of polymer rubber with anisotropic liquid crystal 1 coupling of orientational order and mechanical strain 2 sample orientation can be achieved by applying mechanical stretching 3,4 or by cross- linking 5")
4
I NTRODUCTION : L IQUID C RYSTAL M ATERIALS F ACILITY (NLCMF) NLCMF Provide LCE samples developed by different groups to community Duties Aided in the construction of smectic LCE Development of NLCMF Website Characterization of Nematic LCE measured strain of sample versus toluene concentration
 NLCMF Provide LCE samples developed by different groups to community Duties Aided in the construction of smectic LCE Development of NLCMF Website Characterization of Nematic LCE measured strain of sample versus toluene concentration")
5
I NTRODUCTION : D IFFUSION for liquids:thickness of elastomer D=diffusion coefficient ρ=density t=time So, t = 90 s

6
E XPERIMENT : S WELLING /D ESWELLING Sample: 10% cross-linked nematic liquid crystal elastomer Procedure: Circulate hexane solvent into sample. Add toluene in to hexane. Record strain as a function of toluene concentration and time. Decrease toluene concentration. Record changes in sample.

7
E XPERIMENT : S ET -U P

8
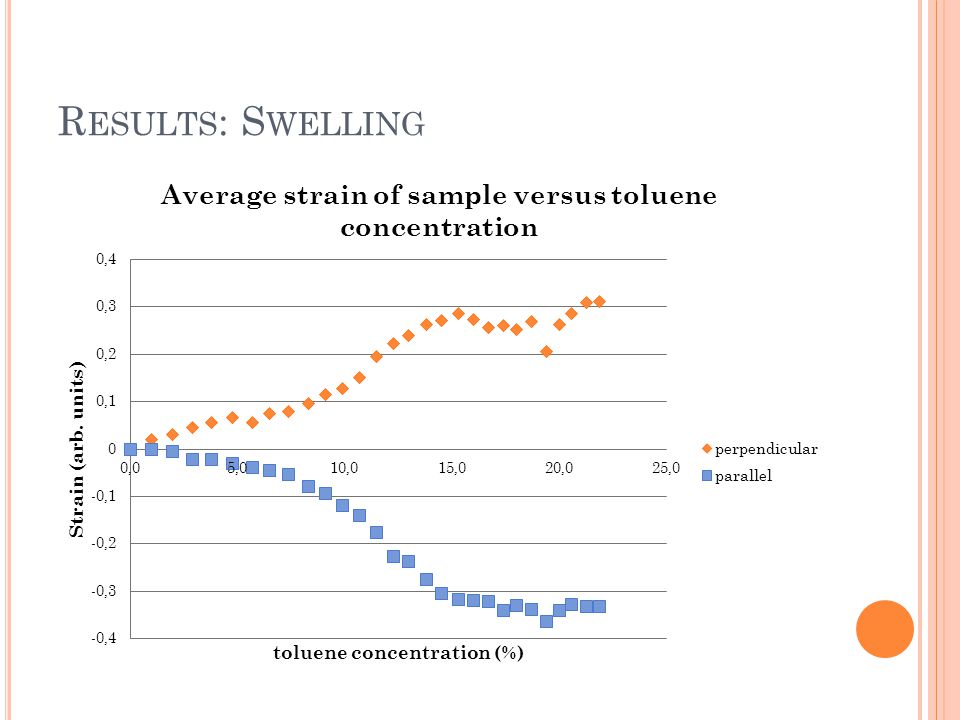
R ESULTS : S WELLING ┴ ║

11
Sample at 0% tolueneSample at 22% toluene

12
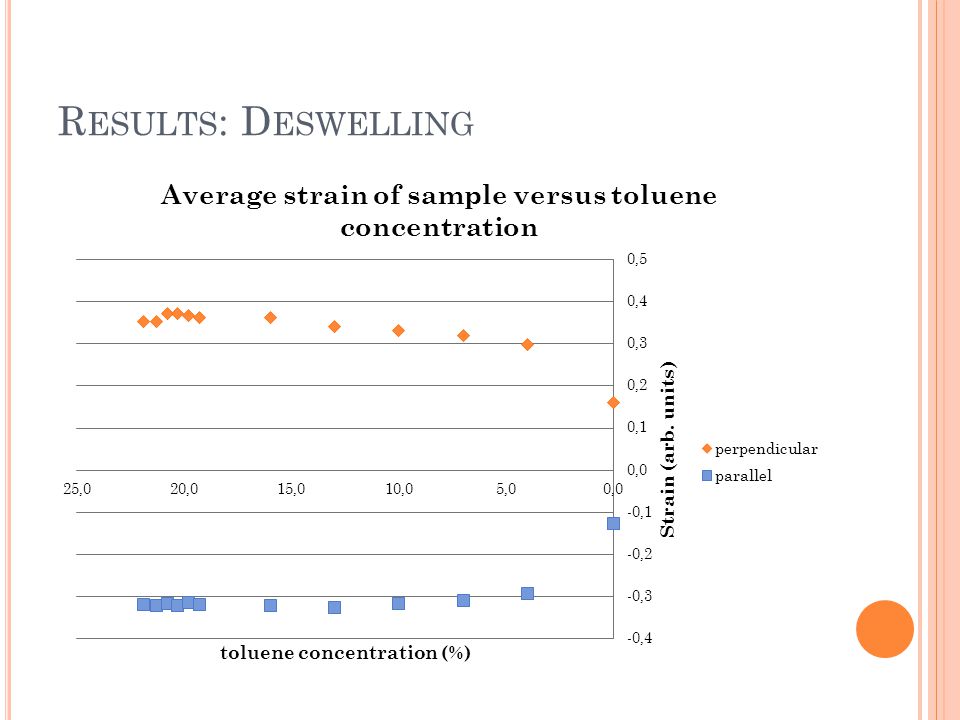
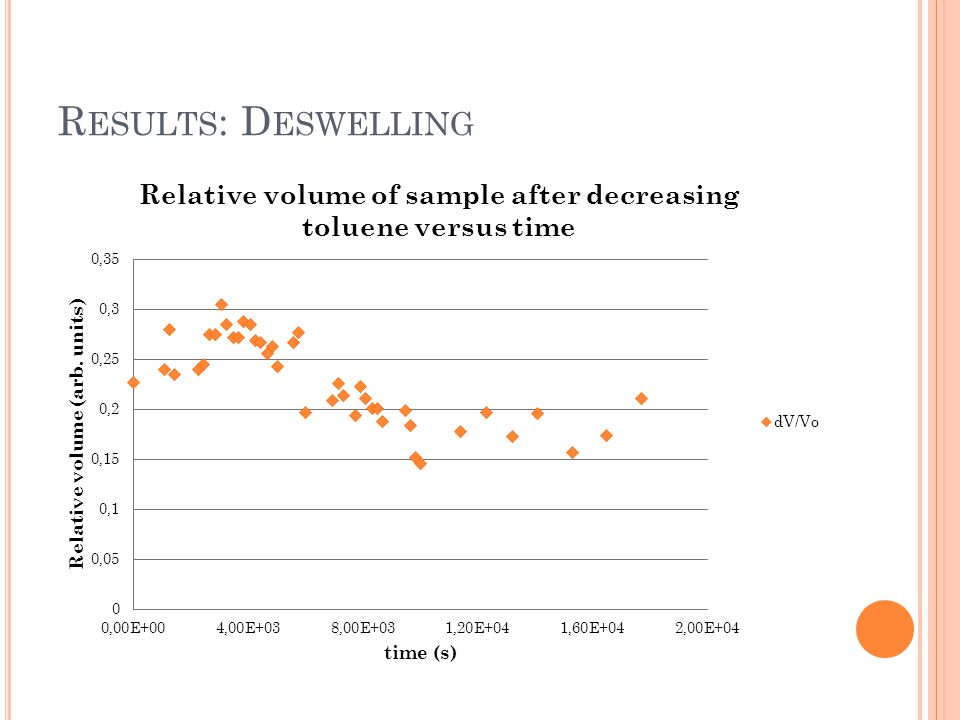
R ESULTS : D ESWELLING

15
Sample at 22% tolueneSample at 0% toluene after 3 hours and 20 minutes

16
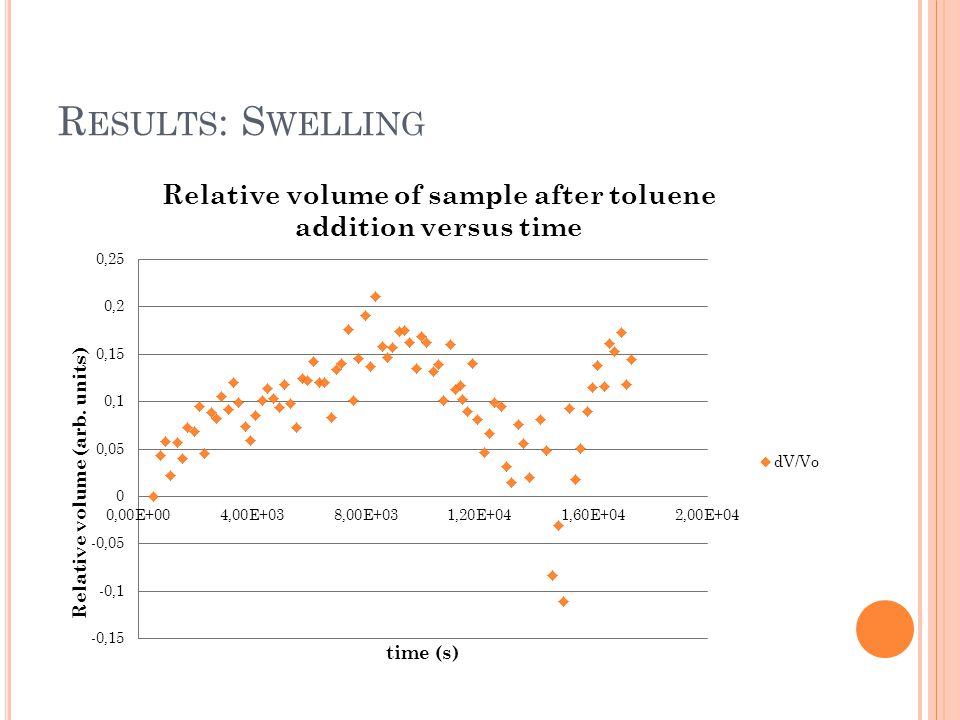
E XPERIMENT : D YNAMIC S WELLING Sample was soaked in a mixture of 15% toluene and the change in dimensions were recorded using a camera. Sample was in the mixture for approximately 90 minutes.

17
R ESULTS : D YNAMIC S WELLING

18
C ONCLUSION With increasing toluene concentration, the strain perpendicular to the nematic director increased while the strain parallel to director decreased. It was vice versa as the concentration was decreased. The perpendicular component was positive and the parallel component was negative. Also, the sample transitioned into the isotropic phase as concentration increased. As the toluene concentration decreased, the sample transitioned back to nematic phase. With the concentration kept constant, the strain perpendicular to the director increased while the strain parallel to director decreased as time progressed before reaching an equilibrium.

19
R EFERENCES 1. W. Gleim and H. Finklemann, Side Chain Liquid Crystalline Polymers, edited by C. B. McArdle, Glasgow: Blackie (1989). 2. H. Schuring, R. Stannarius, C. Tolksdorf, R. Zentel. Macromolecules 34 3962 (2001). 3. T. Eckert, H. Finkelmann. Macromol. rapid Commum., 17 767 (1996). 4. K. Semmler, H. Finkelmann, Macromol. Chem. Phys., 196 3197 (1995). 5. R. Kohler, R. Stannarius, C. Tolksdorf, R. Zentel. Appl. Phys. A 80 381 (2005).
. 2. H. Schuring, R. Stannarius, C. Tolksdorf, R. Zentel. Macromolecules (2001). 3. T. Eckert, H. Finkelmann. Macromol. rapid Commum., (1996). 4. K. Semmler, H. Finkelmann, Macromol. Chem. Phys., (1995). 5. R. Kohler, R. Stannarius, C. Tolksdorf, R. Zentel. Appl. Phys. A (2005)..")
Similar presentations

 Reaction Mechanism.>")


 Jos.>")


 SOLUTIONS AND THIN FILMS Recent research has shown that the charge carrier mobility in.>")


