Download presentation
Presentation is loading. Please wait.

1
Dr. Paul Kershaw University of British Columbia Human Early Learning Partnership March 4, 2011 Kelowna, BC A Canada that Works for All Generations

2
Cracks?

3
Photo credit: www.nvdaily.com/news/2010/07/mayor-removal-of-dam-high-priority.php 25-45 year olds More labour market hours More unpaid domestic hours Children Boomers & Seniors

4
Then Now

5
$ Average Household Income as young adults When Boomers were young adults (1976-1980) Today’s young adults (2004-2008) When Boomers were young adults (1976) Today’s young adults (2009) 9% decline 393% increase Average House price $120,731 $474,274 $72,620 $65,940 56% of women 25- 45 years in labour force 80% of women 25- 45 years in labour force
 Today’s young adults ( ) When Boomers were young adults (1976) Today’s young adults (2009) 9% decline 393% increase Average House price $120,731 $474,274 $72,620 $65,940 56% of women years in labour force 80% of women years in labour force")
6
COHORT Population pressures POP. SIZE (2009)
")
7
CHILDHOOD Biological sensitivity/ opportunity AGEING Biological vulnerability/ frailty …plus biological realities CHILDREN YOUTH 25 - 45 YEAR OLDS BOOMERS JUNIOR SENIORS SENIOR SENIORS

8
Sensitive Periods in Early Brain DevelopmentVision 0 1237654 High Low Years Habitual ways of responding Emotional control Symbol Peer social skills Numbers Hearing Graph developed by Council for Early Child Development (ref: Nash, 1997; Early Years Study, 1999; Shonkoff, 2000.) Pre-school yearsSchool years Language
 Pre-school yearsSchool years Language")
9
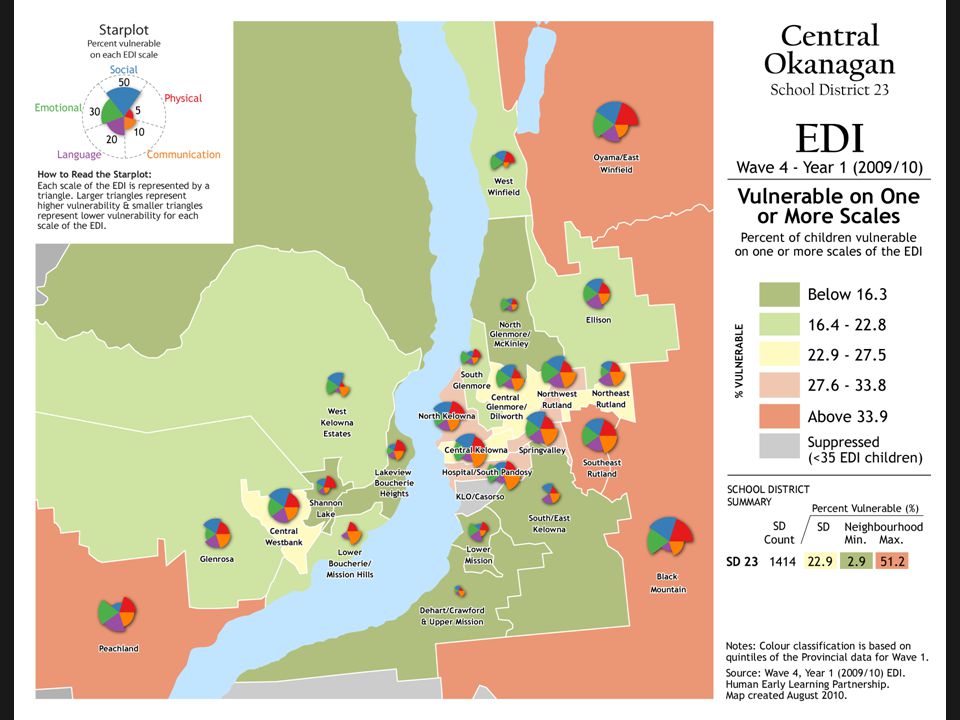
of BC kindergarten children are vulnerable. Vulnerability above 10% is not biologically necessary. 29%

11
Biologically, no neighbourhood need have vulnerability above 10%. >10% <10% Vulnerable on One or More Scales Source: EDI Wave 2 (2004/05 – 2006/07)
.")
12
BC: Unique Population Laboratory: Early Vulnerability Quality of Labour Supply Kindergarten Population Grade 4 Population Grade 7 Population Grade 12 Population Criminal activity

13
to cut incarceration by a third Reduce Early Vulnerability to 10%...

14
to increase university eligibility by a third. Reduce early vulnerability to 10%...

15
# of children Score on scale of EDI and % achieving university eligible grades LowHigh 29%41.5% University eligible grades Vulnerability IfThen At KAt G.12 The next generation’s Human Capital

16
# of children Score on scale of EDI and % achieving university eligible grades LowHigh 10%55.6% University eligible grades Vulnerability IfThen At KAt G.12 The next generation’s Human Capital

17
1960 – 2000: Research shows… Countries with 55% of students getting university-eligible grades vs. Countries with 42% of students getting university eligible grades… ENJOYED.63% OF GDP GROWTH MORE PER YEAR, FOR 40 YEARS

18
Decreased Vulnerability = Increased Growth First cohort of 5 year olds benefit from 15 by 15 policy First cohort graduates Status Quo (29% vulnerable) Reduced vulnerability (10%) That’s throwing away $401.5 billion now + interest over 60 years! We are here Reduced early vulnerability increases GDP by 20% Baseline growth Baseline growth plus 0.63% GDP per year

19
of BC kindergarten children are vulnerable. 29% Most vulnerable children are not poor!

20
Why?

21
CHILDHOOD Biological sensitivity/ opportunity AGEING Biological vulnerability/ frailty CHILDREN YOUTH 25 - 45 YEAR OLDS BOOMERS JUNIOR SENIORS SENIOR SENIORS Demographic heroes?

22
CHILDHOOD Biological sensitivity/ opportunity AGEING Biological vulnerability/ frailty CHILDREN YOUTH 25 - 45 YEAR OLDS BOOMERS JUNIOR SENIORS SENIOR SENIORS Resisting the Intergenerational squeeze $ $

23
Canada has a proud history of Building and Adapting Schools Roads &Railways Universities Markets & Banks World Wars & other conflicts Old Age Security 1951 & C/QPP 1966 Hospital Ins 1957 & Medical Care 1966 What since? Workers Comp & UI

24
Country 2009 Central Government Debt (% GDP) Australia Switzerland Norway NZ Canada Sweden Denmark Germany US France UK Source 8% 21% 26% 28% 36% 38% 44% 53% 61% 75% OECD % increase since 1973 133% CANSIM FISCAL DEBT
 Australia Switzerland Norway NZ Canada Sweden Denmark Germany US France UK Source 8% 21% 26% 28% 36% 38% 44% 53% 61% 75% OECD % increase since % CANSIM FISCAL DEBT")
25
Country 2008 Tonnes CO2/Capita Sweden Switzerland France NZ Norway UK Denmark Germany Canada US Australia Source 5.0 5.7 7.7 7.9 8.3 8.8 9.8 16.5 18.4 18.5 IEA Change in GHG % 1990 level 13% 1% -12% 18% -22% -18% -6% -21% 47% 16% 82% UNFCCC ENVIRONMENTAL DEBT

26
Country Family Policy for Young Children Score/10 Sweden Norway Denmark France NZ UK Germany Switzerland US Australia Canada Source 10 8 8 8 6 5 4 3 3 2 1 UNICEF FAMILY POLICY DEBT

27
Parental Leave (year: 2008) Parents both take 6 months to care for infant. Disposable income relative to couple without children Lower Earner (takes all 12 months) CountryYear Can$ (controlling for PPPs) Year Can$ Denmark12,9151,971 Germany1,1661,054 Sweden1,105-2,530 Quebec-2,548 Austria-3,295-391 Czech Republic-5,945372 Slovak Republic-6,958-2,251 Finland-8,468-4,694 Netherlands-8,624-9,258 Spain-9,941-5,641 UK-10,036-6,274 Belgium-10,298-6,448 Norway-10,687-7,307 Canada (outside of Quebec)-10,353 - 11,779-6,971 New Zealand-12,592-18,999 Italy-15,160-11,653 France-16,085-8,480 Australia-16,343-13,235 Ireland-19,044-10,397 USA-23,119-16,389 Japan-24,019-10,866
 CountryYear Can$ (controlling for PPPs) Year Can$ Denmark12,9151,971 Germany1,1661,054 Sweden1,105-2,530 Quebec-2,548 Austria-3, Czech Republic-5, Slovak Republic-6,958-2,251 Finland-8,468-4,694 Netherlands-8,624-9,258 Spain-9,941-5,641 UK-10,036-6,274 Belgium-10,298-6,448 Norway-10,687-7,307 Canada (outside of Quebec)-10, ,779-6,971 New Zealand-12,592-18,999 Italy-15,160-11,653 France-16,085-8,480 Australia-16,343-13,235 Ireland-19,044-10,397 USA-23,119-16,389 Japan-24,019-10,866.")
28
0.22% Public expenditure on ECEC services (0-6 years) in selected OECD countries Source: Adapted from Starting Strong ll: Early Childhood Education and Care, September 2006, p.11 Denmark Sweden Norway Finland France Hungary Austria United Kingdom United States Netherlands Germany Italy Australia Canada 0%0.5%1.0%1.5%2.0% BC Canada Canada (outside Quebec) Few spaces Insufficient quality High cost Inadequate Inclusion British Columbia Currently 0.22% of GDP 0.28% with full school-day K OECD avg. 0.7% UNICEF & EU benchmark 1.0% 0.25% 0.28% % of GDP

29
Canadian Currency (controlling for purchasing power parities) (2008)
 (2008)")
30
Because there is no system of family policy… Canadian Society is FAILING parents in fundamental ways! Time Poverty Service Poverty Income Poverty Reflects appreciation of costs imposed by residential school system; reserves, etc.

31
Solution?

32
Renew our efforts to build and adapt so that Canada Works for All Generations. Schools Roads &Railways Universities Markets & Banks World Wars & other conflicts Old Age Security 1951 & C/QPP 1966 Hospital Ins 1957 & Medical Care 1966 What next? Workers Comp & UI

33
Enough Time with kids, family and friends Better parental leave more time: +6 months, for dads more $: $932/week, up from $442 minimum: $440/week

34
Enough Time with kids, family and friends 1600 hour annual full-time norm? Canadian 300 more hours/year than German, Dutch and Norwegian citizen 56% of men and 31% of women more than 40 hours 22% of men and 41% of women less than 30 hours Work beyond age 65…

35
Enough Time to make ends meet, to be creative Child Care & Early Learning Services $10/day, from leave through K $7/day, p-t option for @-home parents Provided by caregivers with ECE training Play-based approach to ECD Paid pay equity-level wages Include Parenting Supports & Healthy Child Check-ins

36
In BC, children under 6: Today Smart Family Policy 44%Parental Care Only37% 33%Regulated Care63% 23%Unregulated Care0% 100%

37
Photo credit: www.nvdaily.com/news/2010/07/mayor-removal-of-dam-high-priority.php 25-45 year olds Leave: 15,687 years 1600 norm: 8,428 years Children Boomers & Seniors $ Net benefit: $126 million Under $60K gains Over $60k trading some cash for time $351 million @ minimum wage

38
The price of smart family policy...

39
Time & Income Parental leave $1.1 billion End poverty & Living wage $474 million A Canada that works for all generations: the cost in BC Child Care and Early learning Healthy Child Check-Ins & Parenting Support $91 million 1600 hour annual employ. norm $59 million Less $150 million, because of the progress made, despite recession Services $1.1 billion $2.8Billion/Year

40
$2.8 Billion/Year in BC?!? Less than half what we spend cumulatively on Old Age Security and RRSPs. Eventual returns outweigh costs by 6/1 About 12-20% of total fed/prov health care spending. More sophisticated consumers of policy announcements.

41
$2.8 Billion Increase in Spending? Provincial Health Care Spending ($ Billions) 1998 - 2008 $3B /5 years $3B
 $3B /5 years $3B.")
42
Failure to adapt costs BC employers… Absenteeism: $293 million Productivity:$393 million Retention: $575-800 million Insurance premiums $ 15 million Parental leave top up$ 20 million Sub-total$1+ billion Reduce wage pressures…

43
Failure to adapt costs Government Child welfare: $157 million W/L stress GPs, emerg, hospitalization: $299 million Prescription drugs$ 26 million Sub-total$482 million Reduction in unemployment: 9,950 FTEs Early vuln K-12 costs Poverty health care costs

44
Adapting the dam is a part of our history, good management, smart economics & a just cause. Schools Roads &Railways Universities Markets & Banks World Wars & other conflicts Old Age Security 1951 & C/QPP 1966 Hospital Ins 1957 & Medical Care 1966 Smart Family Policy Workers Comp & UI

45
Trusted Professions in Canada (2007) Fire Fighters97% Nurses94% Farmers92% Teachers89% Doctors87% Politicians15%
 Fire Fighters97% Nurses94% Farmers92% Teachers89% Doctors87% Politicians15%")
47
Thank you. Paul Kershaw, Ph.D. The University of British Columbia College for Interdisciplinary Studies Human Early Learning Partnership (HELP) http://www.earlylearning.ubc.ca/PaulKershaw.htm e-mail: paul.kershaw@ubc.ca
")
Similar presentations


 means increased need for.>")


