Download presentation
Presentation is loading. Please wait.

1
Part 2: Named Discrete Random Variables

2
Chapter 13: Bernoulli Random Variables
math_toolkit/dist/dist_ref/dists/bernoulli_dist.html

3
Bernoulli distribution: Summary
Things to look for: one trial, success or failure Variable: 𝑋= 0 𝑜𝑢𝑡𝑐𝑜𝑚𝑒 𝑖𝑠 𝑎 𝑓𝑎𝑖𝑙𝑢𝑟𝑒 1 𝑜𝑢𝑡𝑐𝑜𝑚𝑒 𝑖𝑠 𝑎 𝑠𝑢𝑐𝑐𝑒𝑠𝑠 Parameter: p = P(S), q = P(F) = 1 – p Mass: P(X = 1) = p, P(X = 0) = q 𝔼(X) = p Var(X) = pq
, q = P(F) = 1 – p Mass: P(X = 1) = p, P(X = 0) = q 𝔼(X) = p Var(X) = pq")
4
Bernoulli Distribution
Do the following follow a Bernoulli distribution? If so, a) What is a failure and what is a success? b) Determine p and q, c) Calculate E and Var. Rolling a fair 4-sided die and observing whether the number showing is a 1 or not. The number of births of girls in a county hospital on any specific day. If a patient takes a drug to see if it is effective or not.
 What is a failure and what is a success b) Determine p and q, c) Calculate E and Var. Rolling a fair 4-sided die and observing whether the number showing is a 1 or not. The number of births of girls in a county hospital on any specific day. If a patient takes a drug to see if it is effective or not.")
5
Bernoulli Distribution(cont)
In a drug trial, some patients with the same condition are given a drug and some are given a placebo to see if the drug is effective or not. In quality control we want to see if a particular product is ‘defective’. We take random samples from an assembly line and check each sample to see if the product is defective. We look at the percentage that a basketball player makes her shots. We want to know how many baskets it takes until she misses a shot.

6
Bernoulli Distribution(cont)
At a certain point in a card game, if you get spade, you with $4, if you get a 2 (except the 2♠), you lose $5, if you get the A♥, you win $20, and if you get any other card, the game ends with no money being exchanged. What is your expected gain or loss? You and 3 friends are playing using the rules above using your own deck. We are interested if a player receives any of the cards listed. What is the expected value of the number people getting one of the above cards? What is the variance of the number of people getting one of the above cards?
, you lose $5, if you get the A♥, you win $20, and if you get any other card, the game ends with no money being exchanged. What is your expected gain or loss You and 3 friends are playing using the rules above using your own deck. We are interested if a player receives any of the cards listed. What is the expected value of the number people getting one of the above cards What is the variance of the number of people getting one of the above cards")
7
Chapter 14: Binomial Random Variables
/Discrete_distributions/Binomial_distribution.htm

8
Binomial Distribution: Situation
In each case, identify whether the situation is binomial are not. If it is binomial, state what the parameters are, n and p. Rolling a fair 4-sided die 5 times and observing whether the number showing is a 1 or not. In quality control we want to see if a particular product is ‘bad’. We take random samples from an assembly line that uses different machines to product the product. We draw 2 cards from a deck without replacement. We are interested in knowing if the cards are red or not.

9
Binomial distribution: Summary
Things to look for: BInS Variable: X = # of success in n trials (0 ≤ X ≤ n) Parameters: n: number of trials (n = 1 Bernoulli) p = P(S) = constant, q = P(F) = 1 – p Mass: 𝑃 𝑋=𝑥 = 𝑛 𝑥 𝑝 𝑥 𝑞 𝑛−𝑥 , 𝑥=0, 1, ⋯, 𝑛 𝔼(X) = np Var(X) = npq
 Parameters: n: number of trials (n = 1 Bernoulli) p = P(S) = constant, q = P(F) = 1 – p Mass: 𝑃 𝑋=𝑥 = 𝑛 𝑥 𝑝 𝑥 𝑞 𝑛−𝑥 , 𝑥=0, 1, ⋯, 𝑛 𝔼(X) = np Var(X) = npq")
10
Binomial r.v. (in class) A restaurant serves eight entrées of fish, 12 of beef, and 10 of poultry. If customers select from these entrées randomly, what is the probability that a) two of the next four customers order fish entrées? b) at most one of the next four customers orders fish? c) at least one of the next four customers orders fish? d)* How many customers would the restaurant have to serve to be sure that there is a 90% chance that at least one of them orders a fish entrée? e) What is the expected number of customers (in the next 4 customers) that will order fish? f) What is the standard deviation of the number of people who order fish?
 two of the next four customers order fish entrées b) at most one of the next four customers orders fish c) at least one of the next four customers orders fish d)* How many customers would the restaurant have to serve to be sure that there is a 90% chance that at least one of them orders a fish entrée e) What is the expected number of customers (in the next 4 customers) that will order fish f) What is the standard deviation of the number of people who order fish")
11
Shapes of Histograms Symmetric Right skewed Left skewed

12
g)What is the mass, graph of mass, graph of CDF?
X 1 2 3 4 else pX(x) 0.289 0.421 0.229 0.056 0.005
")
13
Probability histograms for binomial distributions with different p’s with n = 8

14
Chapter 15: Geometric Random Variables

15
Geometric distribution: Summary
Things to look for: BIS Variable: X = # of trials until the first success (1 ≤ X) Parameters: p = P(S) = constant, q = P(F) = 1 – p Mass: P(X = x) = qx-1p, x = 1, 2, 3, … 𝔼 𝑋 = 1 𝑝 𝑉𝑎𝑟 𝑋 = 𝑞 𝑝 2
 Parameters: p = P(S) = constant, q = P(F) = 1 – p Mass: P(X = x) = qx-1p, x = 1, 2, 3, … 𝔼 𝑋 = 1 𝑝 𝑉𝑎𝑟 𝑋 = 𝑞 𝑝 2")
16
Example: Geometric Distribution
Suppose that we roll an 20-sided die until a '1' is rolled. Let X be the number of times it takes to roll the '1'. Why is this a geometric distribution? What is the PMF of X? What is the probability that it will take exactly 10 rolls? If you decide in advance that you will roll the die 10 times, what is the probability that you will have exactly one ‘1’? How is this different from part c)? What is the expected number of rolls? What is the standard deviation of the number of rolls? *What does the mass look like? *What does the CDF look like?
 What is the expected number of rolls What is the standard deviation of the number of rolls *What does the mass look like *What does the CDF look like")
17
Shape of Geometric PMF

18
Example: Geometric r.v. (cont)
Suppose that we roll an 20-sided die until a '1' is rolled. Let X be the number of times it takes to roll the '1'. What is the probability that it will take no more than 10 rolls? What is the probability that it will take between 10 and 20 rolls (exclusive)? Determine the number of rolls so that the person has a 90% or greater chance of rolling a ‘1’?
 Determine the number of rolls so that the person has a 90% or greater chance of rolling a ‘1’")
19
Example: Geometric r.v. (cont)
Suppose that we roll an 20-sided die until a '1' is rolled. Let X be the number of times it takes to roll the '1'. What is the probability that it will takes more than 10 rolls to roll the ‘1’? Assuming that it takes more than 20 rolls to roll the ‘1’. Find the probability that it will take more than 30 rolls to roll the ‘1’?

20
Chapter 16: Negative Binomial Random Variables
/Discrete_distributions/Negative_Binomial.htm

21
Negative Binomial distribution: Summary
Things to look for: BIS Variable: X = # of trials until the rth success (r ≤ X) Parameters: r = the desired number of successes p = P(S) = constant, q = P(F) = 1 – p Mass: 𝑃 𝑋 = 𝑥 = 𝑥−1 𝑟−1 𝑞𝑥_𝑟𝑝𝑟, 𝑥 =𝑟,𝑟+1, … 𝔼 𝑋 = 𝑟 𝑝 𝑉𝑎𝑟 𝑋 = 𝑞𝑟 𝑝 2
 Parameters: r = the desired number of successes p = P(S) = constant, q = P(F) = 1 – p Mass: 𝑃 𝑋 = 𝑥 = 𝑥−1 𝑟−1 𝑞𝑥_𝑟𝑝𝑟, 𝑥 =𝑟,𝑟+1, … 𝔼 𝑋 = 𝑟 𝑝 𝑉𝑎𝑟 𝑋 = 𝑞𝑟 𝑝 2")
22
Example: Negative Binomial r.v.
Suppose that we roll an n-sided die until a '1' is rolled. Let X be the number of times it takes to roll the ninth '1'. Why is this a Negative Binomial situation? What are the possible values of x? What is the PMF of X? What is the probability that it will take 40 rolls? What is the expected number of rolls? What is the standard deviation of the number of rolls?

23
Comparison: Binomial vs. Negative Binomial
Binomial Negative Binomial Question What is the prob. that that you will roll 9 “1’s in the first 40 rolls? What is the probability that 40th roll will be the 9th ‘1’? Distribution X ~ Binomial (n = 40, p = 0.05) X ~ NegBinomial (r = 9, p = 0.05) Meaning of X X = # of successes = 9 X = # of rolls until the 9th ‘1’ Probabiltiy 𝑃 𝑋=9 = =1.09× 10 −4 𝑃 𝑋=40 = =2.45× 10 −5
 X ~ NegBinomial. (r = 9, p = 0.05) Meaning of X. X = # of successes = 9. X = # of rolls until the 9th ‘1’ Probabiltiy. 𝑃 𝑋=9 = =1.09× 10 −4. 𝑃 𝑋=40 = =2.45× 10 −5.")
24
Chapter 17: Poisson Random Variables
/math_toolkit/dist/dist_ref/dists/poisson_dist.html

25
Examples of Poisson R.V.’s
The number of patients that arrive in an emergency room (or any other location) between 6:00 pm and 7:00 pm (or any other period of time) with a rate of 5 per hour. The number of alpha particles emitted per minute by a radioactive substance with a rate of 10 per minute. The number of cars that are located on a particular section of highway at a given time with an average value of 7 per mile .
 between 6:00 pm and 7:00 pm (or any other period of time) with a rate of 5 per hour. The number of alpha particles emitted per minute by a radioactive substance with a rate of 10 per minute. The number of cars that are located on a particular section of highway at a given time with an average value of 7 per mile .")
26
Examples of Poisson R.V. (extension)
The number of misprints on a page of a book. The number of people in a community living to 100 years of age. The number of wrong telephone numbers that are dialed in a day. The number of packages of cat treats sold in a particular store each day. The number of vacancies occurring during a year in the Supreme Court.

27
Poisson distribution: Summary
Things to look for: BIS* Variable: X = # of successes during the specified ‘period’ Parameters: = the average rate of events Mass: 𝑃 𝑋 = 𝑥 = 𝑒 −𝜆 𝜆 𝑥 𝑥! , 𝑥 =0,1, … 𝔼(X) = Var(X) =
 = Var(X) = ")
28
Example: Poisson Distribution (class)
In any one hour period, the average number of phone calls per minute coming into the switchboard of a company is 2.5. a) Why is this story a Poisson situation? What is its parameter? b) What is the probability that exactly 2 phone calls are received in the next hour? c) Given that at least 1 phone call is received in the next hour, what is the probability that more than 3 are received? d) *What does the mass look like in this situation? e) *What does the CDF look like in this situation?
 Why is this story a Poisson situation What is its parameter b) What is the probability that exactly 2 phone calls are received in the next hour c) Given that at least 1 phone call is received in the next hour, what is the probability that more than 3 are received d) *What does the mass look like in this situation e) *What does the CDF look like in this situation")
29
Shapes of Poisson

30
Example: Poisson Distribution
In any one hour period, the average number of phone calls per minute coming into the switchboard of a company is 2.5. What is the probability that there will be exactly 6 phone calls in the next 2 hours? How many phone calls do you expect in the next 2 hours? What is the probability that there will exactly 6 phone calls in one out of the next three 2-hour time intervals?

31
Example: Poisson Distribution (2) - Class
Every second on average, 5 neutrons, 3 gamma particles and 6 neutrinos hit the Earth in a certain location. Why is this story a Poisson situation? What is the expected number of particles to hit the Earth in that location in the next 5 seconds? What is the probability that exactly 20 particles will hit the Earth at that location in the next 2 seconds? What is the probability that exactly 20 particles will hit the Earth at that location tomorrow from 1 pm to 1:00:02 (2 seconds after 1 pm)?
")
32
Examples of Poisson R.V. (extension) - class
For each of the following, is n large and p small? The number of misprints on a page of a book. The number of people in a community living to 100 years of age. The number of wrong telephone numbers that are dialed in a day. The number of packages of cat treats sold in a particular store each day. The number of vacancies occurring during a year in the Supreme Court.

33
Example: Poisson Approximation to a Binomial - class
On my page of notes, I have 2150 characters. Say that the chance of a typo (after I proof it) is Is the Poisson approximation to the binomial appropriate? What is the probability of exactly 3 typos on this page? What is the probability of at most 3 typos?
 is Is the Poisson approximation to the binomial appropriate What is the probability of exactly 3 typos on this page What is the probability of at most 3 typos")
34
Poisson vs. Binomial P(X = x) Binomial Poisson 0.11636 0.11648 1
1 2 3 4 5 6 7 8 9
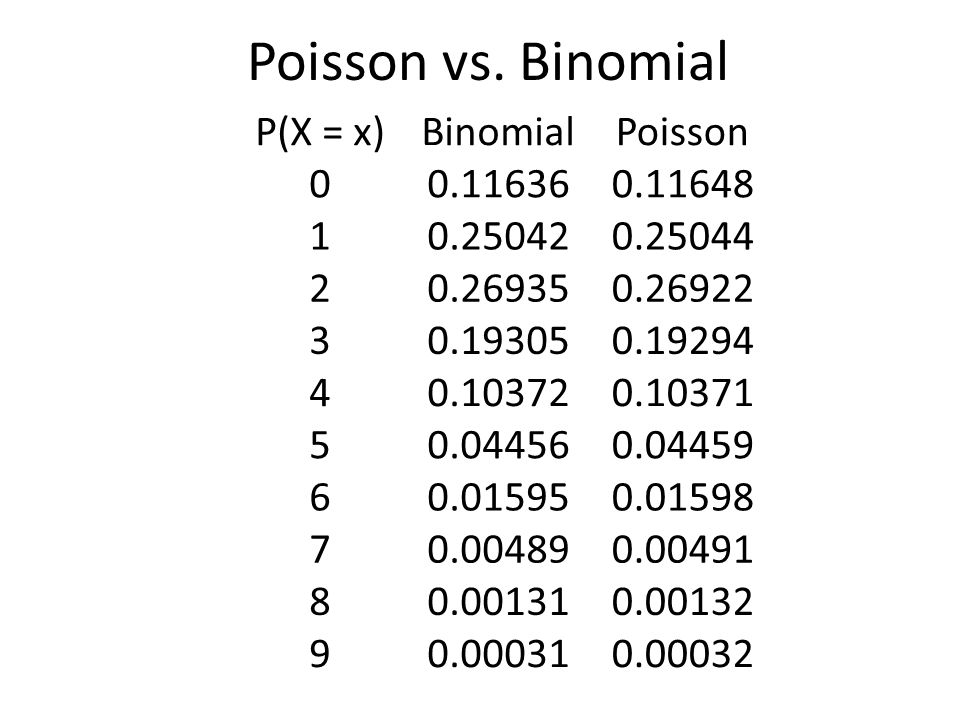
35
Poisson vs. Bionomial

36
Chapter 18: Hypergeometric Random Variables
/Discrete_distributions/Hypergeometric_distribution.htm

37
Hypergeometric distribution: Summary
Things to look for: Bn, without Replacement Variable: X = # of successes Parameters: N = total number of items in population M = total number of successes in population N – M = total number of failures in population n = items selected Mass: 𝑃 𝑋 = 𝑥 = 𝑀 𝑥 𝑁−𝑀 𝑛−𝑥 𝑁 𝑛 𝔼 𝑋 =𝑛 𝑀 𝑁 𝑉𝑎𝑟 𝑋 =𝑛 𝑀 𝑁 1− 𝑀 𝑁 𝑁−𝑛 𝑁−1

38
Example: Hypergeometric Distribution
A quality assurance engineer of a company that manufactures TV sets inspects finished products in lots of 100. He selects 5 of the 100 TV’s at random and inspects them thoroughly. Let X denote the number of defective TV’s obtained. If, in fact 6 of the 100 TVs in the current lot are actually defective, find the mass of the random variable X.

39
Example: Hypergeometric Distribution (2) - class
A textbook author is preparing an answer key for the answers in a book. In 500 problems, the author has made 25 errors. A second person checks seven of these calculations randomly. Assume that the second person will definitely find the error in an incorrect answer. Explain in words what X is in this story. What values can it take? Why is this a Hypergeometric distribution? What are the parameters? What is the probability that the second person finds exactly 1 error? What is the probability that the second person finds at least 2 errors? What is the expected number of errors that the second person will find? What is the standard deviation of the number or errors that the second person will find?

40
Example: Capture-Recapture Sampling
Estimating the Size of a Population. Suppose that an unknown number, N, of bluegills inhabit a small lake and that we want to estimate that number. One procedure for doing so, often referred to as the capture-recapture method, is to proceed as follows: Capture and tag some of the fish, say 250 and then release the fish back into the lake and give them time to disperse. Capture some more of the animals, say 150, and determine the number that are tagged, say 16. These are the recaptures. Use the data to estimate N.

41
Example: Hoosier Lotto (class)
The Lotto. In the Hoosier lotto, a player specifies six numbers of her choice from the numbers 1 – 48. In the lottery drawing, six winning numbers are chosen at random without replacement from the numbers 1 – 48. To win a prize, a lotto ticket must contain two or more of the winning numbers. Confirm the mass of X from the Hoosier lottery web site which is on the next page. (Homework) If the player buys one Lotto ticket, determine the probability that she wins a prize (at least 2 numbers correct). If the player buys one Lotto ticket per week for a year, determine the probability that she wins a prize at least once in the 52 tries. (Hint: What is this distribution?)
 If the player buys one Lotto ticket, determine the probability that she wins a prize (at least 2 numbers correct). If the player buys one Lotto ticket per week for a year, determine the probability that she wins a prize at least once in the 52 tries. (Hint: What is this distribution )")
42
Example: Hoosier Lotto (cont)
These are the odds from the Hoosier lottery ( 6 OF 6 1:12,271,512 5 OF 6 1:48,696 4 OF 6 1:950 3 OF 6 1:53 2 OF 6 1:7

43
Example: Powerball (BONUS)
When playing Powerball, you receive a ticket with five (5) numbers from 1 – 59 and one (1) Powerball number from 1 – 35. Confirm the following odds (including the overall odds of winning):
 numbers from 1 – 59 and one (1) Powerball number from 1 – 35. Confirm the following odds (including the overall odds of winning):")
44
Binomial Approximation to the Hypergeometric

45
Chapter 19: Discrete Uniform Random Variables

46
Discrete Uniform distribution: Summary
Things to look for: equally likelihood situation Variable: X = the choice of the outcome Parameters: N = total number of possible outcomes Mass: 𝑃 𝑋 = 𝑥 = 1 𝑁 , 𝑥=1, 2, …, 𝑁 𝔼 𝑋 = 𝑁+1 2 𝑉𝑎𝑟 𝑋 = 𝑁 2 −1 12

47
Example: Discrete Uniform (class)
A charitable organization is conducting a raffle in which the grand prize is a new car. Five thousand tickets, numbered 0001, 0002, …, 5000 are sold at $10 each. At the grand-prize drawing, one ticket stub will be selected at random from the 5000 ticket stubs a) Why is this a Discrete Uniform distribution, and what is the parameter? b) Explain in words what X is terms of the story? What values can it take on? c) Suppose that you hold tickets numbered 1003 – What is the probability that you win the grand prize? Calculate the following even though they don’t really mean anything. d) What is the expected value of the winning number? e) What is the standard deviation?
 Why is this a Discrete Uniform distribution, and what is the parameter b) Explain in words what X is terms of the story What values can it take on c) Suppose that you hold tickets numbered 1003 – What is the probability that you win the grand prize Calculate the following even though they don’t really mean anything. d) What is the expected value of the winning number e) What is the standard deviation")
48
Chapter 20: Summary of Part III
/univariate-discrete-distributions.html

49
Summary of Discrete Distributions
X

50
Expected values and Variances for selected families of discrete random variables.
Family Param(s) Expected Value Variance Bernoulli p q Binomial n,p np npq Geometric 1/p q/p2 Neg. Binomial r,p r/p qr/p2 Poisson l Hypergeometric N,n,p 𝑛 𝑀 𝑁 𝑛 𝑀 𝑁 1− 𝑀 𝑁 𝑁−𝑛 𝑁−1 Uniform discrete N 𝑁+1 2 𝑁 2 −1 12
 Expected Value. Variance. Bernoulli. p. q. Binomial. n,p. np. npq. Geometric. 1/p. q/p2. Neg. Binomial. r,p. r/p. qr/p2. Poisson. l. Hypergeometric. N,n,p. 𝑛 𝑀 𝑁. 𝑛 𝑀 𝑁 1− 𝑀 𝑁 𝑁−𝑛 𝑁−1. Uniform discrete. N. 𝑁+1 2. 𝑁 2 −1 12.")
51
Example: Determine the Distribution (class)
For each of the following situations, state which distribution (and approximation distribution if applicable) would be appropriate and why. Also please state all parameters. Note: A possible answer is ‘none’. Exercises 20.1 – 20.9 (pp. 271 – 272) Typo is 20.6 Let X be the number of broken ice cream cones…. 20.a: Let X be the number of ice cream cones that you need to sample to find the 2nd waffle cone and the 3rd regular cone if they come from a large, independent population and 10% of the waffle cones are broken and 15% of the regular cones are broken. 20.b: Let X be the number of ice cream cones in your sample which are broken if you sample 50 of them from 2 boxes, one of which was roughly handled and the other was handled normally. Assume that 12% of the cones from the plant are broken and handling the box roughly breaks an additional 2%. 20.c: Let X be the number of broken ice cream cones that you give to your class of 20 if originally 12 of the 100 ice cream cones in the box are broken. To avoid jealousy, you give one ice cream cone per person whether they are broken or not.
 would be appropriate and why. Also please state all parameters. Note: A possible answer is ‘none’. Exercises 20.1 – 20.9 (pp. 271 – 272) Typo is 20.6 Let X be the number of broken ice cream cones…. 20.a: Let X be the number of ice cream cones that you need to sample to find the 2nd waffle cone and the 3rd regular cone if they come from a large, independent population and 10% of the waffle cones are broken and 15% of the regular cones are broken. 20.b: Let X be the number of ice cream cones in your sample which are broken if you sample 50 of them from 2 boxes, one of which was roughly handled and the other was handled normally. Assume that 12% of the cones from the plant are broken and handling the box roughly breaks an additional 2%. 20.c: Let X be the number of broken ice cream cones that you give to your class of 20 if originally 12 of the 100 ice cream cones in the box are broken. To avoid jealousy, you give one ice cream cone per person whether they are broken or not.")
Similar presentations


 = 1/3 and P(T) = 2/3. If we flip this coin three times, the sample space S is the.>")


 Chapter 5: Probability Distributions: Discrete Probability Distributions.>")


 of any event A satisfies 0 < P(A) < 1 Rule 2 : If S is the sample space in a probability model,>")


 that has a single numerical value (determined by chance) for each outcome of an experiment A.>")
